Group 6 Data

We performed tests to compare a smartphone, a laptop, and a tablet with one another. The smartphone used was an iPhone 4 running iPhone 5 software, the laptop used was a Macbook pro, and the tablet used was a nook running android software. We compared each device with regards to battery life, overheating issues, energy consumption, and cost efficiency.

Battery Life: This test was to see how much charge each device’s battery lost over the course of an hour. We tested the battery life of each device using a stopwatch and the device’s charge reading. Each device was tested while they were running Netflix (Netflix test group), and while they were on but not performing any additional tasks (Control test group). A reading of the battery’s remaining charge was taken every five minutes. All data readings were taken in percentage. After all data was collected we calculated the amount of charge the devices lost every five minutes respectively. We then took the average of the charge lost every five minutes to show the average charge lost every five minutes.

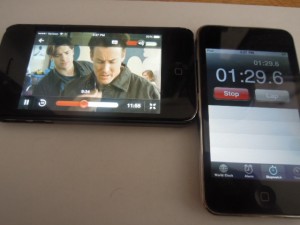
Test set up pictured below (Netflix):

DSCN4413

Loss of charge (Netflix):

Time (minutes) Macbook (%) Tablet (%) Smartphone(%)
0 100 100 100
5 98 97 99
10 95 96 98
15 92 95 95
20 89 93 93
25 87 91 91
30 83 89 88
35 80 87 86
40 77 86 84
45 74 83 82
50 71 81 80
55 68 78 78
60 64 75 76

Charge lost every five minutes (Netflix):

Time (minutes) Macbook (%) Tablet (%) Smartphone (%)
0 0 0 0
5 2 3 1
10 3 1 1
15 3 1 3
20 3 2 2
25 3 2 2
30 4 2 3
35 3 2 2
40 3 1 2
45 3 3 2
50 3 2 2
55 3 3 2
60 4 2 2
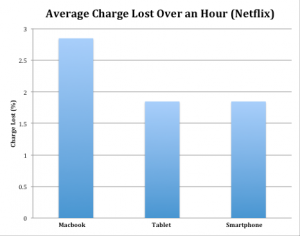
Average: 2.846153846 1.846153846 1.846153846

Loss of charge (Control):

Time (minutes)  Macbook (%) Tablet (%) Smartphone (%)
0 100 100 100
5 97 98 100
10 96 97 100
15 94 95 100
20 92 94 100
25 91 93 99
30 89 91 98
35 88 90 97
40 86 88 96
45 84 86 94
50 82 85 93
55 81 83 91
60 80 81 90

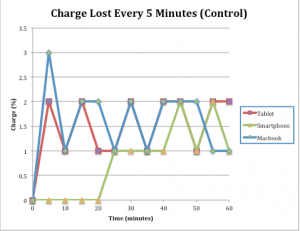
Charge lost every five minutes (Control):

 Time (minutes) Macbook (%) Tablet (%) Smartphone (%)
0 0 0 0
5 3 2 0
10 1 1 0
15 2 2 0
20 2 1 0
25 1 1 1
30 2 2 1
35 1 1 1
40 2 2 1
45 2 2 2
50 2 1 1
55 1 2 2
60 1 2 1
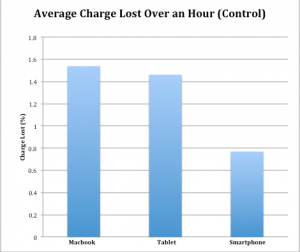
Average 1.538461538 1.461538462 0.769230769

We then took this data and graphed it to compare the devices and the test groups:

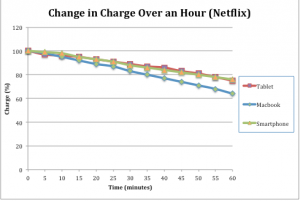
Comparison of the charge lost over an hour in all three devices (Netflix):

Screen Shot 2014-02-20 at 4.47.14 PM

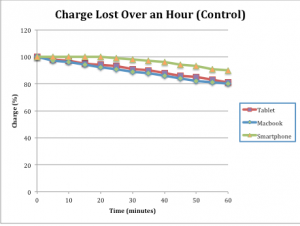
Comparison of the charge lost over an hour in all three devices (Control):

Screen Shot 2014-02-20 at 4.51.47 PM

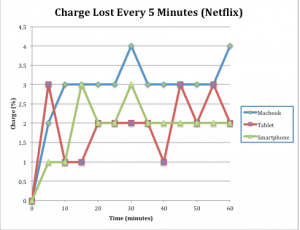
Comparison of the loss in charge every five minutes for all devices (Netflix):

Screen Shot 2014-02-20 at 4.47.55 PM

Comparison of the loss in charge every five minutes for all devices (Control):

Screen Shot 2014-02-20 at 4.51.21 PM

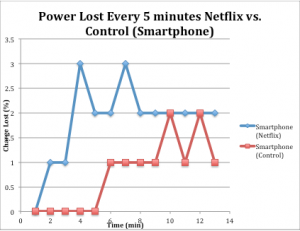
Comparison of the charge lost every five minutes for the Netflix group and the Control group (Smartphone):

Screen Shot 2014-02-20 at 5.04.56 PM

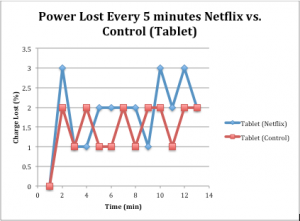
Comparison of the charge lost every five minutes for the Netflix group and the Control group (Tablet):

Screen Shot 2014-02-20 at 5.03.54 PM

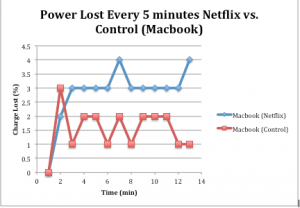
Comparison of the charge lost every five minutes for the Netflix group and the Control group (Macbook):

Screen Shot 2014-02-20 at 5.04.07 PM

Average Charge Lost every 5 minutes for all devices (Netflix):

Screen Shot 2014-02-20 at 4.50.10 PM

Average charge lost every five minutes (Control):

Screen Shot 2014-02-20 at 4.50.54 PM

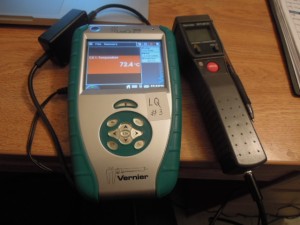
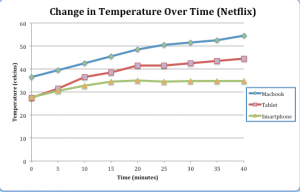
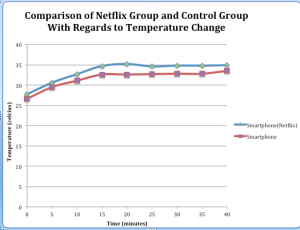
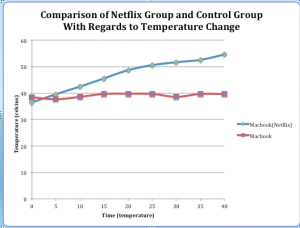
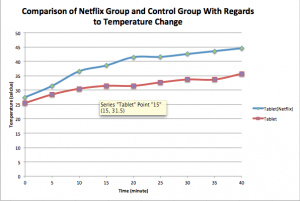
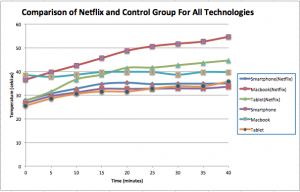
Temperature Change: We recorded the temperature change in all three devices using an Infrared temperature probe. We used this probe in two tests: a control test where the devices were on, but not performing any additional tasks, and a Netflix test where the devices were running Netflix.  A temperature reading was taken every five minutes, and each trial lasted 40 minutes. The probe was placed at the same spot on the device for every reading, the placement of the device was determined prior to testing using the infrared temperature probe to find the hottest spot on the device. After each trial we calculated the overall change in temperature by subtracting the final temperature reading from the initial reading. All temperature data was taken in degrees celsius.

Infrared temperature probe pictured below:

DSCN4402

Change in Temperature (Netflix):

Time (min) Macbook Temp (°C)
Tablet Temp (°C)
Smartphone Temp (°C)
0 36.5 27.5 27.7
5 39.6 31.5 30.6
10 42.5 36.6 32.7
15 45.6 38.6 34.7
20 48.7 41.5 35.2
25 50.6 41.6 34.6
30 51.7 42.6 34.8
35 52.6 43.6 34.8
40 54.6 44.6 34.9
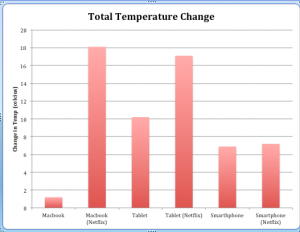
Overall Change 18.1 17.1 7.2

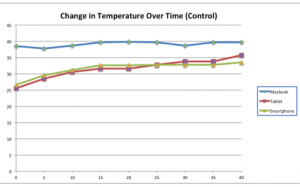
Change in Temperature (Control):

Time (min) Macbook Temp (°C)
Tablet Temp (°C)
Smartphone Temp (°C)
0 38.5 25.5 26.6
5 37.7 28.5 29.5
10 38.6 30.5 31.1
15 39.7 31.5 32.6
20 39.8 31.5 32.6
25 39.7 32.7 32.7
30 38.6 33.7 32.8
35 39.7 33.7 32.8
40 39.7 35.7 33.5
Overall Change: 1.2 10.2 6.9

We then took this data and graphed it to compare the differences in all of the test groups:

Comparison of all three devices in the Control group:

Screen Shot 2014-02-18 at 10.53.23 PM

Comparison of all three devices in the Netflix group:

Screen Shot 2014-02-18 at 11.12.12 PM

Comparison of the temperature change between the Netflix group and the Control group (Smartphone): 

Screen Shot 2014-02-18 at 11.08.35 PM

Comparison of the temperature change between the Netflix group and the Control group (Macbook): 

Screen Shot 2014-02-18 at 11.07.16 PM

Comparison of the temperature change between the Netflix group and the Control group (Tablet):

Screen Shot 2014-02-18 at 10.56.05 PM

Comparison of the difference in temperature between all three technologies in both the Control and the Netflix test groups:

Screen Shot 2014-02-18 at 10.56.21 PM

Comparison of all the devices with regards to the overall temperature change (Netflix and Control):

Screen Shot 2014-02-18 at 11.06.43 PM

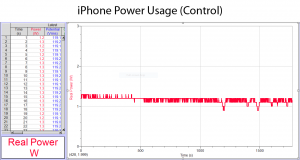
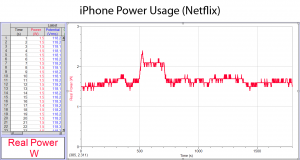
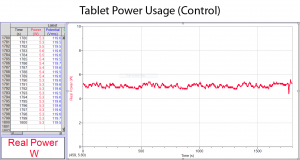
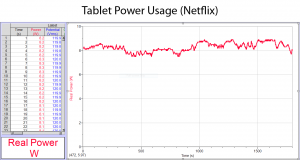
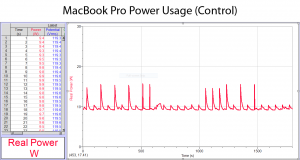
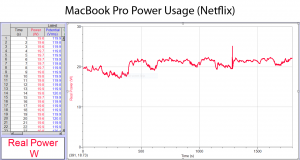
Energy Consumption: We recorded how much power (in watts) each of these devices uses in an hour while idling (control) and while watching a film on Netflix. This was done using a Watts Up Pro and Logger Pro software. First, each device was fully charged, then the control test was done. In the control test, each device’s power consumption was measured while their displays were left on. Afterwards, still with a full charge, the Netflix test was done. Both tests measured the wattage of each device for 30 minutes. The Watts Up Pro took real time measurements of energy consumption and Logger Pro graphed these measurements. The overall wattage used by each device was obtained by taking the integral of each graph in Logger Pro.
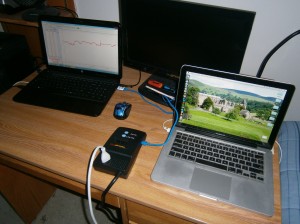
OLYMPUS DIGITAL CAMERAWatts Up Pro setup shown above.

iPhone (Control) iPhone (Netflix)

The iPhone, while idling, used a total of 2,069 watts in 1,775 seconds, which is about 4,196 watts/hour. The iPhone, while watching a video on Netflix, used a total of 3,018 watts in 1,797 seconds, which is about 6,046 watts/hour.

Tablet (Control) Tablet (Netflix)

The tablet, while idling, used a total of 9,133 watts in 1,800 seconds, which is 18,266 watts/hour. The tablet, while watching a video on Netflix, used a total of 14,910 watts in 1,800 seconds, which is 29,820 watts/hour.

MacBook Pro (Control) MacBook Pro (Netflix)

The MacBook Pro, while idling, used a total of 17,640 watts in 1,800 seconds, which is 35,280 watts/hour. The MacBook Pro, while watching a video on Netflix, used a total of 37,180 watts in 1,800 seconds, which is about 74,360 watts/hour.

Device Control Test (W) Netflix Test (W)
iPhone 4,196 6,046
Tablet 18,266 29,820
MacBook Pro 35,280 74,360

Cost Effectiveness: By converting each of these power consumption values to kilowatt hours, we determined the cost to run each of these devices for an hour while both idling and watching Netflix. The average cost of a kilowatt hour in the United States is 12 cents.

iPhone (Control): 2069 W / 1775 s = 2.069 kW / 0.493055555 h = 4.1963 kW/h

4.1963 (12) = 50.3556 cents ($0.50 per hour)

iPhone (Netflix): 3018 W / 1797 s = 3.018 kW / 0.499166666 h = 6.0461 kW/h

6.0461 (12) = 72.5532 cents ($0.73 per hour)

Tablet (Control): 9133 W / 1800 s = 9.133 kW / 0.5 h = 18.266 kW/h

18.266 (12) = 218.712 cents ($2.19 per hour)

Tablet (Netflix): 14910 W / 1800 s = 14.910 kW / 0.5 h = 29.82 kW/h

29.82 (12) = 357.84 cents ($3.58 per hour)

MacBook Pro (Control): 17640 W / 1800 s = 17.640 kW / 0.5 h = 35.28 kW/h

35.28 (12) = 423.36 cents ($4.23 per hour)

MacBook Pro (Netflix): 37180 W / 1800 s = 37.180 kW / 0.5 h = 74.36 kW/h

74.36 (12) = 892.32 ($8.92 per hour)

Device Control Test ($/hour) Netflix Test ($/hour)
iPhone 0.50 0.73
Tablet 2.19 3.58
MacBook Pro 4.23 8.9

Group 9 Data (Spectroscopic and Light Sensor)

We gathered samples of multiple liquids, including mixtures of a few of them, and analyzed them using two separate instruments; a light sensor, and a portable spectrometer.

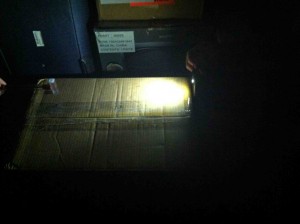
To begin with, we shined light through our samples and measured their opacities using the light sensor.  We took the data in a dark room, holding the samples against the light sensor and exposing it to only one source of light at a constant distance and intensity.  We used a cell phone flashlight.  This is a picture of our experimental setup.

setup 1

The light sensor we used had a slight systematic error of about 2.4 lux, that is, it measured 2.4 lux when completely covered.  We have adjusted for that in the table below.

Liquid Adjusted Opacity Values (Lux)
Water 67
Orange Juice 3.6
Extra Virgin Olive Oil 50
Listerine 63.6
Axe Shower Gel 1.3
Hand Sanitizer 66.8
Sprite 69
Coffee 0.4
Coffee plus Unknown Pineapple Juice 8.9
Shower Gel plus Listerine 19.6
Fireball Cinnamon Whiskey 59
Everclear Grain Alcohol 68.6
Orange Juice plus Oil 5.3
Low Fat Soy Milk 1.1
Whiskey plus Low Fat Soy Milk 3.6
Water plus Low Fat Soy Milk 3.4

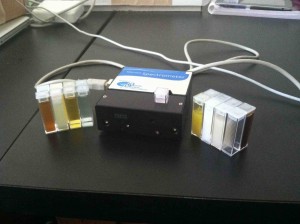
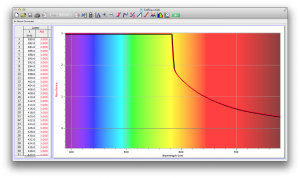
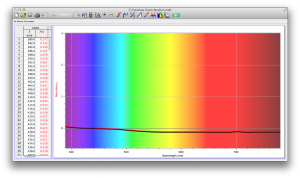
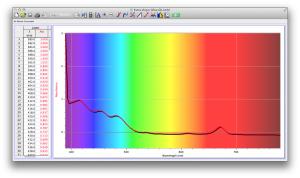
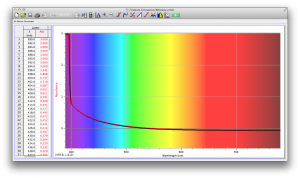
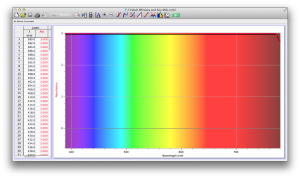
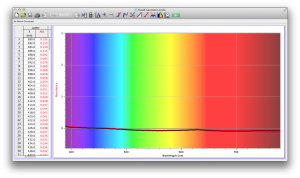
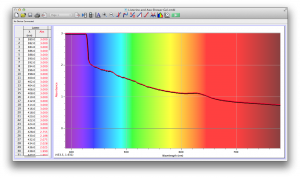
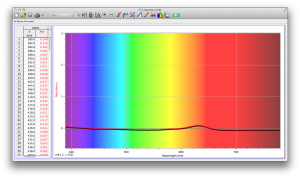
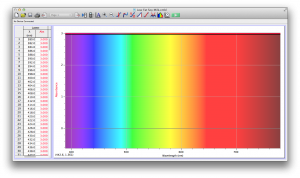
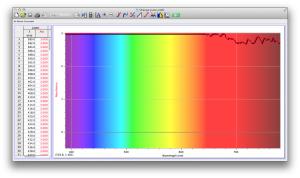
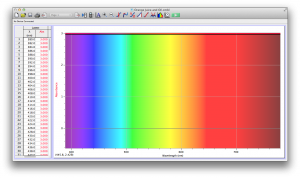
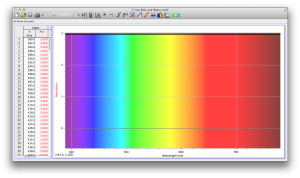
Our second set of data was attained by analyzing our samples through a portable spectrometer.  It also had a small systematic error, which we have accounted for.  The absorption readings were displaced on the y-axis by about 0.5, giving negative absorption readings.  In our graphs, we have displayed the y-axis from -0.5 to 3, which should be read as 0-3.  3 is the maximum opacity that this spectrometer can measure.  The y-axis records absorbance, while the x-axis displays wavelength.  The picture below is of our setup, showing the spectrometer and all the liquid samples we used.

setup 2

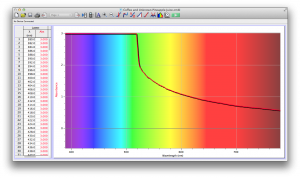
The spectrometer shines light through the samples, and records the absorbance on the wavelengths of the visible spectrum.  Below are our graphs of the data.

axe shower gel graph Axe Shower Gel

coffee and unknown pineapple juice graph  Coffee and Unknown Pineapple Juice

coffee graph  Coffee

everclear grain alcohol graph  Everclear Grain Alcohol

extra virgin olive oil graph Extra Virgin Olive Oil

fireball cinnamon whiskey  Fireball Cinnamon Whiskey

fireball whiskey and soy milk graph Fireball Whiskey and Soy Milk

hand sanitizer graph Hand Sanitizer

listerine and axe shower gel Listerine and Axe Shower Gel

listerine graph Listerine

low fat soy milk graph Low Fat Soy Milk

orange juice  Orange Juice

orange juice and oil graph Orange Juice and Oil

soy milk and water graph Soy Milk and Water

sprite Sprite

watergraph Water


Project Plan

For my project, I plan on using the magnetic probe to take the magnetic field of various sizes and brands of televisions. I will take the measurements using three different positions: flat and horizontal on the screen, flat and vertical to the screen, and perpendicular to the screen. Then I will compare these values to the different brands and sizes, while also observing whether these three different methods result in contrasting readings or minor error. I plan to use popular name brands, as well as store brands: Samsung, Panasonic, Sony, LG, Vizio and Insignia. And in regards to size I will analyze the three most popular sizes: 32″, 40″/42″, and 55″. The study will be conducted at Best Buy since they have the largest assortment of televisions.

Of interest in my project is whether the various ranges from these televisions could possibly cause harm to someone with a heart pacer. Is it safe for someone with a heart pacer to be in the same room or vicinity of these products? If yes, what would be considered the best distance? What I expect to observe is for the larger screen televisions to be more harmful the smaller screen televisions, but am unaware of what to expect in regards to brands.

Since I am the sole person in the group, I do not have concrete meeting times. However, I will begin to collect data this week.

Project Plan

Roles: All members will be equally involved in testing and measuring phases of the project. Each member of the group will take part in operating and observing the function of the rail accelerator and recording the results of test firings. Jarrett Holtz will be in charge of construction of the rail accelerator, and Austin Rau will oversee physics principles in the construction of the device.

Equipment and Supplies: 

  • Aluminum weld bars
  • Sheet of lucite
  • Nuts and bolts
  • 4 disposable cameras (for the capacitors and circuit board)
  • Heavy wire
  • Two switches (not necessary but ideal)
  • Aluminum foil
  • Graphite
  • Steel shot
  • Recording camera
  • EMF meter

Science/Technology Involved: From a scientific perspective the rail accelerator is a utilization of electromagnetism. Current through a pair of parallel metal rails creates a circuit that is closed by a conductive material placed between the charged rails. Completing the circuit creates a Lorentz force that pushed on both the fixed rails and the object between the rails, essentially turning any conductive magnetic material between the rails into a projectile. Technologically the rail accelerator utilizes circuit boards and a carefully constructed circuit to charge a pulse of electricity to be used to generate the Lorentz force necessary to propel the projectile. That along with the design of the rails completes a projectile launching technology using only electromagnetism as sources of propulsion.

Activity Plan:

  1. Construct the actual rail accelerator physical components (the rails and enclosing) build instructions, secondary instructions
  2. Construct the charging circuit and connections to the rails
  3. Test the rail accelerator’s operation initially for repeatable successful firing (firing tests will be done on the archery field)
  4. Test with different sizes and different materials of objects (aluminum foil, graphite, small steel shot)
  5. Measure the electromagnetic field generated by the rail accelerator and charging circuit
  6. Record video of projectile launches for different projectiles
  7. Determine speed using video analysis software for projectile types
  8. Analyze data

We will be meeting with Carl Bertsche on Monday 02/10/14 to get holes drilled in the rails and lucite with which to build the actual rail mechanism. After we have the actual rails finished it will be a matter of completing the charging circuit. All of which will be completed within the week. After that I foresee that with no complications our data will be taken the following weekend, or the beginning of the next week.

Safety Plan: In the construction process and after firing all capacitors will be completely discharged and all power sources removed to account for electrical safety. There should be no power to the device when not in operation. For firing purposes the firing end of the accelerator will be given a clear space, and people will keep clear of the front of the device. In general precaution will be taken with the device during construction and firing, respecting the potential danger of both electricity and projectiles.

Outcomes/Data Expectations: We expect to see a static electromagnetic force generated for each projectile with the speeds varying based on the mass of the projectile and the material. Based on the heat generated by the large amounts of electricity through the projectiles it is possible that we will see some damage (destruction) of the projectiles such as the aluminum foil. I suspect that the lighter materials will move at faster rates, but we don’t expect exceptional speeds from a rail accelerator of a size this small utilizing such a small power bank.

Group 2 Project Plan

Roles: 

Rebecca Gluck, Tim Brown and Elizabeth Berridge will all take on equal roles in Data Collecting, Recording and Analyzing.
Data Collection of Human Voices: Rebecca Gluck
Data Collection of musical Instruments: Tim Brown, Elizabeth Berridge
Data Collection of Concerts: Rebecca Gluck, Tim Brown, Elizabeth Berridge
Data Recorders: Rebecca Gluck, Tim Brown, Elizabeth Berridge
Data Analysis/ Comparing differences in Human Voices/Instruments /Discerning Patterns in images from Concert: Rebecca Gluck, Tim Brown, Elizabeth Berridge
List of equipment and supplies: 
1. Device to view sound waves(plastic cup, balloon, duct tape, mirror shard, laser pointer, paper clip), 2. phone camera, 3. computer 4. Vernier LabQuest Pro Sound Level Meter
What is the science/technology involved?
We will use the device created with a plastic cup, balloon, duct tape, mirror shard, laser pointer, paper clip etc. to have a visual means of reviewing sound waves. The sound will enter the end of the plastic cup and vibrate the balloon stretched across the other end. Attached to the balloon will be a small shard of mirror which will vibrate with the balloon. A laser pointer will be reflecting off the mirror onto a flat surface (most likely a wall). The reflected light on the wall will move in correspondence with the vibrations caused by the sound waves entering the cup. Different sounds have different waves and will create different patterns. By analyzing the visuals we can discern differences in voices and instruments as well as recognize patterns between sounds and their sources.
We will also record the sounds that enter the cup using the Vernier LabQuest Pro Sound Level Meter, which will measure the frequency and decibel level to compare with the visuals and recognize patterns between the two types of data(visual and numerical).
Activity plan (how will you take your data, what equipment will you use). Include dates and meeting times.
We will take our data using the aforementioned devices. We will be meeting at 1 pm on sunday afternoons and begin by creating the two or three cup/balloon devices. Individually throughout the week and on sundays together we will collect data by having different people speak into the cup while one group member records the visuals and another records the numerical data with the Vernier LabQuest Pro Sound Level Meter. We will repeat this process with different subjects as well as with different instruments. Recording data from concerts will depend on when the next concert is scheduled, we will attend said concert and let the sound penetrate the device while recording the data.
What outcome(s)/data do you expect? Why?
We expect to have different data for every sound/voice/instrument because each sound uses a different frequency and therefor has a different wave length which will correspond to a different kind of pattern from the reflected laser pointer. We expect there will be a greater similarities between same sex voices versus opposite sex voices, most likely because of similar frequencies among same sex voices. We expect there will be erratic  numerical and visual data from a concert, as there will be a multitude of sounds and sound waves. We also expect to see data correspond between the visuals, and the numerical data taken with the Vernier LabQuest Pro Sound Level Meter. The patterns that are projected will no doubt change based on the sound wave length and hopefully with the numerical data we will be able to discern which frequencies/sound waves correspond with which patterns.

Project Plan for Group 7

Roles: Each member will be collaborating on conducting initial research on radioactivity, how it pertains to food, performing the experiments, and doing the calculations. In terms of initial research, each member will submit at least one scholarly article pertaining to food radiation in addition to an article about radiation in general. However, the rest of the project will be completed together.

Equipment Used: Vernier Radiation Monitor (to measure the emitted radiation at a given point), Laptop for Research, LabQuest Monitoring Software, various foods (based on list created), and a knife for cutting open food

Science/Technology Involved: The Vernier Radiation Monitor contains a Geiger-Müeller tube, which is built-in in a durable case for portability as well as flexibility when testing. A geiger counter is a type of particle detector, which measures ionizing radiation in a low-pressure gas in the tube. Geiger-Müller tubes have two main elements, which are the tube itself, and the electronics. The Geiger-Müller contains a gas, such as halogens, that are under low pressure. An electrical charge is sent through when a particle or photon of radiation ionizes the gas particles. In order to read a measurable number, the electronics in the tube are able to amplify each ionization via Townsend avalanche effect. Luckily, it requires no battery as it receives power from the data-collection interface. There is a thin glass panel which is then encased by a metal screen, which allows alpha radiation to be measured, along with beta and gamma radiation. This device will allow us to use radiation statistics built into the LabQuest machine, measure the rates of nuclear decay for various food object, and monitor radon progeny. Radon progeny is short-lived radioactive decay of radon-222 that can no longer change into longer life lead isotopes upon decaying.

Activity Plan: 

  1. Decide on various foods to be tested for radiation
  2. Make control measurements of general radiation in the surrounding environment
  3. Construct a container that will keep out as much background radiation as possible
  4. Conduct experiment, measuring each food and being sure to account for environmental radiation and associated variables (where food comes from geographically as well as store location, freshness, and/or variety of fruit); conduct several trials for each food
  5. Calculate the amount of times a given food would have to be consumed to develop acute radiation syndrome
  6. Analyze data via Excel for standard statistics

Expected Outcome: We expect to measure a minute about of radiation that is emitted from foods that we test. However, due to FDA regulations, it is most likely that food at your typical supermarket does not contain an outstanding amount of radiation. However, large consumption of various products can lead to acute radiation poisoning, and will be interesting to compare to FDA regulations as well as other studies in the field.

References: 

Morris, S. H. (1948). US Patent No. 2,522,902. Washington, DC: U.S. Patent and Trademark Office.

George, A. C. (1996). State-of-the-art instruments for measuring radon/thoron and their progeny in dwellings-a review. Health physics70(4), 451-463.

Group 8 Project Plan

Group Roles: In order to effectively collect and analyze data while ensuring that each group member is a part of each step of the process.

Data Collecting: Data Recorder – Hannah; Data Collector 1 – Hunter; Data Collector 2 – Emma

Analyzing/Synthesis: Comparing Differences in Radiation – Hannah; Comparing Radiation to Power – Emma; Research on Safety of Radiation Levels – Hunter

Equipment Used: RF Meter (to test EM field strength around the microwaves at various locations), WattsApp (to measure the microwaves’ power), ~9 microwaves (of various models, ages, and conditions), TI-30X Calculator, Pencils, Notebooks

Science/Technology Involved: When the microwave is turned on, the magnetron, an electron tube in the upper part of the oven, generates microwaves to excite molecules and heat the food.  Despite protective measures to ensure as little radiation seeps through the microwave as possible, such as the metal behind the door and the metal walls meant to reflect the radiation, absorption and leakage occur nonetheless while the microwave is on.  These waves penetrate past the microwave, exciting molecules, to generate an electromagnetic field that emits some amount of radiation. The government has deemed this radiation safe to the human body based on the Specific Absorption Rate (SAR), the rate at which our bodies absorb energy, but others disagree that this exposure is dangerous nonetheless.

The Watts Up Pro meter will also provide us with the technology to measure the power (watts) that each microwave uses to function. With this data we can track correlations between power, and the strength of the generated EM fields.

“Microwave Ovens,” Federal Office of Public Health, 2009. http://www.bag.admin.ch/themen/strahlung/00053/00673/03752/index.html?lang=en

Activity Plan: We will measure the strength of the EM field while a microwave is on and compare how different microwaves emit more or less radiation.  Furthermore, we will test different sides and distances from a microwave to determine if the radiation is 1) stronger at a certain side of the microwave (in the front, or closer to the magnetron, for example) and 2) if the field drops off after a certain distance.

On Friday, February 7th, at 1:00 pm we will walk around to different dorms to determine the status of each microwave.  We predict many of them will be relatively the same model, but if some seem much older or have a lot of wear and tear (for example, the front screen has a hole in them) we will collect data on those individuals to see if there is a correlation between age/wear and tear and EM radiation.  We will also compare power output and radiation.  We will record the power output labeled on each microwave to do so.

We will collect our data on Saturday, February 8th at noon.  We would like to test different microwaves both provided by the college and those provided by MicroFridge.  We hope to test multiples of each brand to ensure our results are consistent. We will use an RF meter to measure the strength of the EM field and use the setting “Max Average” to get an average measurement over the course of a few seconds of radiation emission.  We will collect data in the following table:

Sample #

Location

Brand

Wear and Tear?

M1


M2


M3


M4


M5


M6


M7


M8


M9


Sample #

Power (Watts)

EM Radiation from Front

(1 cm)

EM Radiation from Front

(10 cm)

EM Radiation from Front

(20 cm)

EM Radiation from Right

(1 cm)

EM Radiation from Right

(10 cm)

EM Radiation from Right

(20 cm)

M1


M2


M3


M4


M5


M6


M7


M8


M9


After we have collected the data, we will compile research on various proposed safety levels of microwave radiation, and compare our findings.

Expected Outcomes: Our group expects to confirm the safety of standard consumer model microwaves in regards to the level of microwave radiation emitted. This is due to the rapid falloff in radiation over distance as well as the strict safety standards established by the FDA. The more interesting analysis will be any correlation between the level of radiation, power usage of the unit, and cost of the unit. We expect to find high power microwaves emit higher levels of radiation (though still at safe levels). While cheaper units may theoretically result in less safety precautions, FDA standards should prevent this at any noticeable level.

Emma Foley; Hunter Furnish; Hannah Tobias


Group 4 Project Plan

Group 4 Project Plan

Roles:

Because there are only two of us, we will be collaborating throughout the entire project. We will be completing the data collection together, taking turns measuring and recording each appliance’s energy use and monthly cost. Post data collection, we will divide the recorded data evenly and calculate the cost of powering each of the appliances for an entire semester. We will also work together to complete the rest of the calculations, double checking each other’s work to ensure that any conclusions we end up with are supported by data that is as accurate as possible.

Together we will then analyze our data and see in what ways seniors can save costs by eliminating or limiting the use of certain appliances (such as toaster oven vs. microwave). We will then illustrate this in a simple energy saving plan/diagram.

List of equipment and supplies: –

Watts Up Pro

TH appliances (listed below)

Calculator

Vassar Expenses via Student Accounts

Pencil/Notepad

Microsoft Excel

Google

Science/technology: –

We will be using Watts Up? Pro to measure the monthly average cost (in $) and energy consumption (in watt hours) of each appliance typically found in a TH. We will then use Microsoft Excel to determine the total cost and energy consumption of these appliances over the course of a semester (four months). Due to the fact that some appliances remain plugged in at all times and yet are only “in use” occasionally (e.g. microwave, toaster, floor lamps, etc.), we will be taking two sets of measurements for each of these appliances: one with the appliance just plugged in, and one with it actually in use. We will then be determining about how long each of these appliances is actually in use (versus just plugged in) per day, and we will use this detailed information to calculate a more accurate monthly expenditure and energy consumption for the personal appliances in a Vassar TH. 

Expectations: –

We expect there to be a variety of ways that we as students can save costs and energy consumption. We expect that some appliances (such as microwaves and minifridges) will consume much more energy than others (and be more costly as a result), which can inform our decisions related to appliance use at Vassar as well as in the future when we will be paying our own electricity bills. In addition, we expect that Vassar students receive a pretty fair deal with regards to our flat rate housing costs as we would probably end up having to pay more if we payed for the specific amount of energy we consume each semester.

Activity plan: –

 We will calculate the cost as well as the energy consumption (in watt hours) for all of the personal appliances (did not come with the TH) of one TH for a semester. The Watts Up? Pro will give us the monthly average cost (in $) of using each appliance, and we will multiply this number by 4 to figure out what it would cost to power each appliance for a semester (4 months).

We will meet at TH 108 on Friday, February 14 and together we will go from room to room and record the monthly cost as well as the energy consumption of each personal appliance in the room. We will exclude all appliances that are fixtures in every household such as the main refrigerator, the overhead light fixtures, the heating, and the stove/oven (including light & fan). Although we are aware that these appliances contribute to the overall energy consumption and expenses of each TH, we are considering them to be part of the fixed house expenses (such as rent and water) because they come with every house, and it is also not possible to use the Watts Up? Pro to get calculations for these appliances. Our goal is to focus on the total energy consumption and costs of the appliances that we, as Vassar students, bring in to the THs and for that reason we will only be calculating the electronics we bring. We will consider appliances such as the stove, refrigerator and overhead lighting, as well as the heat, a baseline in cost and energy consumption that should have little variability between houses.

Lastly, we will compile our data and organize it into a simple energy-saving diagram. This will display the relative costs and energy consumption of the appliances measured, informing readers of possible energy-saving and cost-saving techniques (substituting some appliances for other less costly ones) for the future.

List of appliances: –

Kitchen:

– Microwave

  • * Plugged in:
  • * On:

– Waffle Iron

– Rice cooker

– Toaster/ Toaster Oven

  • * Plugged in:
  • * On:

– Kettle

– Coffee maker (can vary)

  • * Plugged in:
  • * On:

– Cake mixer

– Blender

Living/Dining Room:

– Mini fridge(s)

– Lamp(s)

  • * Plugged in:
  • * On:

– Stereo

  • * Plugged in:
  • * On:

– Christmas lights

– Television

  • * Plugged in:
  • * On:

– Game consoles

  • * Plugged in:
  • * On:

 Bedroom (5):

– Christmas lights

– Computer charger

  • * Plugged in:
  • * In use:

– Tablet Charger

  • * Plugged in:
  • * In use:

– Phone charger

  • * Plugged in:
  • * In use:

– iHome/speakers/alarm

  • * Plugged in:
  • * In use:

– Iron

– Mini fridge (again)

– Desk/floor lamp(s) (again)

  • * Plugged in:
  • * On:

– Fan

  • * Plugged in:
  • * On:

Bathroom (2):

– Hair dryer

– Electric toothbrush (charger)

– Curling iron

– Electric Razor

Group 6 Project Plan: A comparison of Smart Technologies

  • Project Goal: The goal of this project is to determine which of the three smart technologies we are testing is the best with regards to overheating, cost effectiveness, energy consumption, and battery life.
  • Roles: We are splitting the test and the resulting analysis equally. Ryan will conduct the tests/analysis regarding cost effectiveness and energy consumption. Nora will conduct the tests/analysis regarding battery life and overheating.
  • Equipment/Supplies: Our experiments will require the following materials: 1. A Watts Up? Pro 2. A temperature probe 3. An infrared temperature probe (if available) 4. Duct tape 5. A stopwatch 6. A Nook HD+ tablet 7. An HTC smartphone 8. A Macbook Pro laptop
  • Science/Technology Involved: We are using a Watts Up? Pro to test both the energy consumption levels of each device and the cost efficiency of each device. A Watts Up? Pro measures the amount of electricity being consumed by a device in real time, it can measure this in both Watts and KWH.  We are also planning on using a Vernier temperature probe and an infrared temperature sensor (if available). The Vernier temperature probe will be duct taped to the back of each device to read temperature increases. The infrared sensor works by reading the black-body radiation (energy) emitted by the device and converting it into a temperature. The infrared temperature probe would be more affective because it does not require contact with the device to measure an increase in temperature. The three devices we are testing are an HTC evo 3D smartphone, a Nook HD+ tablet running Android 4.1 software, and a Macbook Pro Laptop running Mac 0SX version 10.7.
  • Activity Plan: Overheating Test: To test the severity to which each device overheats we will open up Netflix on each device (each device will be tested individually for more accurate data). We will make sure that there are no background programs running on the devices while Netflix is playing. We will choose a show that is either an hour or 30 minutes long depending on the time it takes for the first device’s temp to increase by approximately 10 degrees. At the start of the show we will begin taking the temp, this reading will be at t=0, after every 5 minutes we will record the temperature reading. We will run 2 trials for each device using both a Vernier temp probe and an infrared temperature probe. After all data is collected we will graph temperature versus time and compare the results accordingly. Battery life test: First, after fully charging it, we will turn on the device. As soon as the device  powers on fully we will start a stopwatch. We will record how long it takes for the battery to use up 20%, 40%, 60%, 80%, and finally 100% of its charge. Repeat the test now using Netflix while conducting the test recording how long it takes for the battery to run out of charge. Once all data is recorded we will graph loss of charge versus time and compare the results. Energy Consumption: We will be using the Watts Up Pro to measure how much energy, in watts, each device uses in an hour. We will have each device play a video on Netflix to use up energy. After recording the wattage each device uses, we will import the data from the Watts Up Pro into Logger Pro to get a graph of energy used over time. Cost Effectiveness: Once we determine the energy consumption for each device, will we find the kilowatts used per hour of all three devices. Knowing the price per kilowatt hour, we can convert these numbers into a cost. Taking into account things like the down payment costs of each device and how much a phone plan costs, we can determine which device gives you the most for its cost.
  • Meeting Times: We will meet three times a week. Thursdays at 5:00 pm, and then on Saturdays and Sundays at noon.
  • Expected Data/Outcomes: We expect that with regards to energy consumption the Mac laptop will use the most energy because it has the largest processing system out of the three devices tested. The tablet will follow the laptop in energy consumption, and the phone will use the least amount of energy. With regards to cost effectiveness we expect that the tablet will be the most cost effective because it costs less than a laptop and, though it probably uses more energy, it does not have the cell phone/data plan that a smartphone has. We expect that the laptop will have the best battery life, because it has the biggest battery and therefore has more energy to consume than both the tablet and the smart phone. The tablet will probably have the second best battery life, and the phone will probably have the worst. Once again, this hypothesis is based off the difference in battery size and the fact that battery life is most likely directly proportional to energy consumption. Lastly, with regard to temperature data, we expect that the phone’s temperature will increase the most when using Netflix, then the tablet, and then the laptop. This is because the phone has the smallest processor so using Netflix will be the most taxing to this device.

Group 3 Project Plan: The effects of a variety of sounds on the human ear

Roles:

All group members are responsible for collecting data, as well as posting information on the blog regarding their data. They will also input data onto a spreadsheet for the entire group to see.

List of equipment and supplies:

We will be using a sound meter to measure the amplitude of the sound waves we are exposed to.

What is the science/technology involved?

Sound meters use microphones to detect sound waves and measure the properties (amplitude, frequency, etc) of these waves.

Activity plan (how will you take your data, what equipment will you use). Include dates and meeting times.

Each group member will have their own sound meter. The members will then record the sounds they encounter throughout the week of February 16th. Such sounds will include music through speakers/computer, music through headphones, conversations through cell phones, orchestra concerts, class lectures, crowded dining halls (both ACDC and The Retreat), Villard room party, noise heard through dorm walls/doors, and Vassar’s Infant Toddler Center. Whenever possible, each type of sound will be recorded by at least two different group members for comparison. Throughout the week, group members will add their data to the group’s spreadsheet. At the end of the week (February 22nd), the group will decide (via email) whether more data needs to be taken. The group will meet to discuss and analyze data on February 23rd.

What outcome(s)/data do you expect? Why?

We expect to find consistent, but not identical, data between group members for each activity, since the activities should produce around the same amplitude of sound. Any individual differences may be due to the use of different equipment or to minor, uncontrollable variables. We also expect to find that some activities have a sound amplitude that can be dangerous over extended periods of time, whereas others are harmless.