Tag Archives: project plan

Group 8 Project Plan

Group Roles: In order to effectively collect and analyze data while ensuring that each group member is a part of each step of the process.

Data Collecting: Data Recorder – Hannah; Data Collector 1 – Hunter; Data Collector 2 – Emma

Analyzing/Synthesis: Comparing Differences in Radiation – Hannah; Comparing Radiation to Power – Emma; Research on Safety of Radiation Levels – Hunter

Equipment Used: RF Meter (to test EM field strength around the microwaves at various locations), WattsApp (to measure the microwaves’ power), ~9 microwaves (of various models, ages, and conditions), TI-30X Calculator, Pencils, Notebooks

Science/Technology Involved: When the microwave is turned on, the magnetron, an electron tube in the upper part of the oven, generates microwaves to excite molecules and heat the food.  Despite protective measures to ensure as little radiation seeps through the microwave as possible, such as the metal behind the door and the metal walls meant to reflect the radiation, absorption and leakage occur nonetheless while the microwave is on.  These waves penetrate past the microwave, exciting molecules, to generate an electromagnetic field that emits some amount of radiation. The government has deemed this radiation safe to the human body based on the Specific Absorption Rate (SAR), the rate at which our bodies absorb energy, but others disagree that this exposure is dangerous nonetheless.

The Watts Up Pro meter will also provide us with the technology to measure the power (watts) that each microwave uses to function. With this data we can track correlations between power, and the strength of the generated EM fields.

“Microwave Ovens,” Federal Office of Public Health, 2009. http://www.bag.admin.ch/themen/strahlung/00053/00673/03752/index.html?lang=en

Activity Plan: We will measure the strength of the EM field while a microwave is on and compare how different microwaves emit more or less radiation.  Furthermore, we will test different sides and distances from a microwave to determine if the radiation is 1) stronger at a certain side of the microwave (in the front, or closer to the magnetron, for example) and 2) if the field drops off after a certain distance.

On Friday, February 7th, at 1:00 pm we will walk around to different dorms to determine the status of each microwave.  We predict many of them will be relatively the same model, but if some seem much older or have a lot of wear and tear (for example, the front screen has a hole in them) we will collect data on those individuals to see if there is a correlation between age/wear and tear and EM radiation.  We will also compare power output and radiation.  We will record the power output labeled on each microwave to do so.

We will collect our data on Saturday, February 8th at noon.  We would like to test different microwaves both provided by the college and those provided by MicroFridge.  We hope to test multiples of each brand to ensure our results are consistent. We will use an RF meter to measure the strength of the EM field and use the setting “Max Average” to get an average measurement over the course of a few seconds of radiation emission.  We will collect data in the following table:

Sample #

Location

Brand

Wear and Tear?

M1


M2


M3


M4


M5


M6


M7


M8


M9


Sample #

Power (Watts)

EM Radiation from Front

(1 cm)

EM Radiation from Front

(10 cm)

EM Radiation from Front

(20 cm)

EM Radiation from Right

(1 cm)

EM Radiation from Right

(10 cm)

EM Radiation from Right

(20 cm)

M1


M2


M3


M4


M5


M6


M7


M8


M9


After we have collected the data, we will compile research on various proposed safety levels of microwave radiation, and compare our findings.

Expected Outcomes: Our group expects to confirm the safety of standard consumer model microwaves in regards to the level of microwave radiation emitted. This is due to the rapid falloff in radiation over distance as well as the strict safety standards established by the FDA. The more interesting analysis will be any correlation between the level of radiation, power usage of the unit, and cost of the unit. We expect to find high power microwaves emit higher levels of radiation (though still at safe levels). While cheaper units may theoretically result in less safety precautions, FDA standards should prevent this at any noticeable level.

Emma Foley; Hunter Furnish; Hannah Tobias
 

Group 11 Project Plan

Roles

Carolyn will research the HAARP facility’s research on the creation of atmospheric auroras. She will write a summary of the physics of HAARP’s experiments with radio waves on the ionosphere, and will create a 3D animation of the creation of an aurora to illustrate the physics of the process. Kenny will research the electromagnetic waves that HAARP produces and their effect on the weather and geophysical events. Specifically, he will explore the conspiracy theorists’ claims that HAARP has been used to generate recent earthquakes. He will also look at how HAARP is portrayed in the media and whether the portrayal is accurate.

Tech Involved

Carolyn will use Autodesk Maya to create the 3D animation. Kenny will research the properties of electromagnetic waves, resonance frequency, and the science of earthquakes

The HAARP facility uses 360 radio transmitters and 180 antennas to produce radio waves that are absorbed between 100 and 350 km altitude.

Activity Plan

We will meet every Friday at 12:30 to consolidate our research and writings. We will communicate by email during the week and use Google Docs to compile our writing in the cloud. We will use research from credible sources, such as scientific journals and textbooks, and Kenny will examine the conspiracies surrounding HAARP that are on the internet and in the media.

Outcomes

Carolyn’s research and animation should clearly demonstrate how HAARP’s precisely-controlled radio waves can produce visible auroras in the ionosphere. Kenny predicts that the power of the ELF waves that HAARP produce have been greatly exaggerated by conspiracy theorists and that HAARP has not been used to generate earthquakes.

Project Plan

  • Roles:
  1. Rebecca Valencia:  Technology Background Researcher/Record-Data Keeper
  2. Tamila Shalumova: Experimenter/Instrument Wielder
  3. Zach Ward: Historical/ Economic Researcher
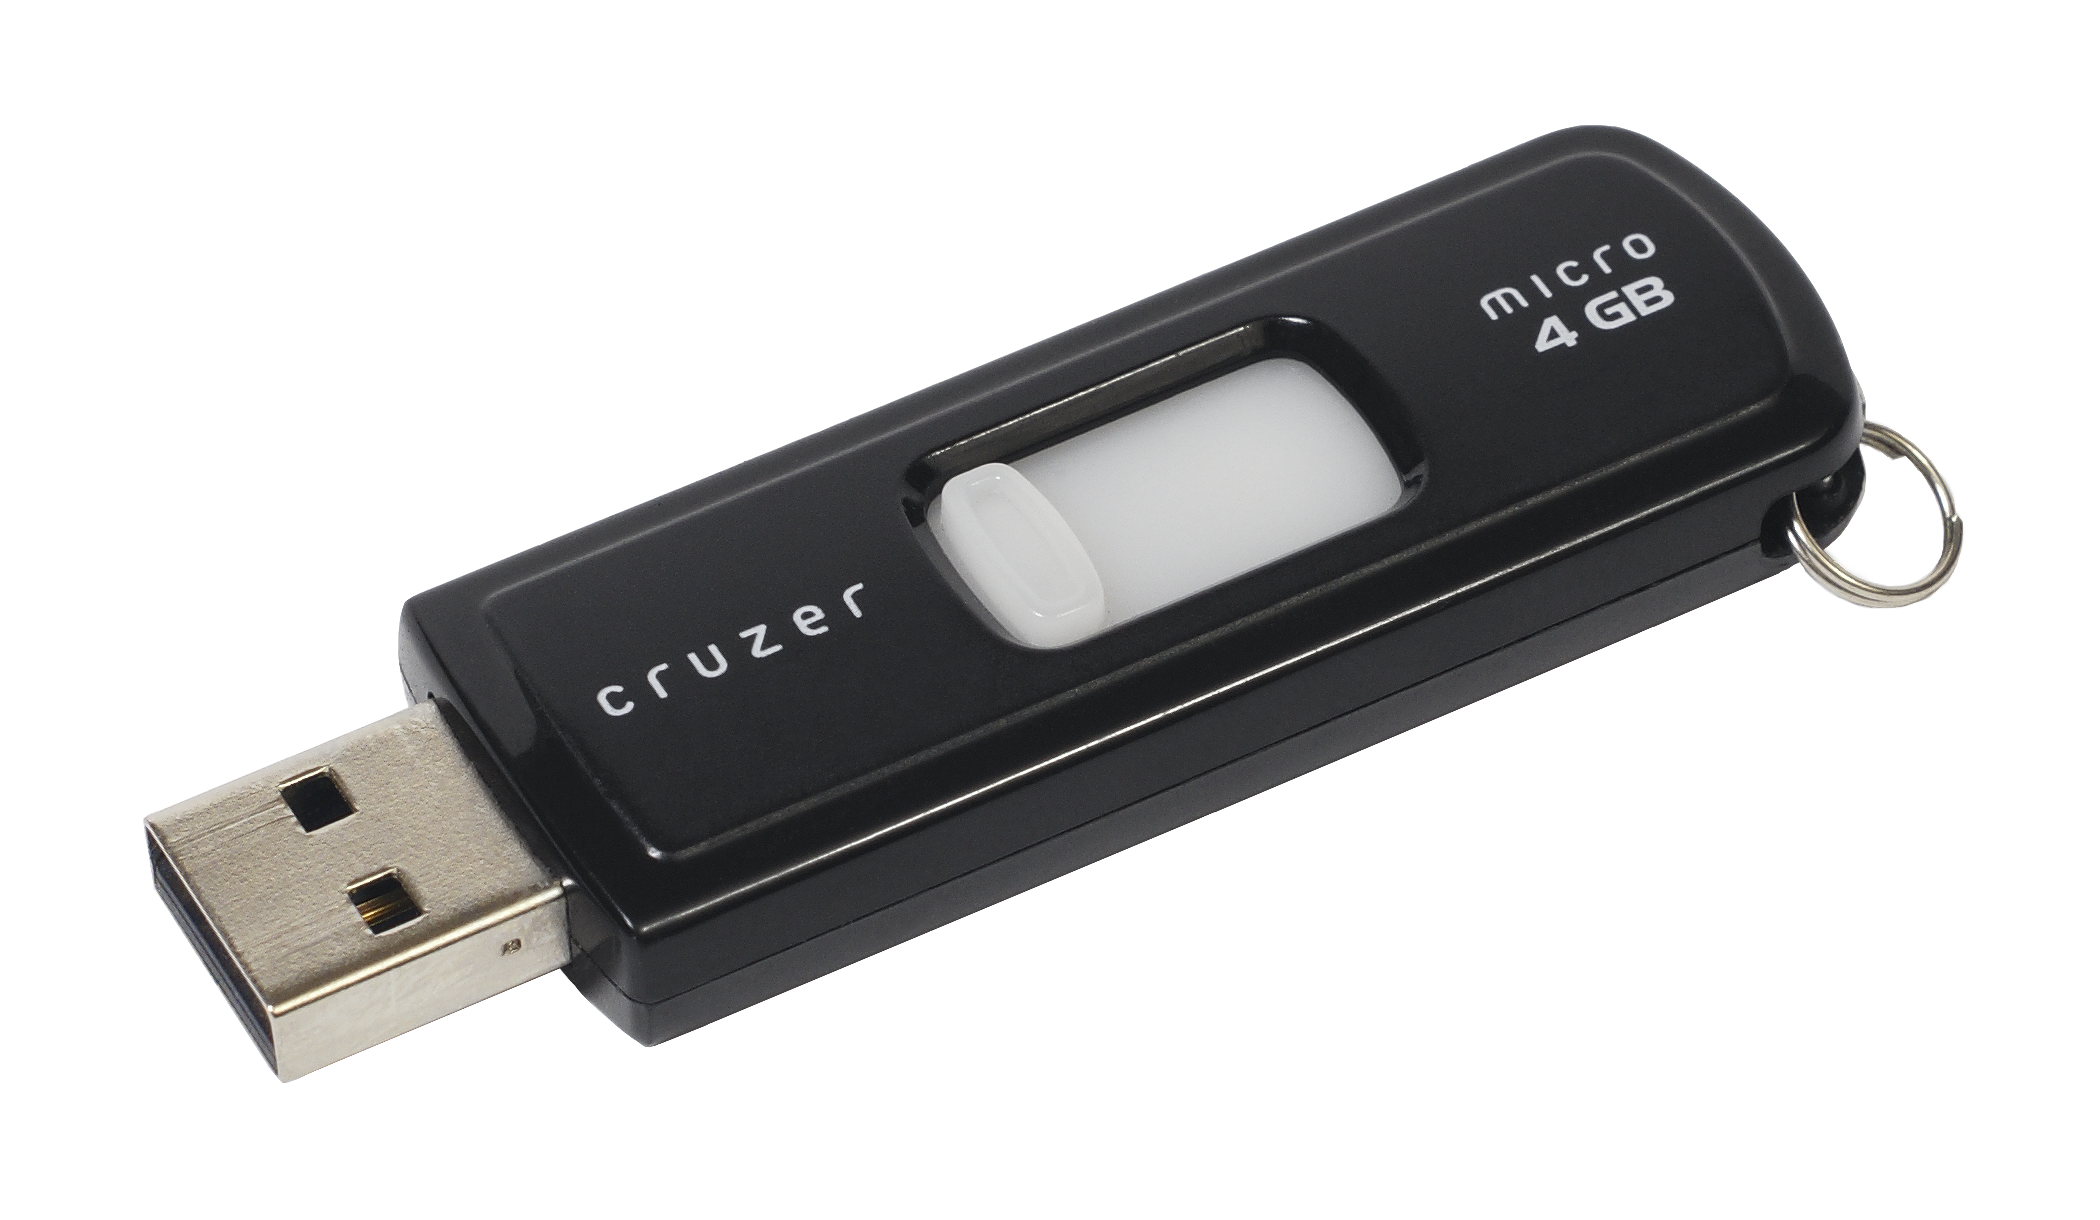
  • Our group plans on investigating exactly how a jump drive uses electricity in its ability to store information quickly, conveniently, and safely in a static state form (meaning that there are no moving parts which make up the body of the jump drive itself). The modern flash drive is derivative of past forms of memory saving technologies, including floppy drives and zip disks. However, the science that goes into a jump drive has been miniaturized and maximized. We will be investigating how electricity and semiconductor technology have evolved in such a way that we can now carry 4 GB or more of memory in our pockets.
  • We plan on utilizing the Watts Up Pro electricity measuring device to perform a series of experiments where we 1) figure out the computer’s baseline electricity usage level 2) measure the electricity output whilst the jump is uploading and downloading information. We will then subtract the difference in order to discover how much electricity the jump drive itself must use in order to carry these tasks. We will also examine how price of jump drive and level of memory have had an inverse relationship over the years. Using this information, we may be able to predict the price of jump drives in the next 5 years. We will meet each Thursday night as needed around dinner time so that we may perform our initial tasks of researching the technology behind jump drives, collecting and analyzing data, and finally, completing the price chart.
  • We expect that the prices of USB drives have gone down as the size of the memory capacity has gone up over the years. We do not expect the USB drive to consume a great deal of power, considering that most external drives do not use a source other than the computer unless they are larger than 500 GB.

Source: http://upload.wikimedia.org/wikipedia/commons/8/86/SanDisk_Cruzer_Micro.png

The Science of Mind-reading, part II

Group 13: Project Plan

Our project, as described previously, is to investigate the science of “mind-reading.”

We will perform a review of primary literature as found through the library’s many databases to understand where this technology is today and where it may go in the future. Most of this research will be done independently; we will meet weekly (the day will vary week to week based on our individual schedules) to compile the information we find. Relevant data and results from recent fMRI studies will be presented in our poster.

Each of us will focus on a specific topic:

  • Maddy: How fMRI (the primary tech used for “mind-reading”) works
  • Adam: Current research being done
  • Jackie: Applications of “mind-reading” technology

We expect to find that although no one can currently “read” a person’s thoughts, memories, or dreams, researchers are working on this — right now, you need to obtain template images of a person’s brain during different activities for later comparisons and predictions about what the person is thinking. Reading “abstract” thoughts isn’t yet possible.