1. Calculation Explanation
In order to account for the total amount of radiation being emitted from the sample, an estimate of the surface area of radiation emittance had to be calculated. Due to the fact that only one Geiger-Müller tube was being used, the surface area of our detector could only detect a small set of a whole sphere that surrounds our sample. It was found that each sample was  from our detector, which gives the radius of sphere of emittance.
Surface area of a sphere 
in our case 
and thus 
Now we need to find out how many of our detectors will fit into this area. Measuring the radius of our circular detector we get 
so 
so the factor we will multiply our counts by is  . We will call this constant
  for simplicity.
Here are some more variables and constants we wish to define.
 The total counts per minute measured in the blank room
 The total counts per minute measured for a sample
 Amount of detectors in our sphere
 Average time it takes to digest a food product
 Max energy of a beta particle
  J
J
From these constants and variables, we can see that the total amount of energy absorbed due to radiation 
To calculate the total amount one must consume of an object to induce death, it was found that 2  of radiation was enough to give ones self acute radiation poisoning over a period of 6-8 weeks. 1
  . So assuming an average person who weighs
  The amount of energy to kill them would be
lastly to find the total amount one must eat of a given food would be our equation above over 
(1) 
2. Data
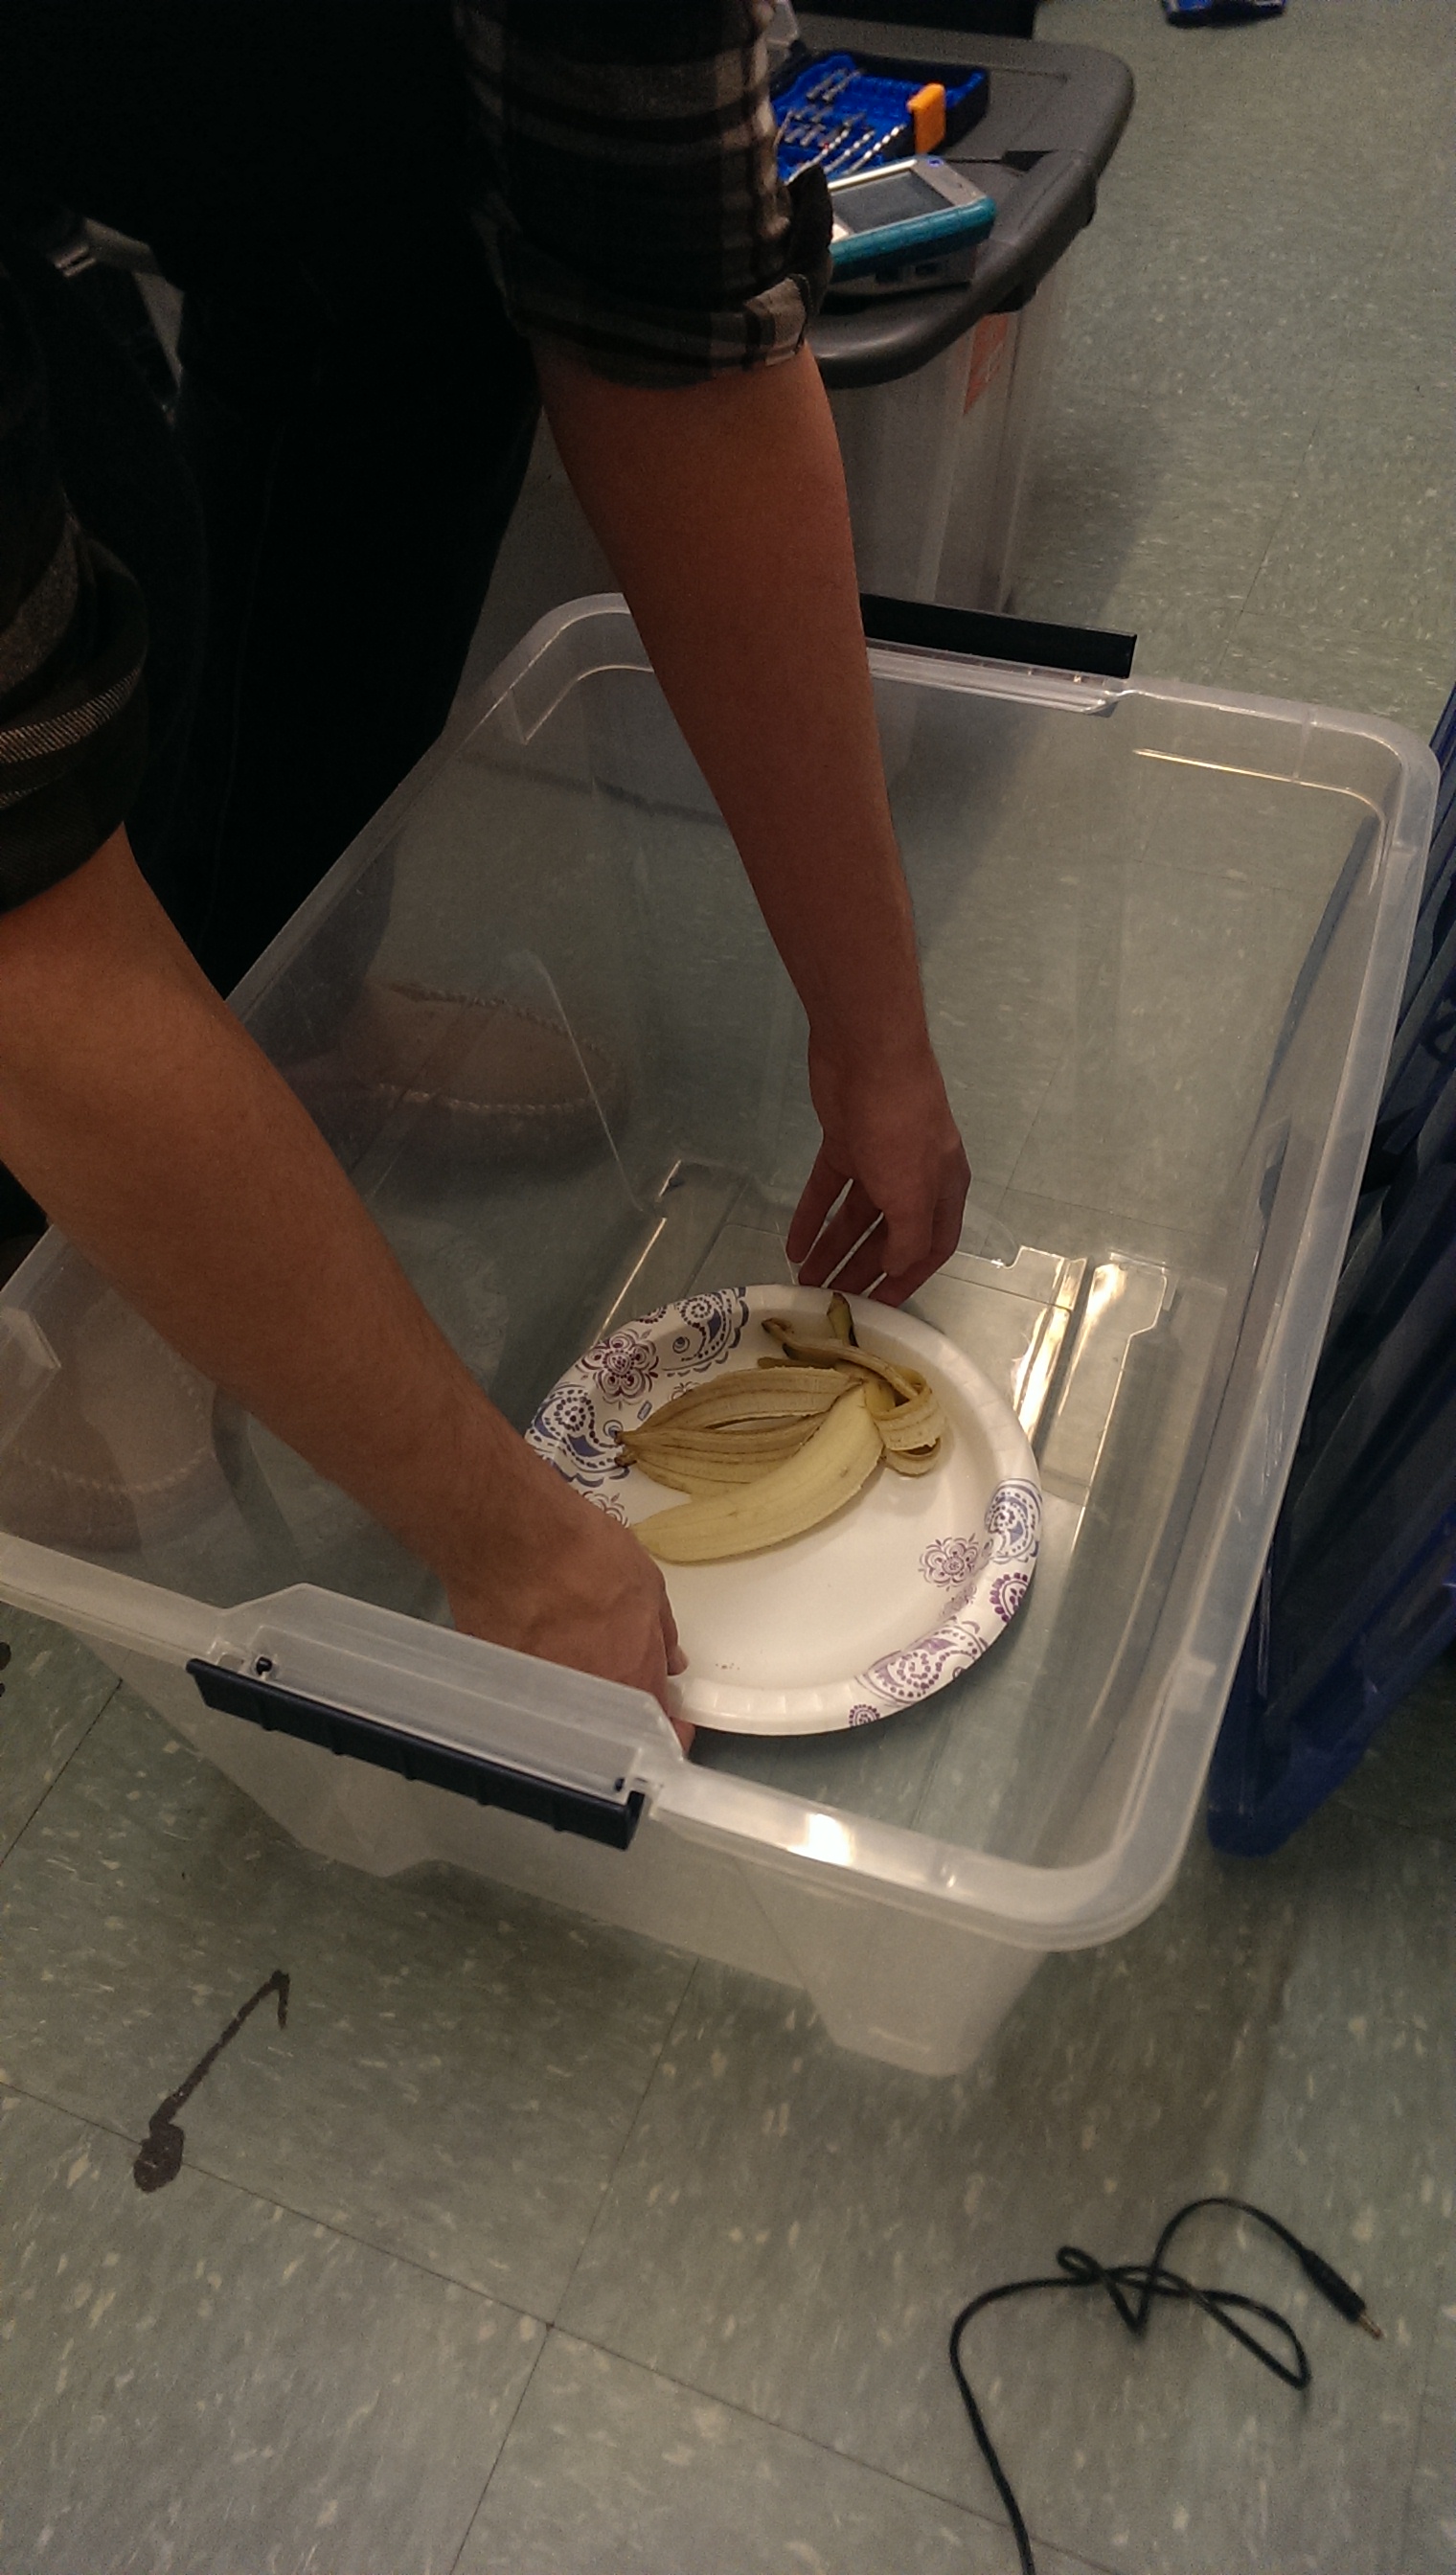
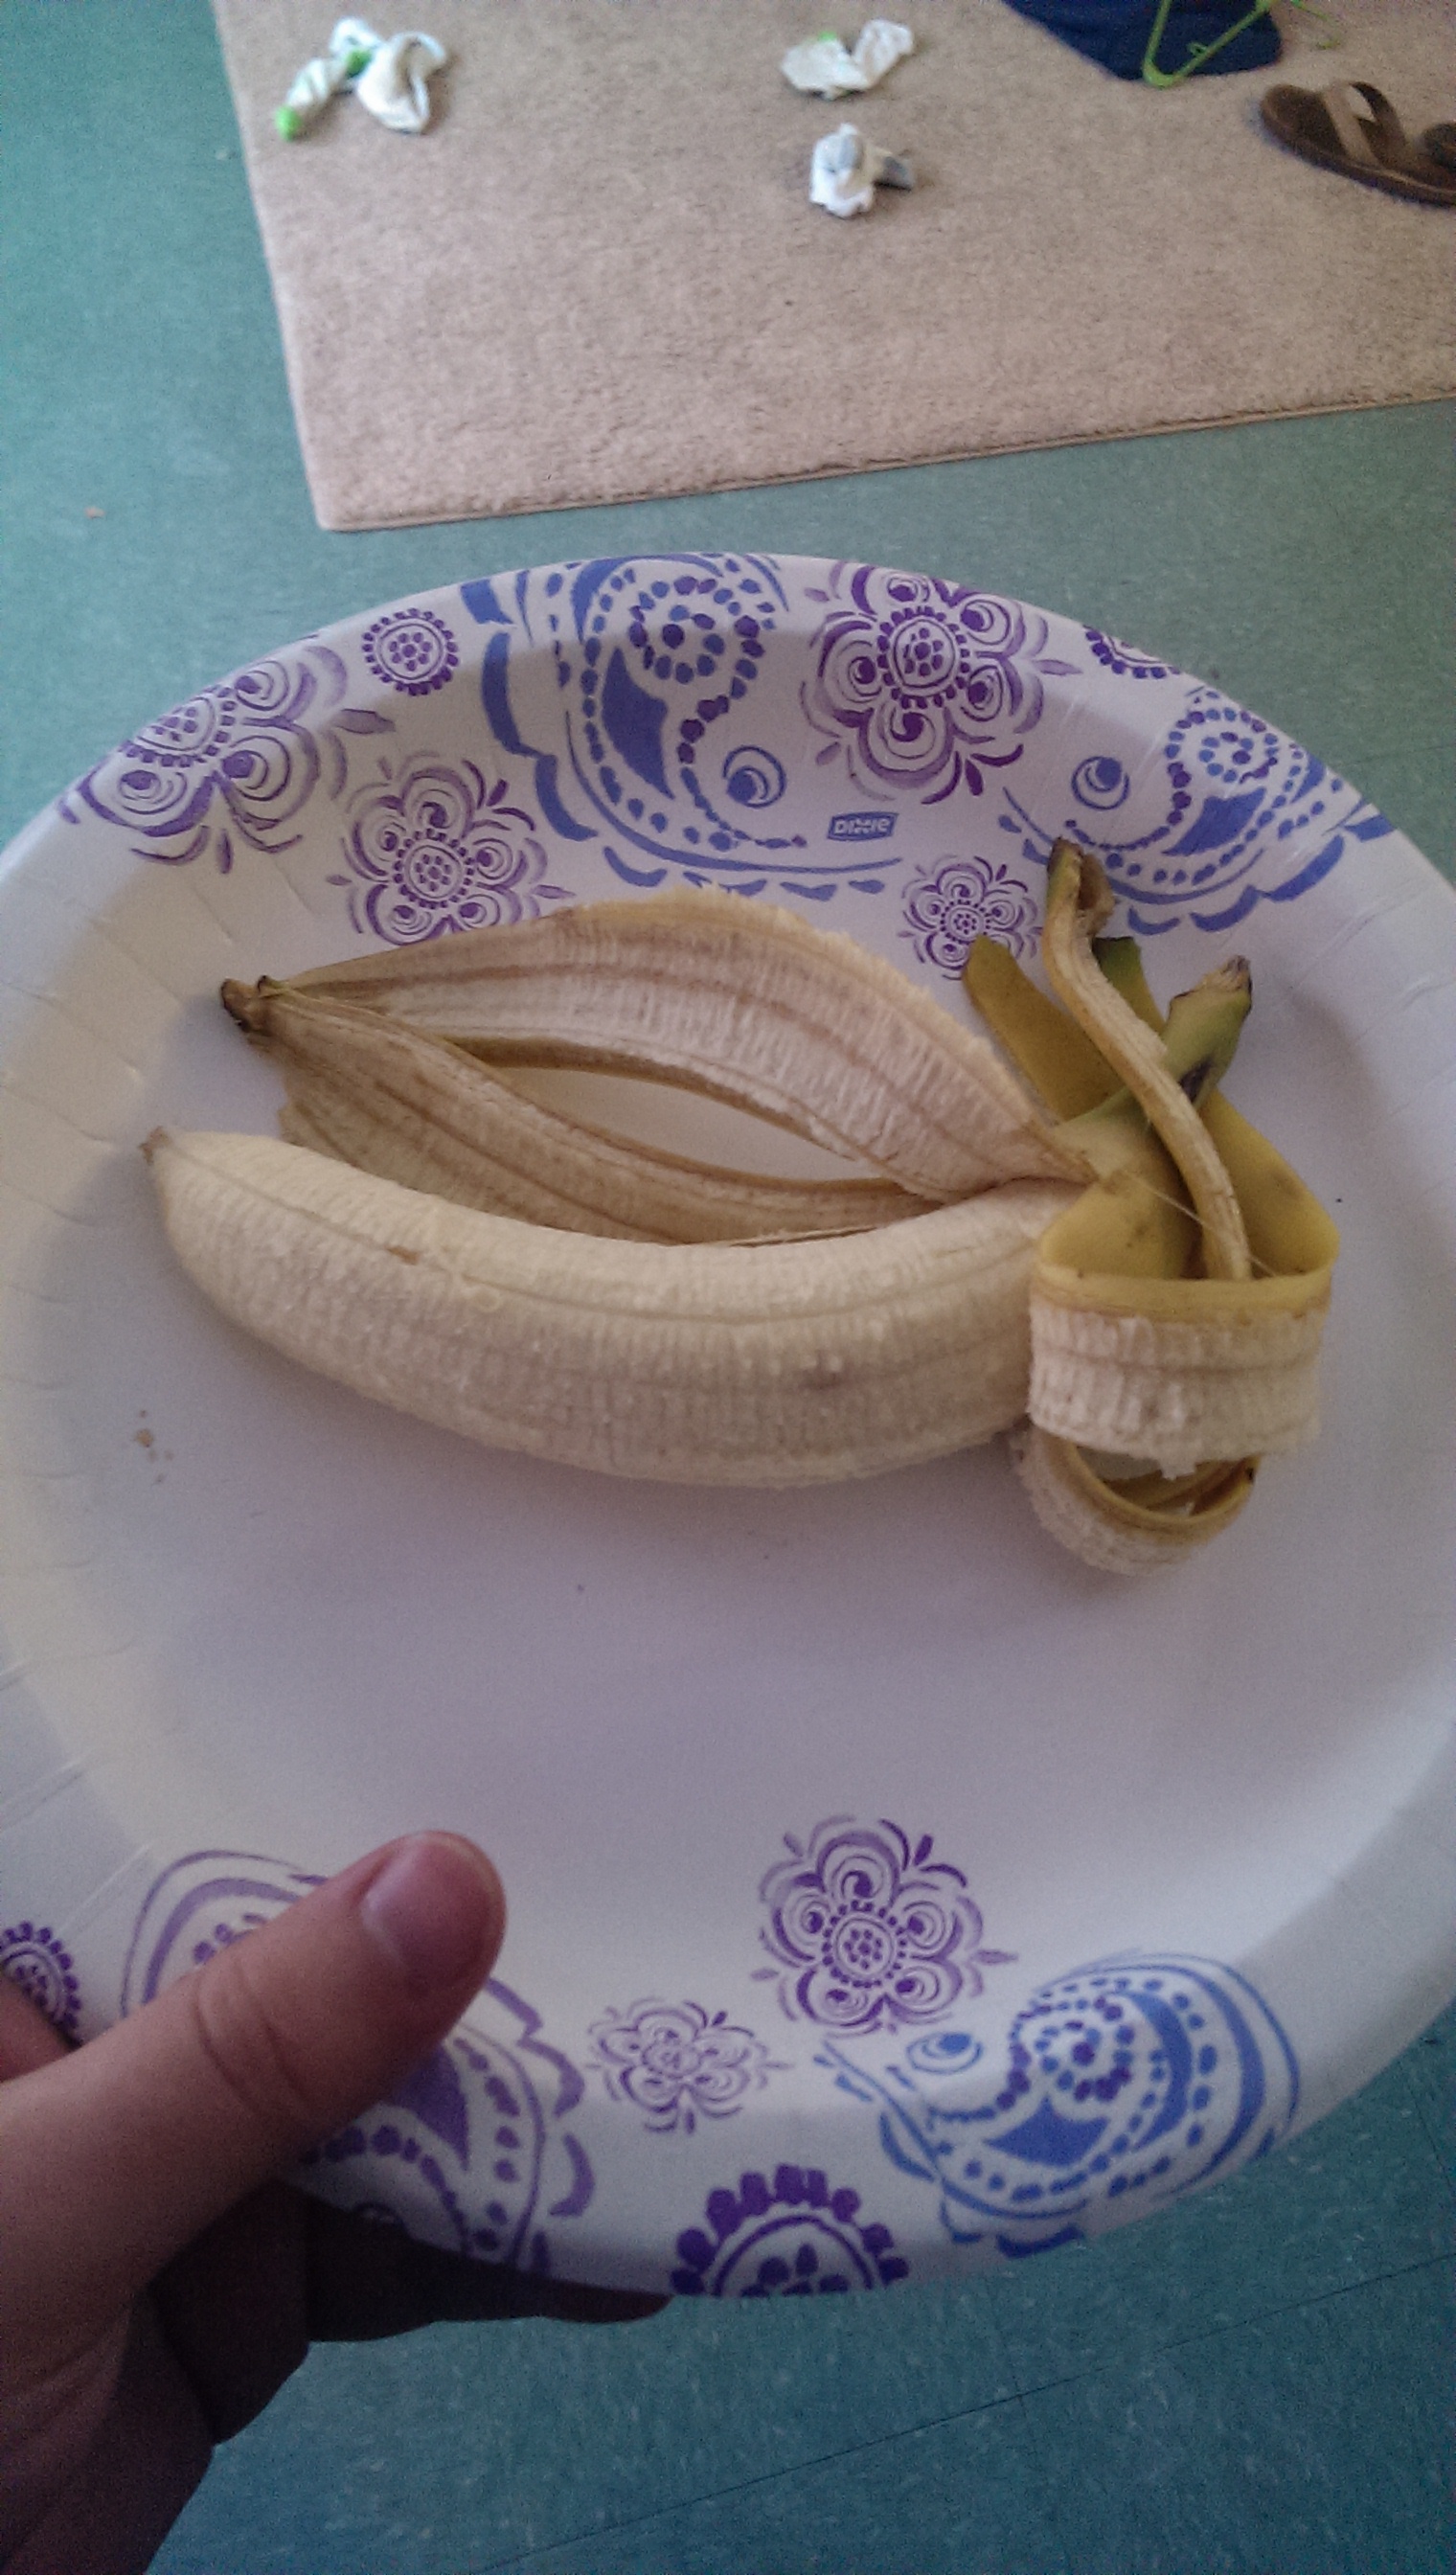
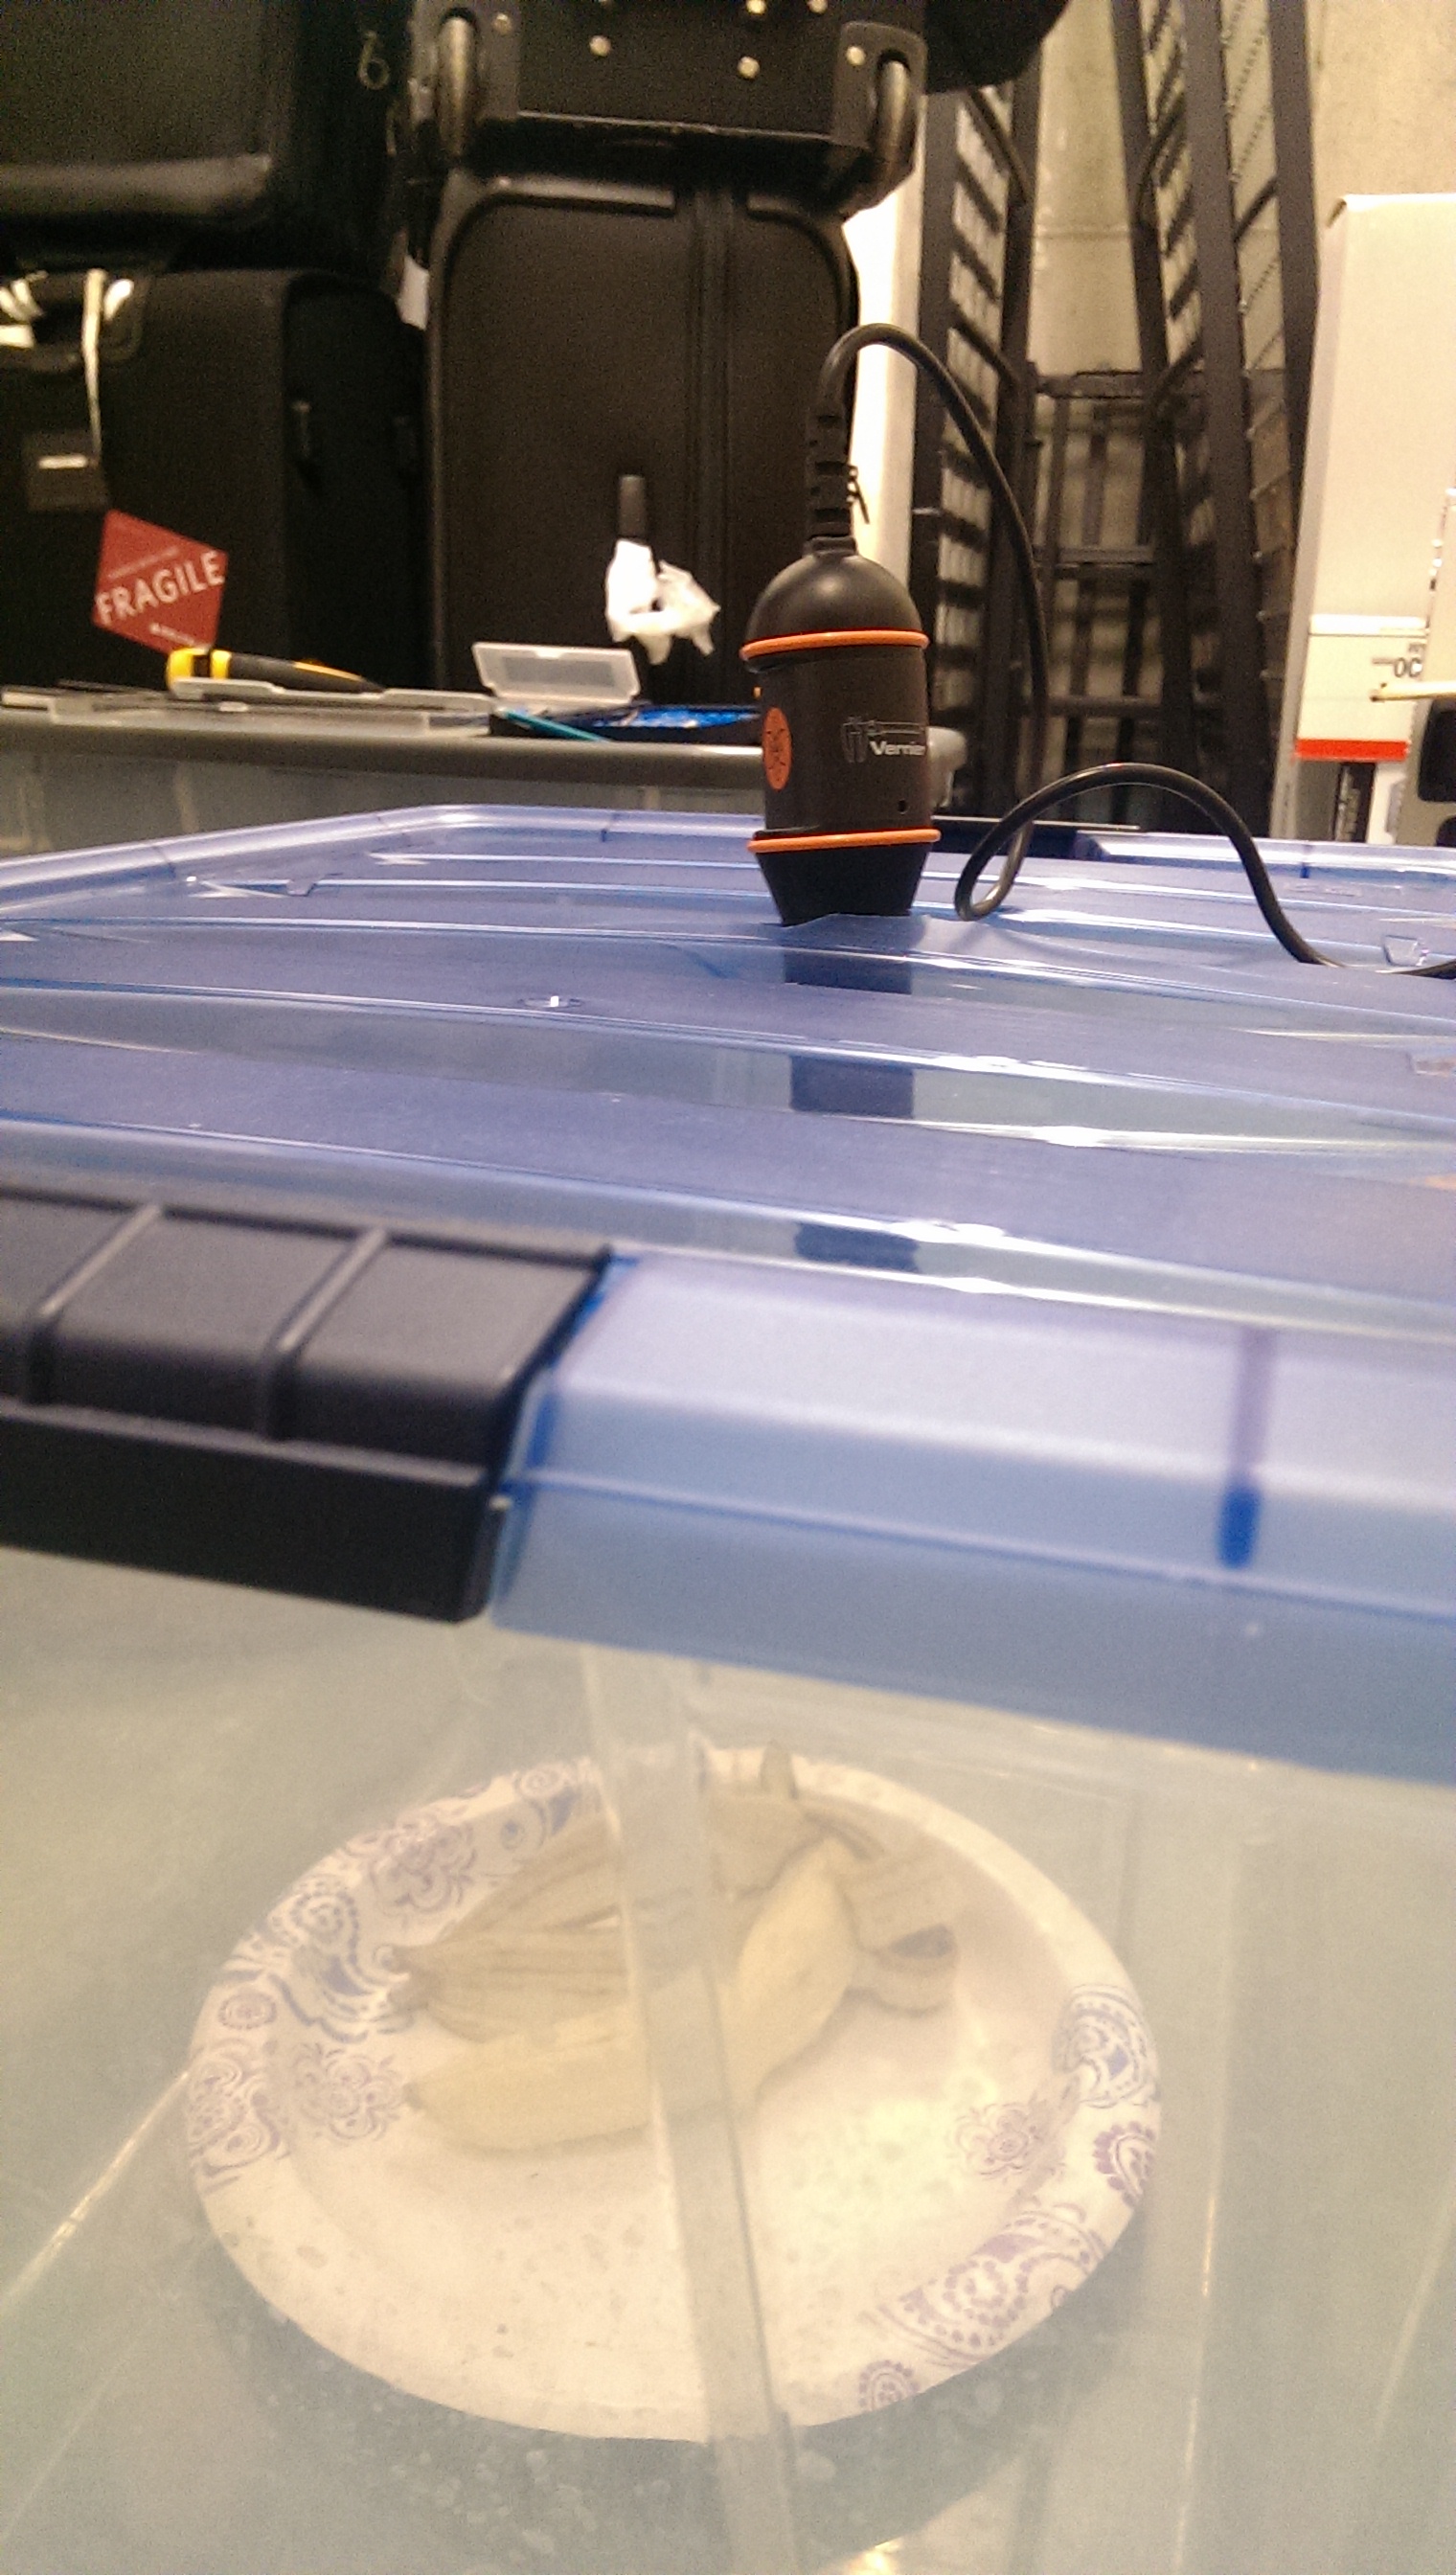
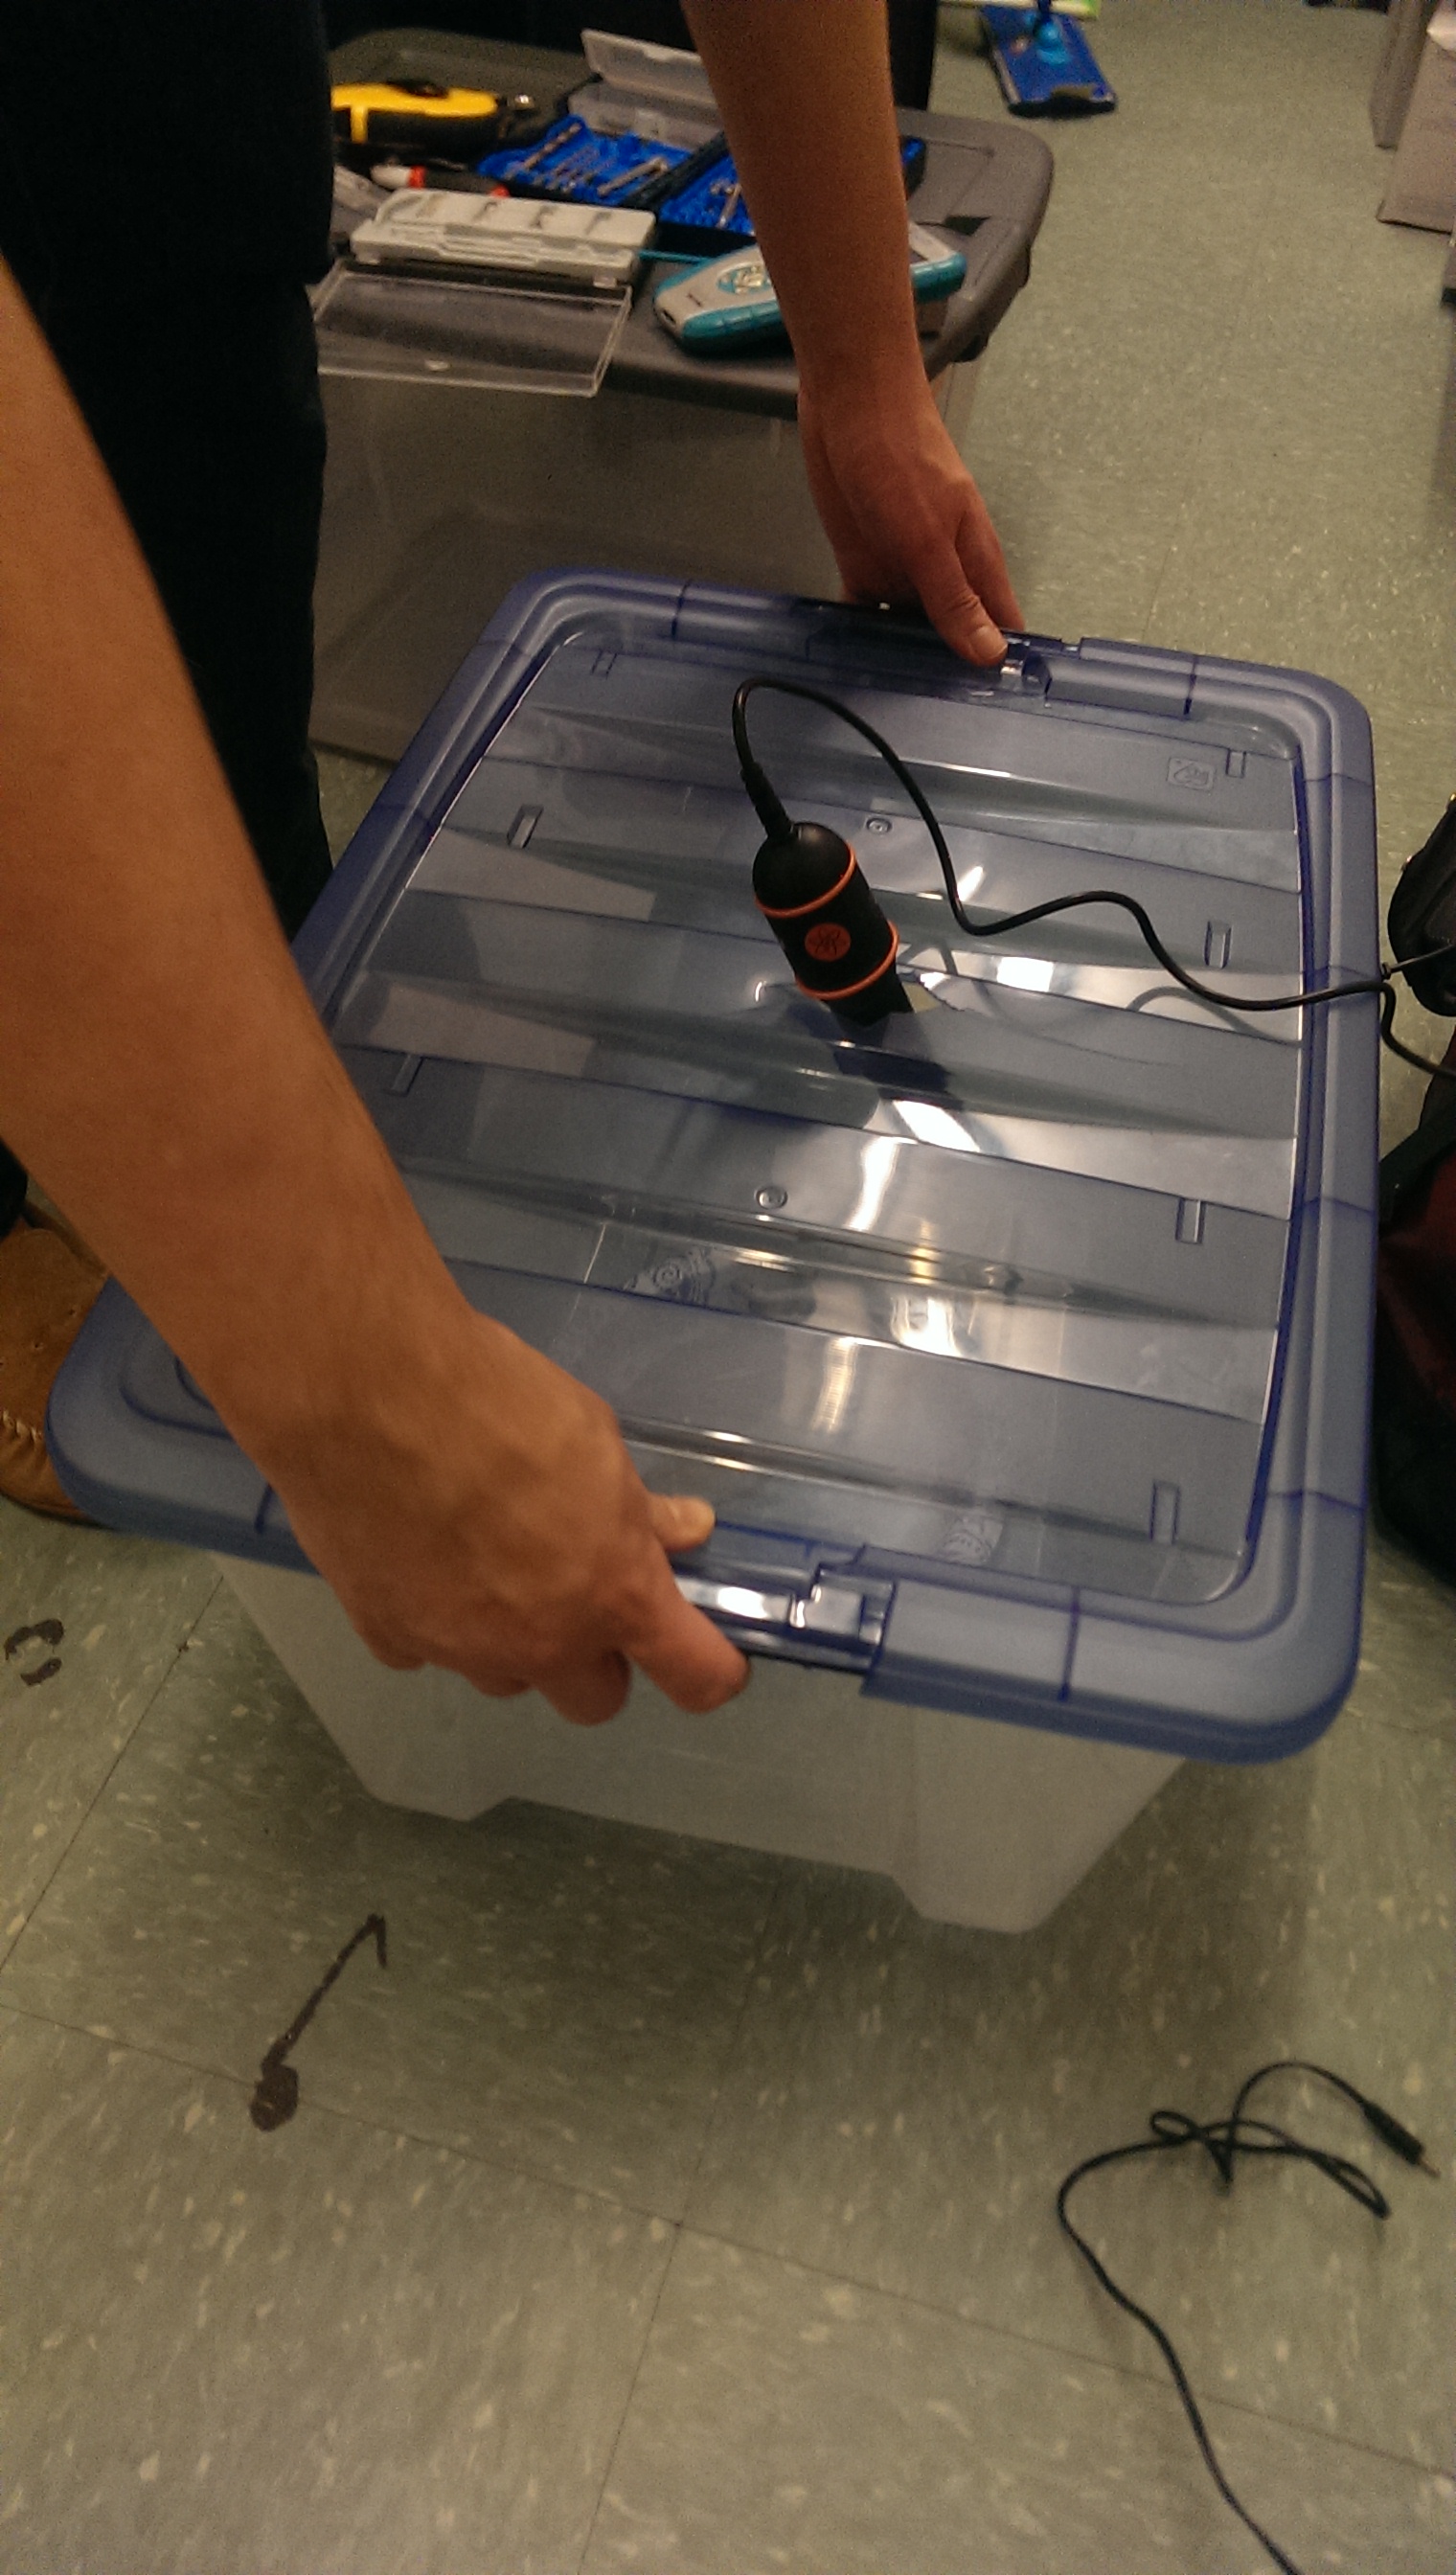
For collecting our data, the sample was placed into a 20 gallon plastic container with the Geiger counter pointing downwards at the sample, and the Vernier LabQuest was placed away from the container to minimize any additional environmental variables. The samples were placed 6 inches away from each sample. The container was covered before testing began, and all testing was conducted in a dry room at 75°F. The following samples were taken: a blank, a banana, a tablespoon of peanut butter, and (1) cup of beer. Each sample was obtained from the same grocery store, and a single serving size (the entire sample) was taken from each of the sources. Below in Figure 1 is the data that was collected. The ellipses abbreviate the data that was collected for the sake of brevity.
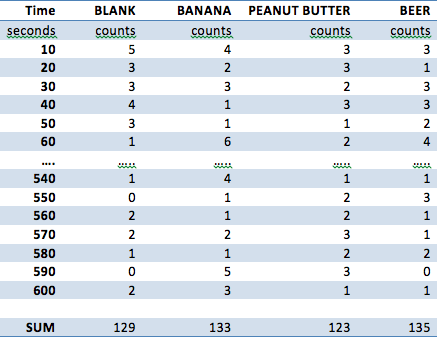
Figure 1 – Raw Data Collection for Blank, Banana, Peanut Butter, and Beer
3. Results
The data was collected for a period of 10 minutes at intervals of 10 seconds through the Vernier LabQuest and was compiled into a data chart on the devices. The samples that were tested, as mentioned above, were as follows: a blank, a banana, peanut butter, Beck’s beer. The data was then transferred to Microsoft Excel where calculations as shown in two sections above were conducted. A total summation of all the radioactive counts are shown in Figure 1, and a line graph of the variation of counts per 10 second interval are shown in Figure 2.
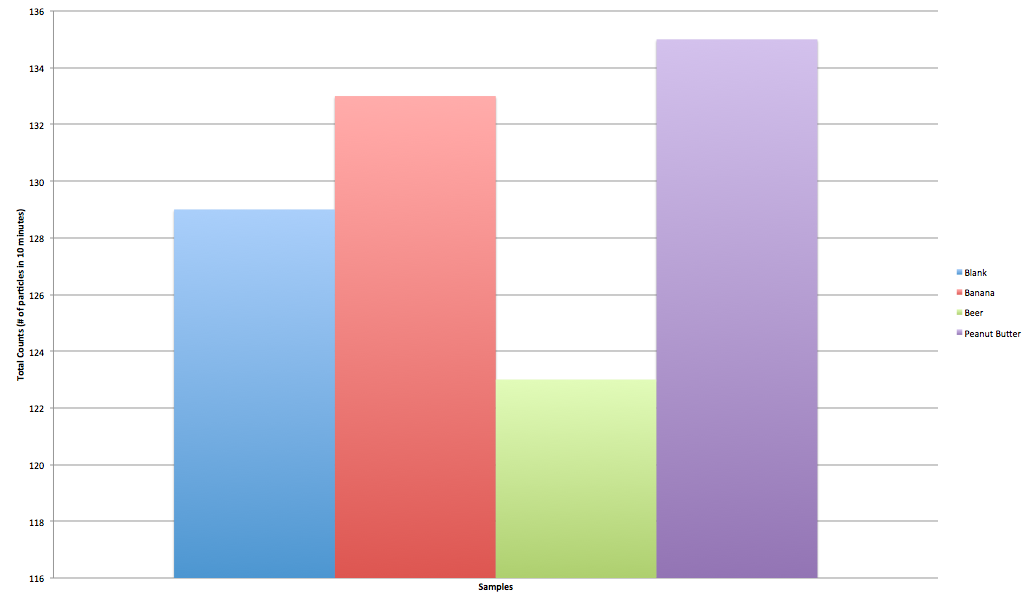
Figure 2 – Summation of Counts for Blank, Banana, Peanut Butter, and Beer
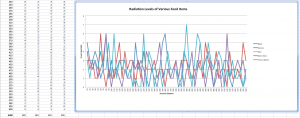
Figure 3 – Counts vs Time for Blank, Banana, Peanut Butter, and Beer
For each of the samples, the standard deviation for the blank, banana, peanut butter, and beer are as follows, respectively: 1.46, 1.33, 1.42, 1.72. These standard deviations indicate a fair spread given the maximum and minimum values that were recorded for each sample. Beer was found to have the most radiation whereas peanut butter did not emit any; the banana was found to emit radiation but less than that of beer.
When calculating how much one must consume to induce death, it was found that it takes on average about four hours to digest the radioactive isotopes. The four hours was converted to minutes to keep units consistent in calculations. In addition, the units for counts per minutes were accounted for by dividing by ten in the calculation. Figure 4 below shows how much of one of the samples you would have to consume to to induce radiation poisoning to the point of death. The Merck Manual of Radiation Exposure and Contamination was used to data in regards to how many Gy’s it would take to kill a person in a matter of 6-8 weeks.
![]()
Figure 4 – Amount of a Serving Size of a Banana, Peanut Butter, or Beer to consume to Induce Death at 2 Gy
4. Conclusion
It was found that you would have to consume more beer than bananas to induce radiation poisoning to the point of death over a period of 6-8 weeks. In short, it is practically improbable for one to die from consuming these objects in excess because of the little radiation that is emitted from these sources. This makes sense because the FDA (an in other countries) would not allow for these products to be sold if they posed a radiation risk to consumers. In the data that was collected, it was shown that the peanut butter emitted less radiation than the blank itself. This can be explained by the setup of the experiment. Because we are only using one Geiger counter, we are only able to approximate the radiation emitted in all directions and in the different amounts. Thus, it was possible for some samples to have higher or lower readings than others.
Through the course of this experiment, a better understanding of constructing controlled experiments, use of a Geiger-Müller tube, and energy calculations/conversions amongst units was obtained. In addition, learning more about the methods of collections through different units such as Sieverts or Greys and Counts vs Dosage were better understood through research and trials within this experiment.
If this experiment could have been setup differently, the first change that would have been implemented would have been the use of multiple Geiger-Müller tubes. If more tubes were used, more accurate data could have been collected and our theoretical approximations of sample emittance could have been more accurate. In addition, a simulation of digestion using HCl at a pH similar to that of stomach acid would have been conducted to see what happens to the radioactive isotope once consumed as the assumption in this project was that radiation ceased upon digestion. If the experiment were conducted for a longer period of time, more samples would have been taken over a longer period of time to look for patterns or see if the rate of emittance follows the approximate rate of decay for the radioactive isotopes in each sample. In addition, the use of highly radioactive samples would have been used to add variance to the control group versus a blank. This experiment can be repeated using one Geiger-Müller tube, a Vernier LabQuest machine, a plastic container, and the samples used in this experiment.