The bar chart below displays the adjusted opacity values of our samples. The longer the bar, the more transparent the liquid, and hence, the lower the opacity.
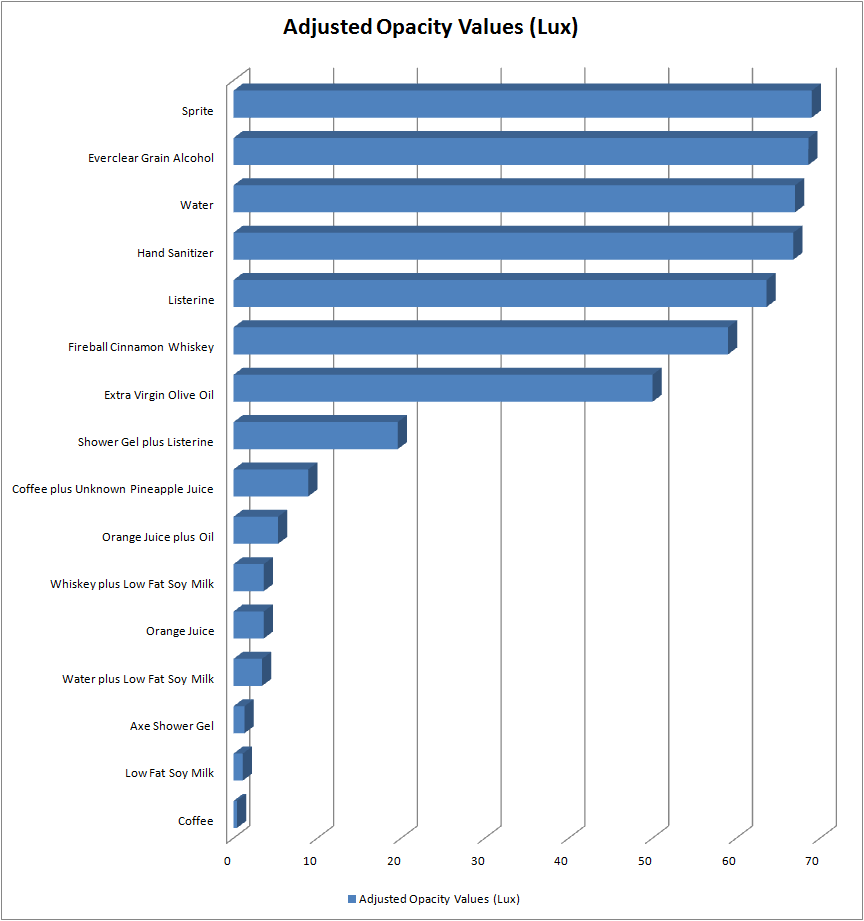
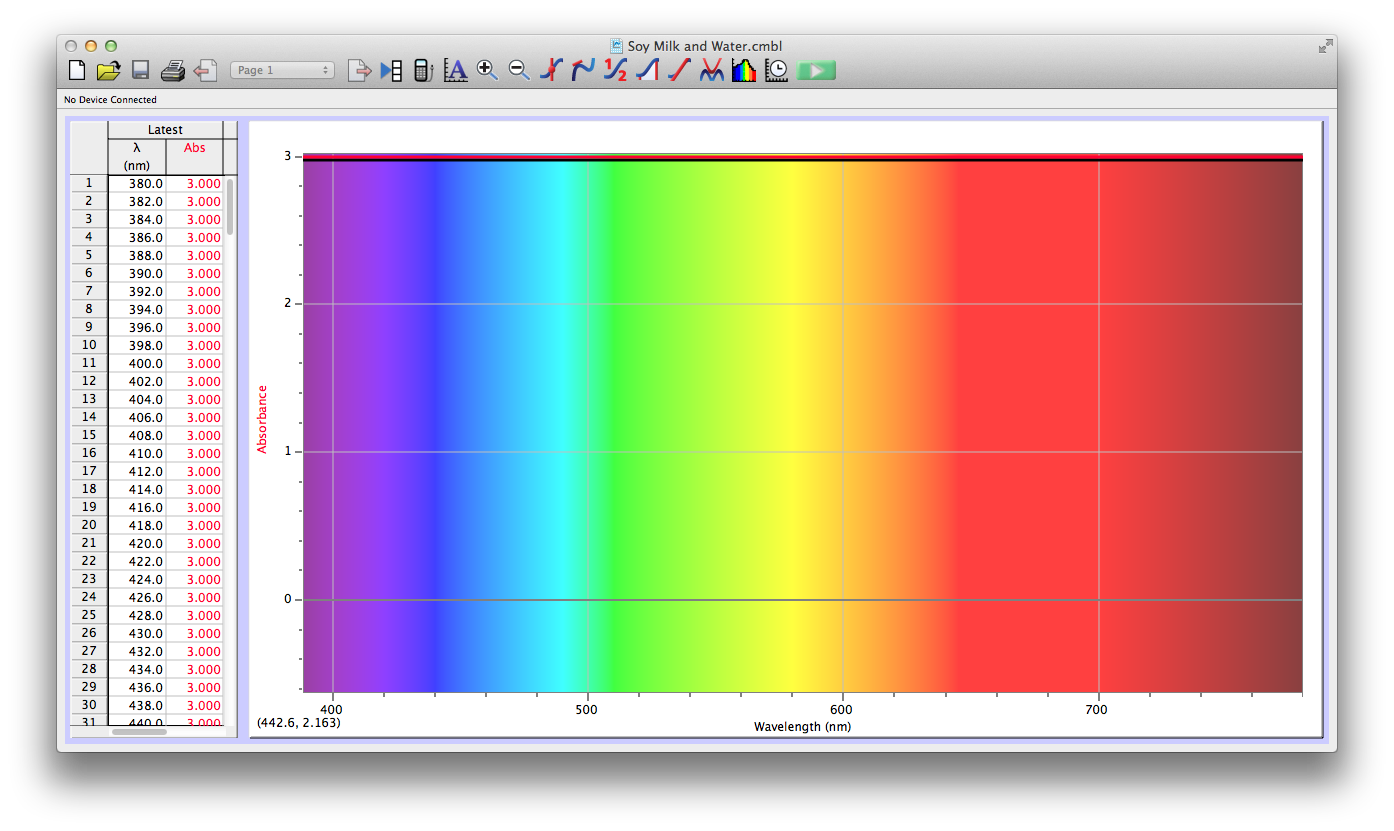
We expected our opacity readings to be strongly correlated with our spectroscopic data, but this was not always the case. For example, Axe Shower Gel had a high opacity (low lux reading) and had full absorbance (to the limit of the spectrometer) across the visible spectrum.

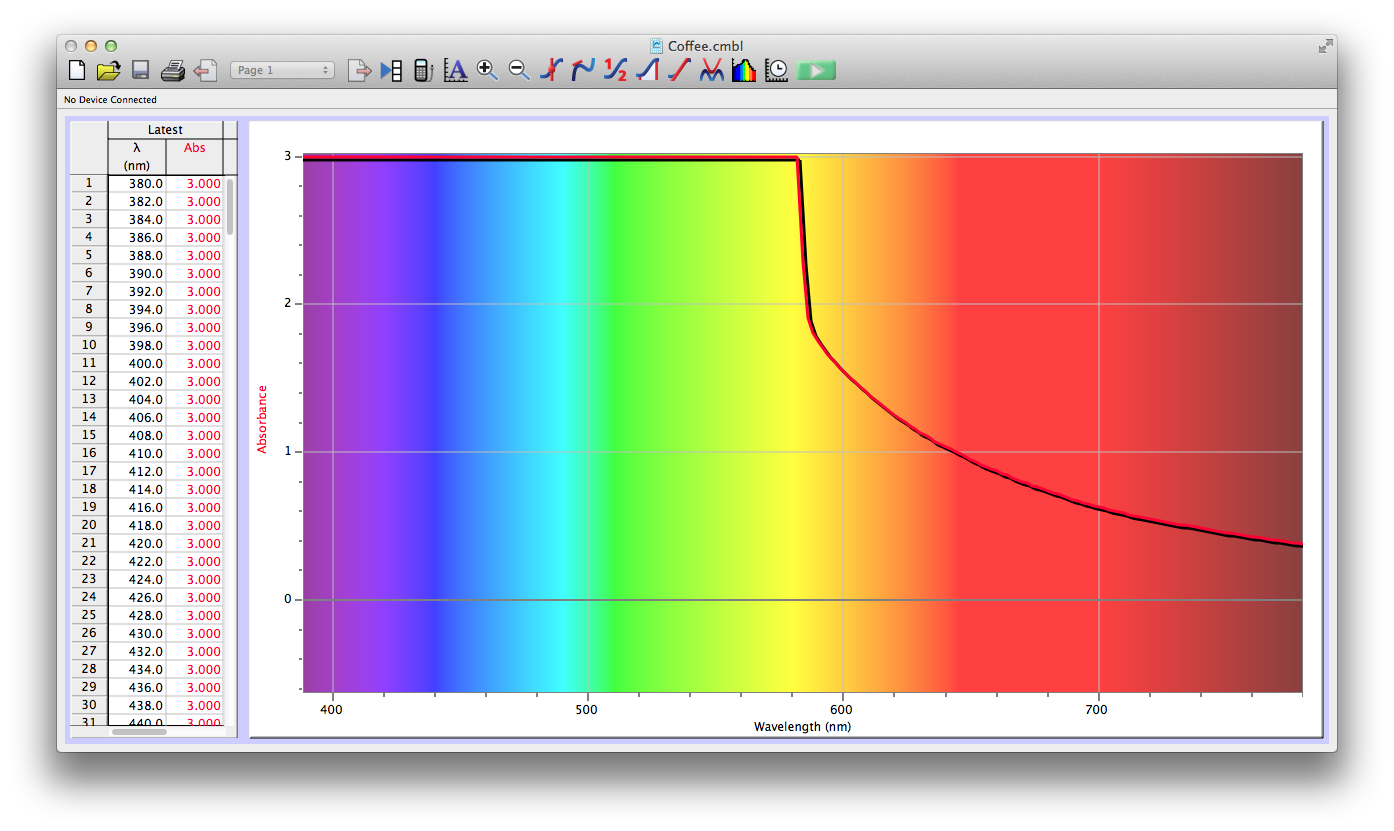
Coffee, on the other hand, was the most opaque sample we measured, but only displayed full absorbance from 400-580 nm. We did not expect this result, and are not sure why this is the case. Maybe because the light which is absorbed is all higher energy wavelengths?
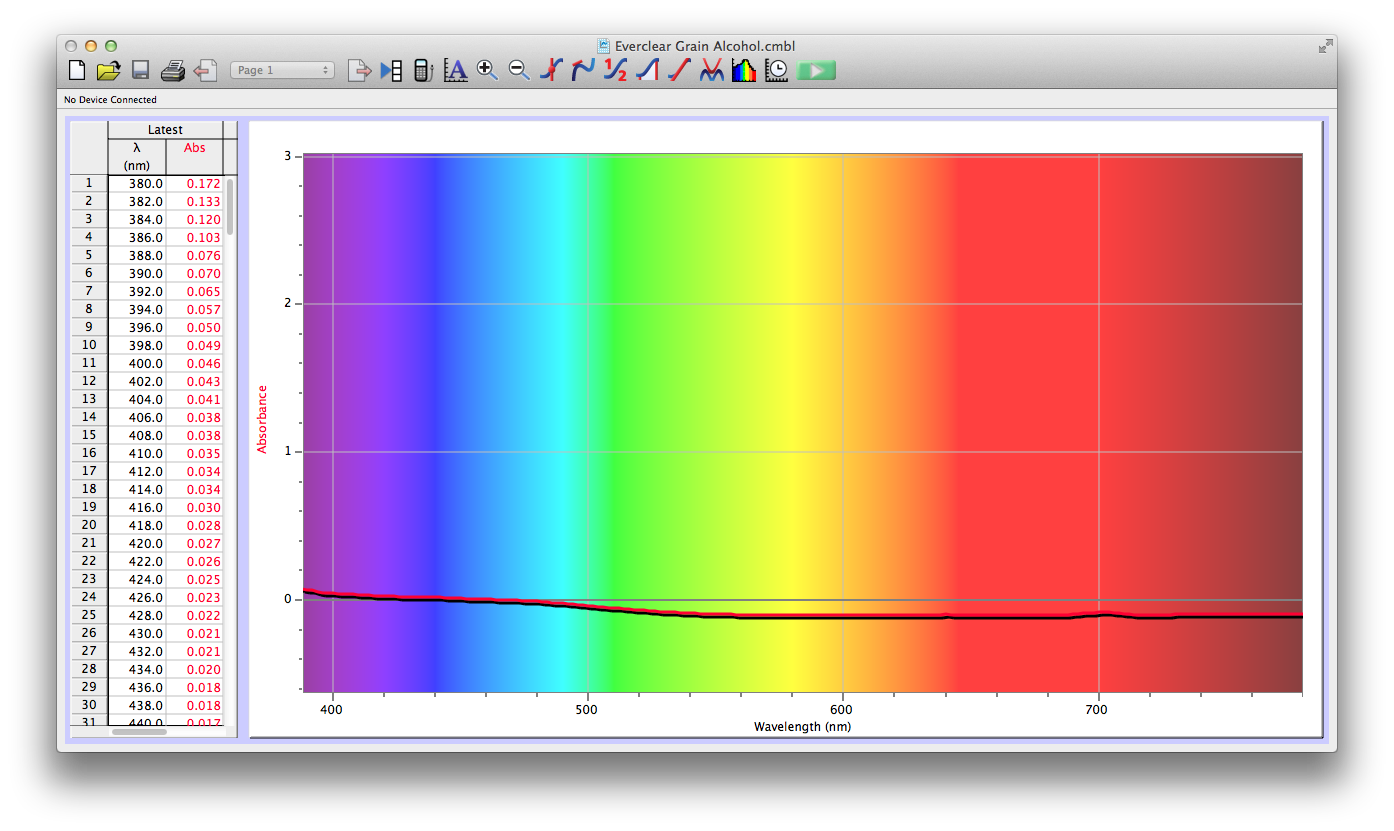
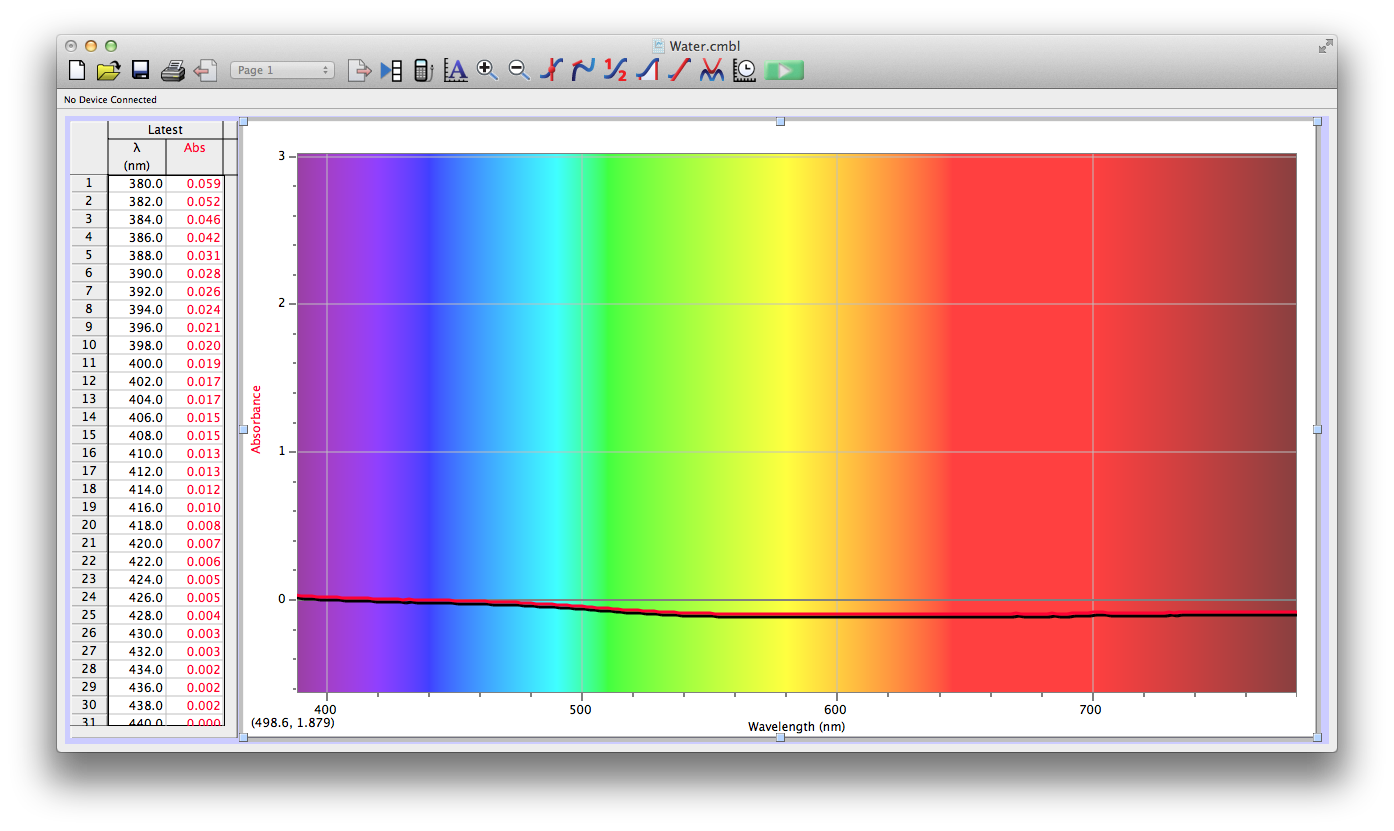
The most transparent liquids all had very low absorbances across the spectrum, which is what we expected. Locations of minor spikes in absorbance varied, but this did not affect opacity because the lux readings covered the entire visible spectrum.
Many of the liquids were colored, and these colors were based on their absorbance patterns. Coffee, for example, absorbs everything up to 580 nm, and then trails off, which means it reflects light in the red to orange area of the spectrum, giving it its brown color.
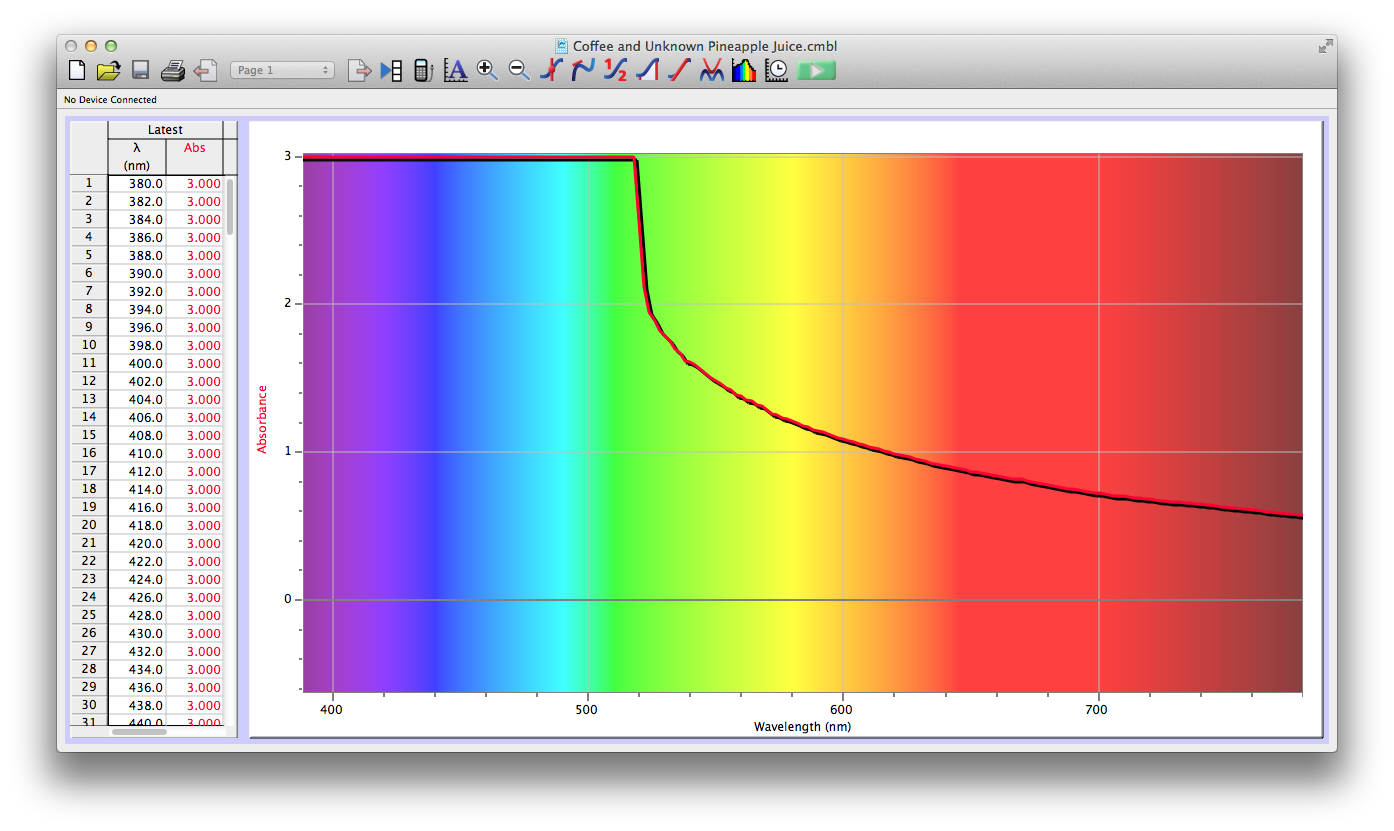
We also diluted coffee with unknown pineapple juice (what pineapple juice does the Deece use?) and found that the mixture had some yellow and green absorbance readings as well. The problem is that since we don’t have the spectrum of pineapple juice, we can’t determine whether the yellows and greens are due to the pineapple juice’s absorbance wavelengths, or simply through the dilution of coffee.
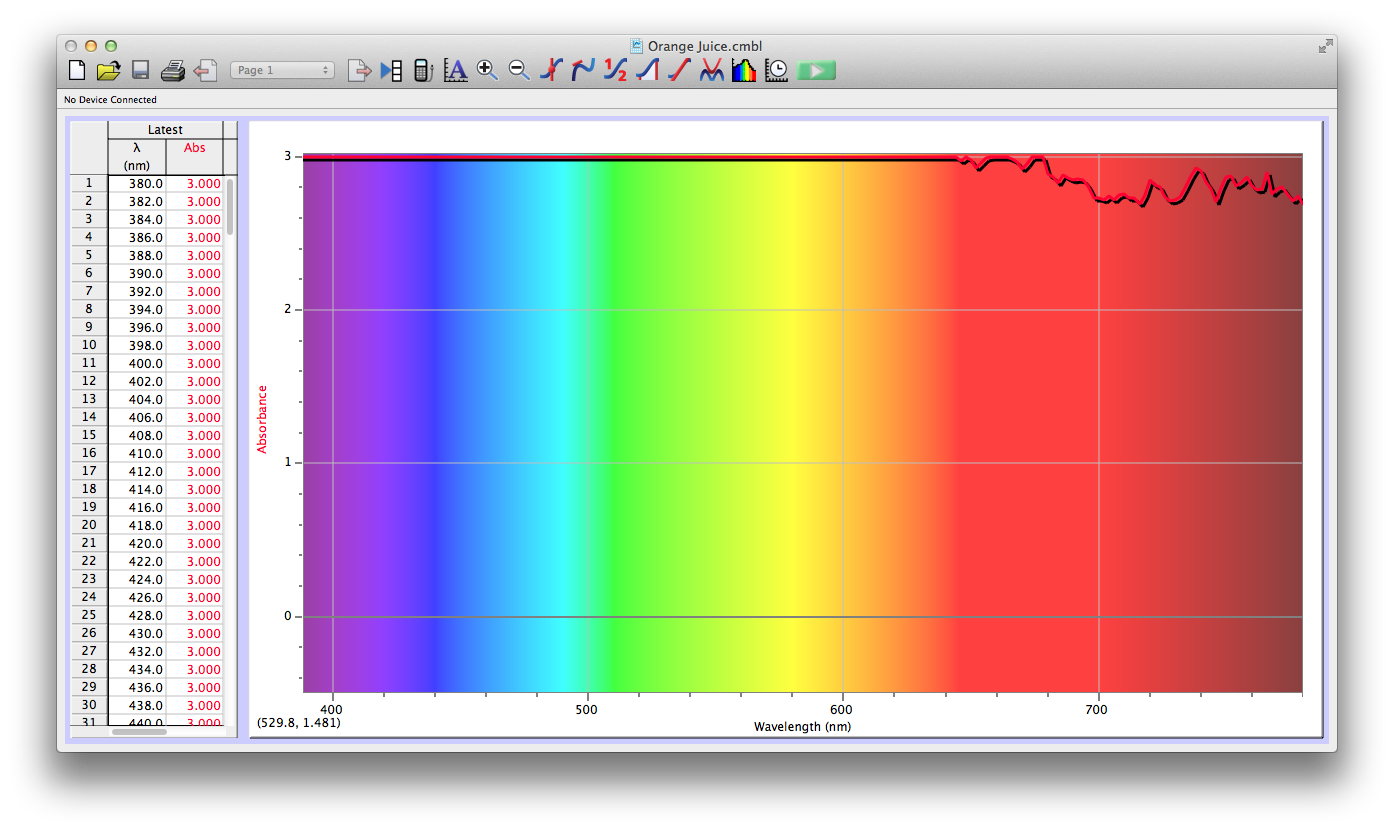
Orange juice absorbs everything in the visible spectrum except the wavelengths from 640 to 700 nm. From 640 to 700 nm the absorbance varies, but it is never completely saturated. Thus its orange color.
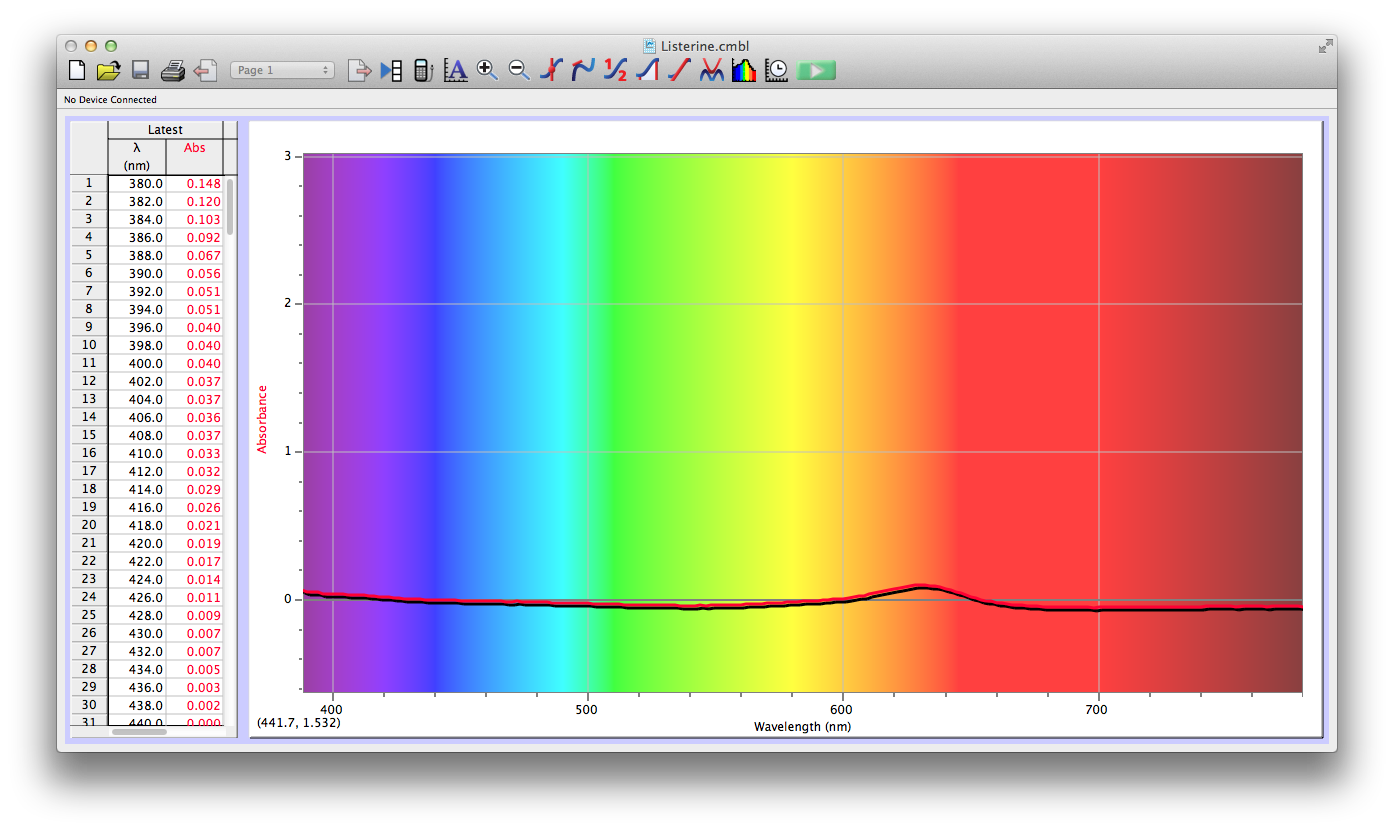
The spectroscopic readings for Axe Shower Gel were fully saturated, but when we mixed it with the almost completely transparent listerine, we wound up with an interesting spectrum. Since the two substances did not react chemically, the spectrum produced is most likely a reflection of the spectrum of Axe Shower Gel.

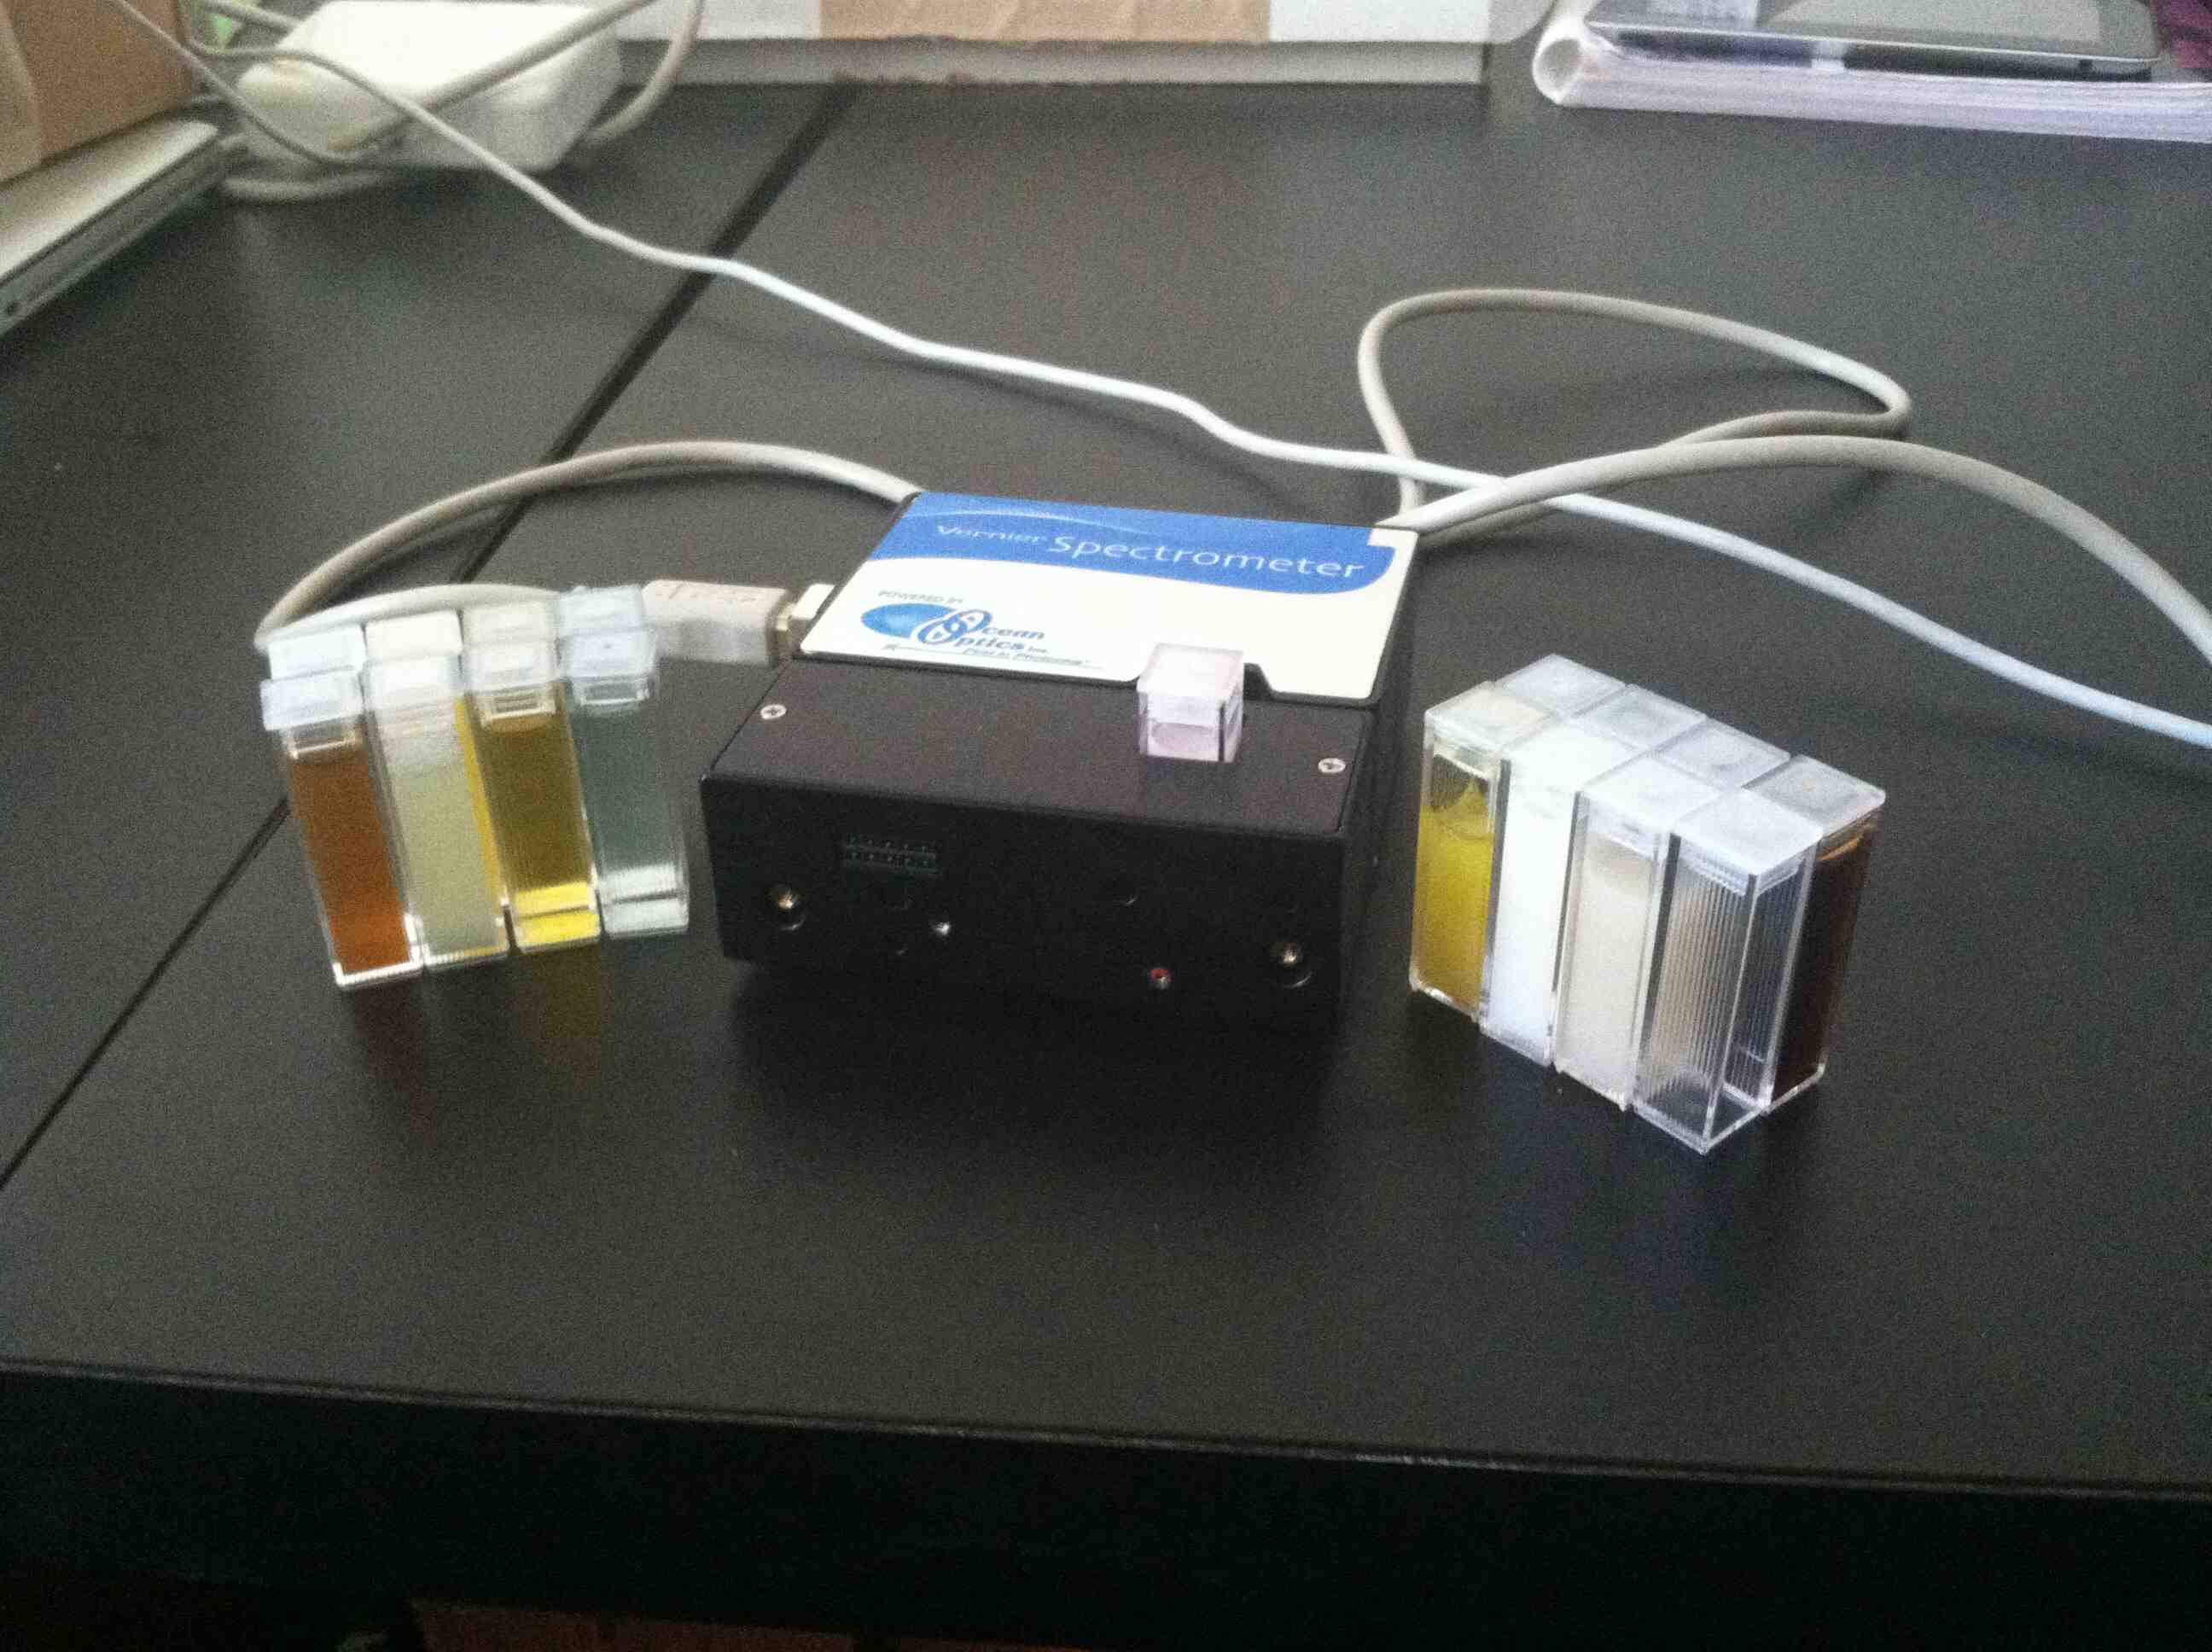
This project gave us a better grasp of the principles of atomic spectroscopy. At the risk of over-simplifying, a spectroscope shines light through the sample, and then measures how much is absorbed at each wavelength. Since each element only absorbs certain wavelengths, the spectrographic measurement of a substance is akin to a fingerprint, although it requires a trained spectroscopist to analyze it accurately. We utilized the spectroscope to examine the absorbance properties of our samples, and compared that to the overall opacity of the samples.
If we had this project to do over, we would make a few corrections to our approach. We would record the concentrations of each liquid in our mixtures, and vary the concentrations to examine the difference in absorbance. We would handle the cuvettes with more care, because fingerprints on the cuvettes could subtly alter the spectroscopic readings.
If we had another six weeks, we would dilute all of our fully absorbent liquids with water (since water would not cause much interference, as a relatively clear, non reactive, liquid) so we could measure their absorbances. We really liked the idea of analyzing the composition of sunset lake. We would like to suggest hiring a trained spectroscopist to work with us to help us interpret the spectroscopic readings. 😉