Introduction
Electromagnetic fields (EMFs) is a rather popular topic, especially in the current time period where technology plays huge roles in our everyday lives. Most of us are constantly surrounded by various electronic devices. Electric and magnetic fields are produced in our homes by the various appliances, electrical wiring, and the power lines and substations outside the home. When electricity flows through a wire as an electric current, magnetic fields are produced. It is obvious to assume that the larger the current, the stronger the magnetic field. Magnetic fields are of interest because they can cause currents in the body. If exposed to high levels, magnetic fields can cause phosphenes, which are faint flickering visual sensations, or stimulate nerves and muscles. The typical exposure at home tend to be lower than the guidelines levels, providing some reassurance of safety for most people. Of course, electrical appliances produce higher levels when they are plugged in and in use, however moving further away from these appliances helps to reduce one’s exposure.
The kind of magnetic fields that tend to cause more damage are those that are alternating. Fortunately, magnetic fields from appliances are point sources, whose level of emission drops off dramatically with increasing distance from the source. Magnetic fields are categorized into two types: 1) non-ionizing are low-level radiation and hence harmless due to lack of potency, which includes microwave ovens, wireless networks, cell phones, Bluetooth devices, power lines, computers, MRIs, etc; 2) ionizing: are high-level radiation with the possibility of cellular and DNA damage with prolonged exposure, which includes UV light, some X-rays, and some gamma rays. Hence, television are considered non-ionizing and should not have a huge effect on our bodies.
Materials and Methods
In order to get access to a variety of television, I decided to conduct the experiment at Best Buy. I choose the most popular sizes [32″, 40″/42″, 55″] and even threw in an 80″ screen for fun. All of the television were LED, which is a more advanced and energy-efficient upgrade from LCD technology. Also, all of the television were on and playing some type of best buy commercials.
The vernier magnetic field sensor used had two settings to read magnetic fields, [see Figure 1]. There was a low setting, used for detection of weak fields, and a high setting, used for detection of strong fields. I took readings under both settings assuming I was not sure what type of field these televisions would most-likely emit. However, the most probable answer would be that manufacturers would invest a decent amount of money to ensure that the magnetic field emitted is at relatively low and “safe” levels. Hence, I decided to test the magnetic field on the front of the screen, which is what always faces the users. The sensor also has two positions: the tip of the probe bent perpendicular to the rest of the sensor, which I called parallel to the screen [see figure 2]; and both the probe and tip facing one direction, which I called perpendicular to the screen [see figure 3]. As I was taking readings, I decided to take a reading of the top of the frame of the TVs out of curiosity, (I also wanted to take the back of the television near the power cord but it was hard to reach in most units) and found that they tended to be much higher than the readings on the screen. I took the readings of the frames with the tip bent, since it was easier to reach, and called this parallel to the frame [see figure 4]. Note: I could not get the frame reading for the 55″+ televisions since the frames were unreachable.
Since the readings tended to fluctuate, I took a 10 second Magnetic Field vs time graph for each reading and took the average from the graph [see figure 5]. Readings were recorded in milli-Teslas (mT).
Results
I accumulated the data onto one excel sheet [see Figure 6]. I took the average of both tip positions in the low setting and the average at the high setting, not including the frame readings for either setting since I could not obtain the readings for the larger televisions.
I then created bar graphs for the average settings, (since for this data it’s easier to see the results as opposed to using scatter plots). For both the low setting [see Figure 7] and the high setting [see Figure 8] notice that most of the magnetic field readings of the televisions tended to be close to the recorded reading away from the television sets (labeled No TV). I also created graphs for the frame readings for both the low setting [see Figure 9] and the high setting [see Figure 10]. It is especially noticeable in the frame readings for the low settings that the magnetic fields are much higher coming from the frame of the television as opposed to the magnetic fields from the screen of the television.
Discussion:
Assuming that the low setting is the more probably reading for this particular electronic appliance, the magnetic fields being emitted do not seem to be too harmful. However, it was interesting that the Best Buy store brand Insignia, emitted a lower level of magnetic fields as opposed to popular name brands such as Samsung. It was also quite surprising how much higher the magnetic fields readings were emitting from the frame of the televisions. Pretty much all of the televisions, except for the 32″ Insignia, were above the magnetic field reading away from the televisions; and considerably higher under the low setting. Interestingly, there seemed not be much impact with increasing screen size; this was the opposite of what I predicted to happen. One would think that with an increased screen size there would be a higher magnetic field readings; however, it does make sense for there to me not much differences between screen sizes since manufacturers would want all of there units to be “safe.”
To date, there are no clear regulatory limits. I found a site that compiled the limits as stated by the American Conference Governmental Industrial Hygienists (ACGIH) Threshold Limit Values (TLV) data. The International Radiation Protection Association (IRPA).
As per these organizations:
- Routine occupational exposures should not exceed 60 milli-Teslas to the whole body on an 8 hour time weighted average.
- Routine occupational exposures should not exceed 600 milli-Teslas to the extremities on an 8 hour time weighted average.
- A maximum ceiling should be 2 Teslas for the whole body and 5 Teslas for the extremities.
- Pacemaker users or others with magnetic implants should not exceed 0.5 milli-Teslas at any time.
For most individuals, a couple of hours of television usage should not have a huge impact on our bodies. However, for those with pacemakers it is recommended that there exposure time should not exceed 0.5 milli-Teslas. Though the average low setting magnetic field readings for all of the televisions was at -0.0205 milli-Teslas, which is rather low, those with pacemakers should still take precautions with television usage.
Conclusion
It was rather interesting learning about the impact that EMFs have in our lives and the exposure that we should limit ourselves to. I definitely expected the magnetic fields of large screened television to be considerably high, however, as we can see from the data that was not the fact. Though the results were more reassuring about the exposure we submit ourselves too.
One thing I would change about the project is probably to change the type of electronic appliance. I would probably choose a cellphone or computer since I would be able to measure the magnetic field at various locations and would, thereby, not be limited by size.
If I had 6 more weeks to continue the project, I would consider taking the electric fields of the same televisions along with the microwave fields (via the usage of the RF meter). It would be interesting to see the impact of these additional fields and determine which is more harmful, (if any), and how they compare to “safe” values.
Figures

Figure 1: The two settings for the magnetic field sensor.

Figure 2: Tip is bent and perpendicular to the rest of the sensor; Parallel to the screen.
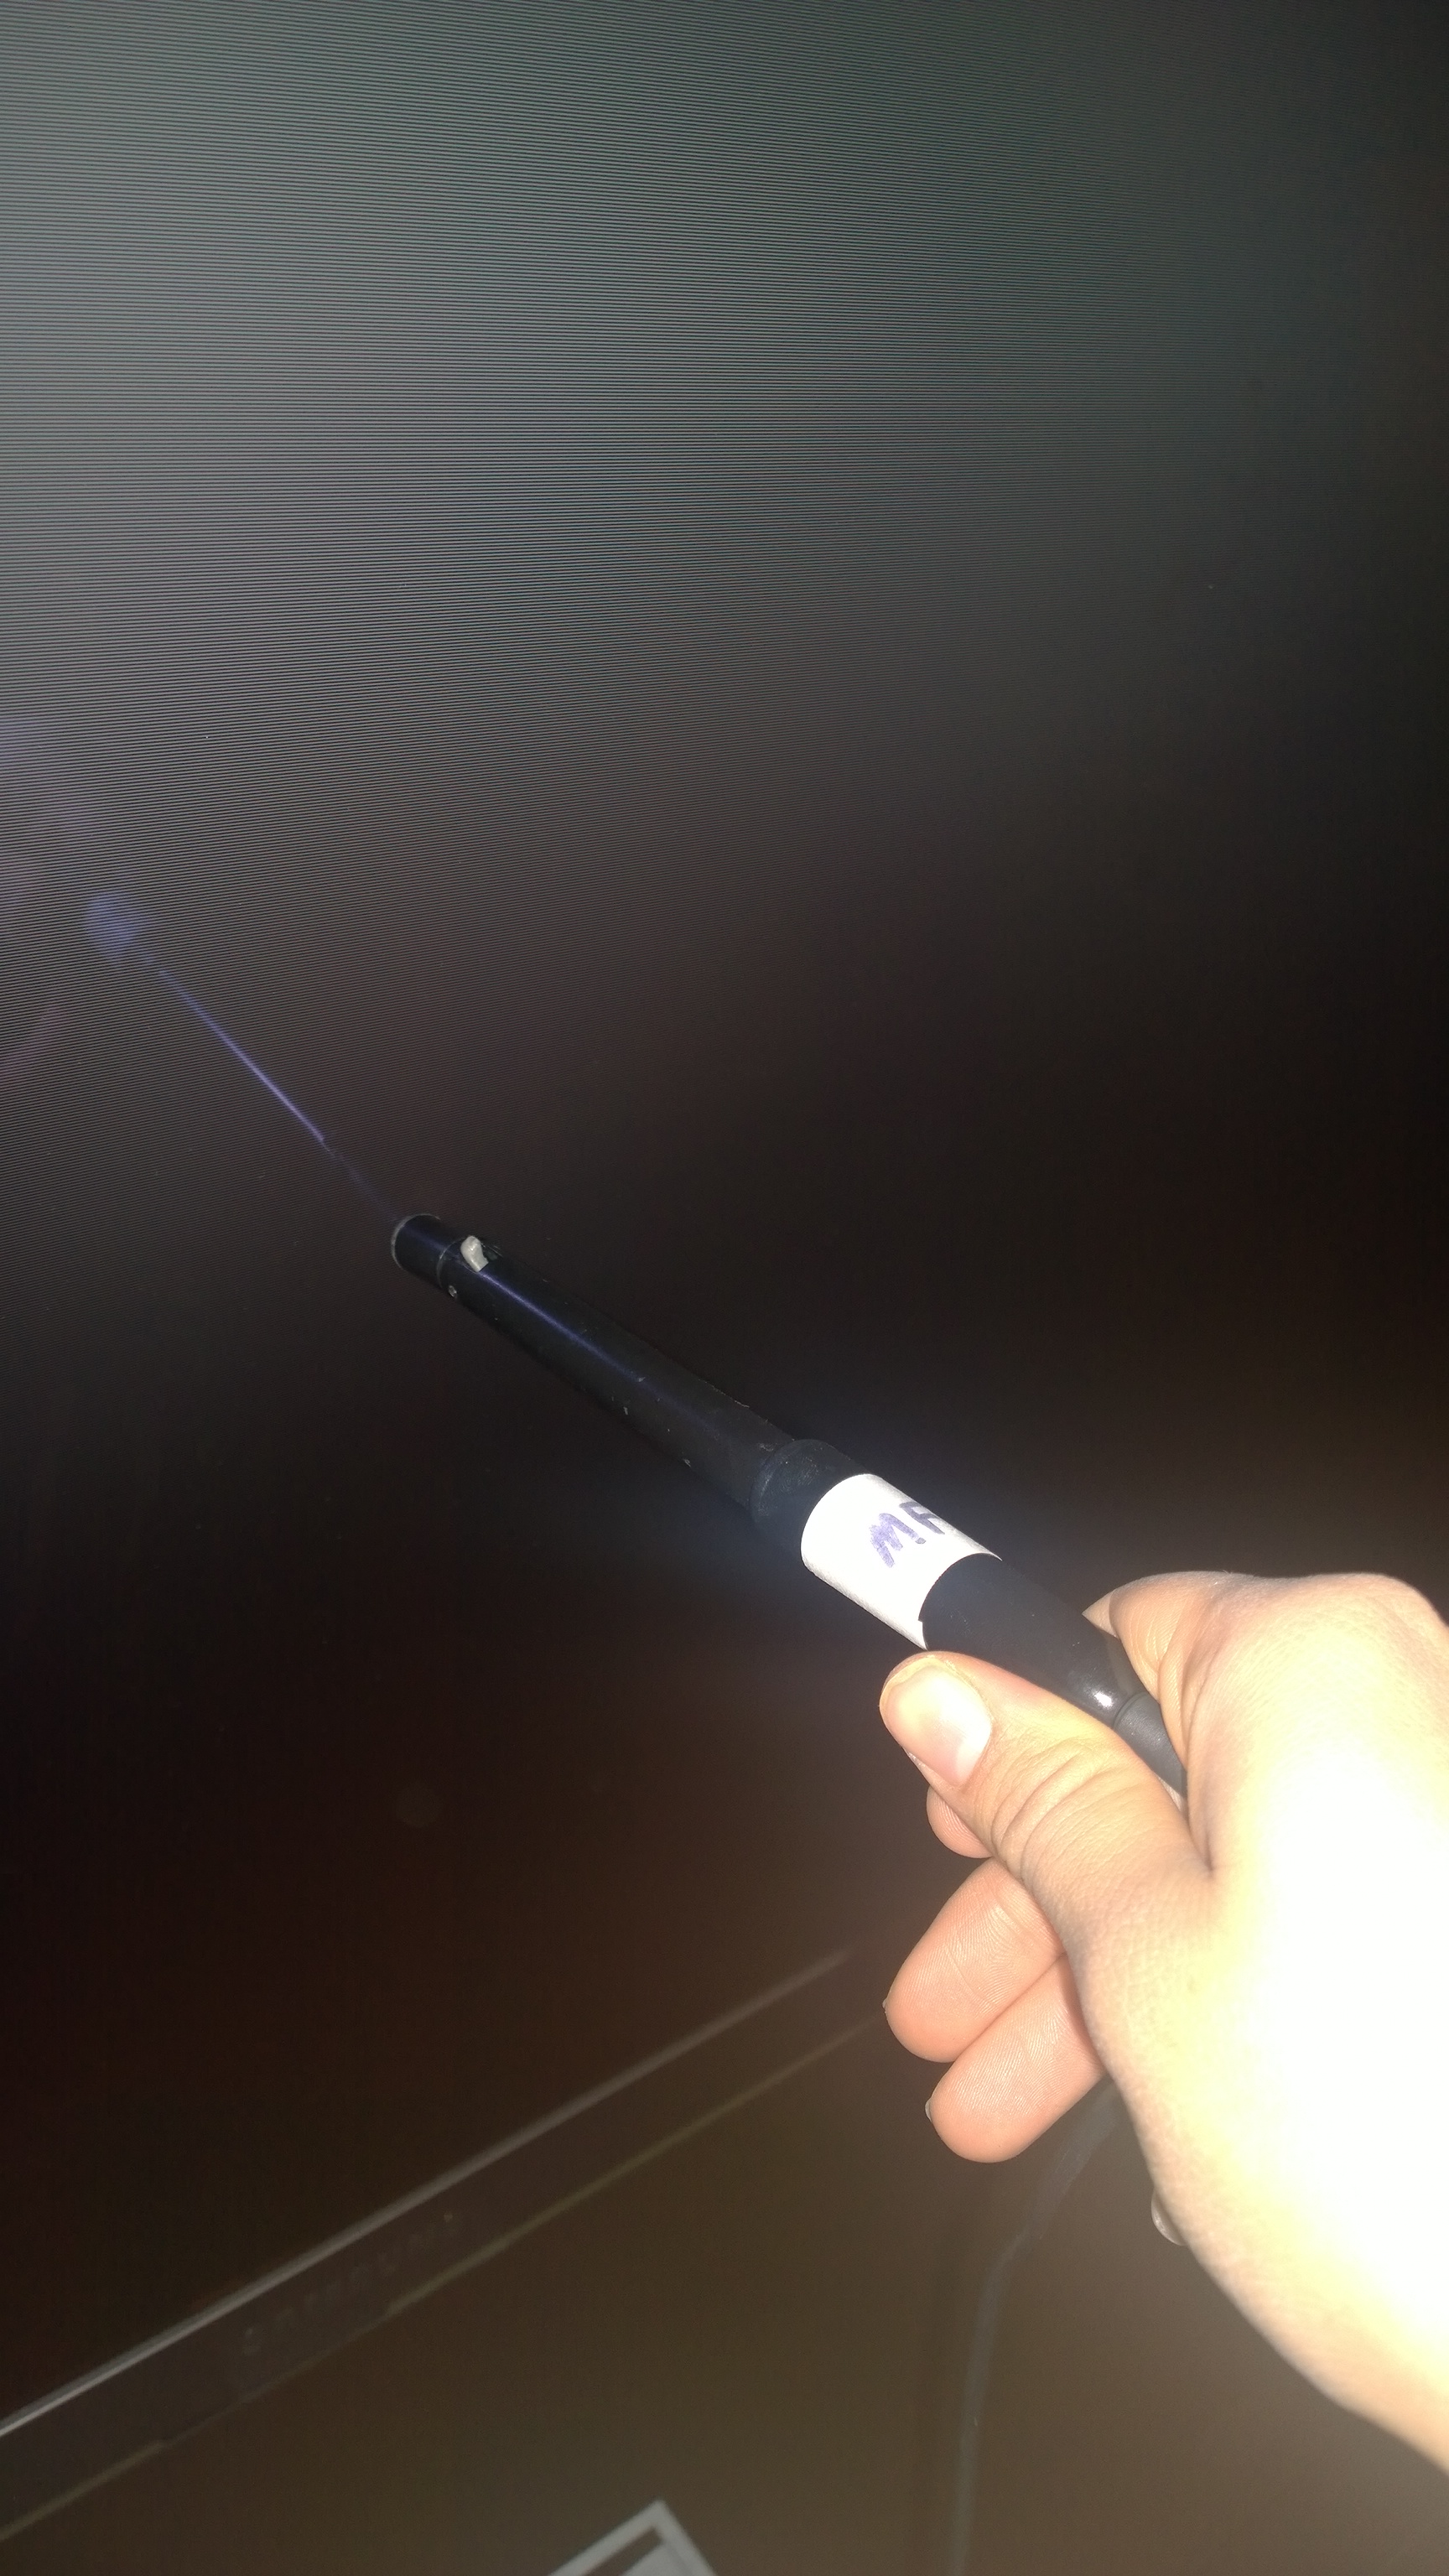
Figure 3: Tip and sensor aligned in same direction; Perpendicular to the screen.
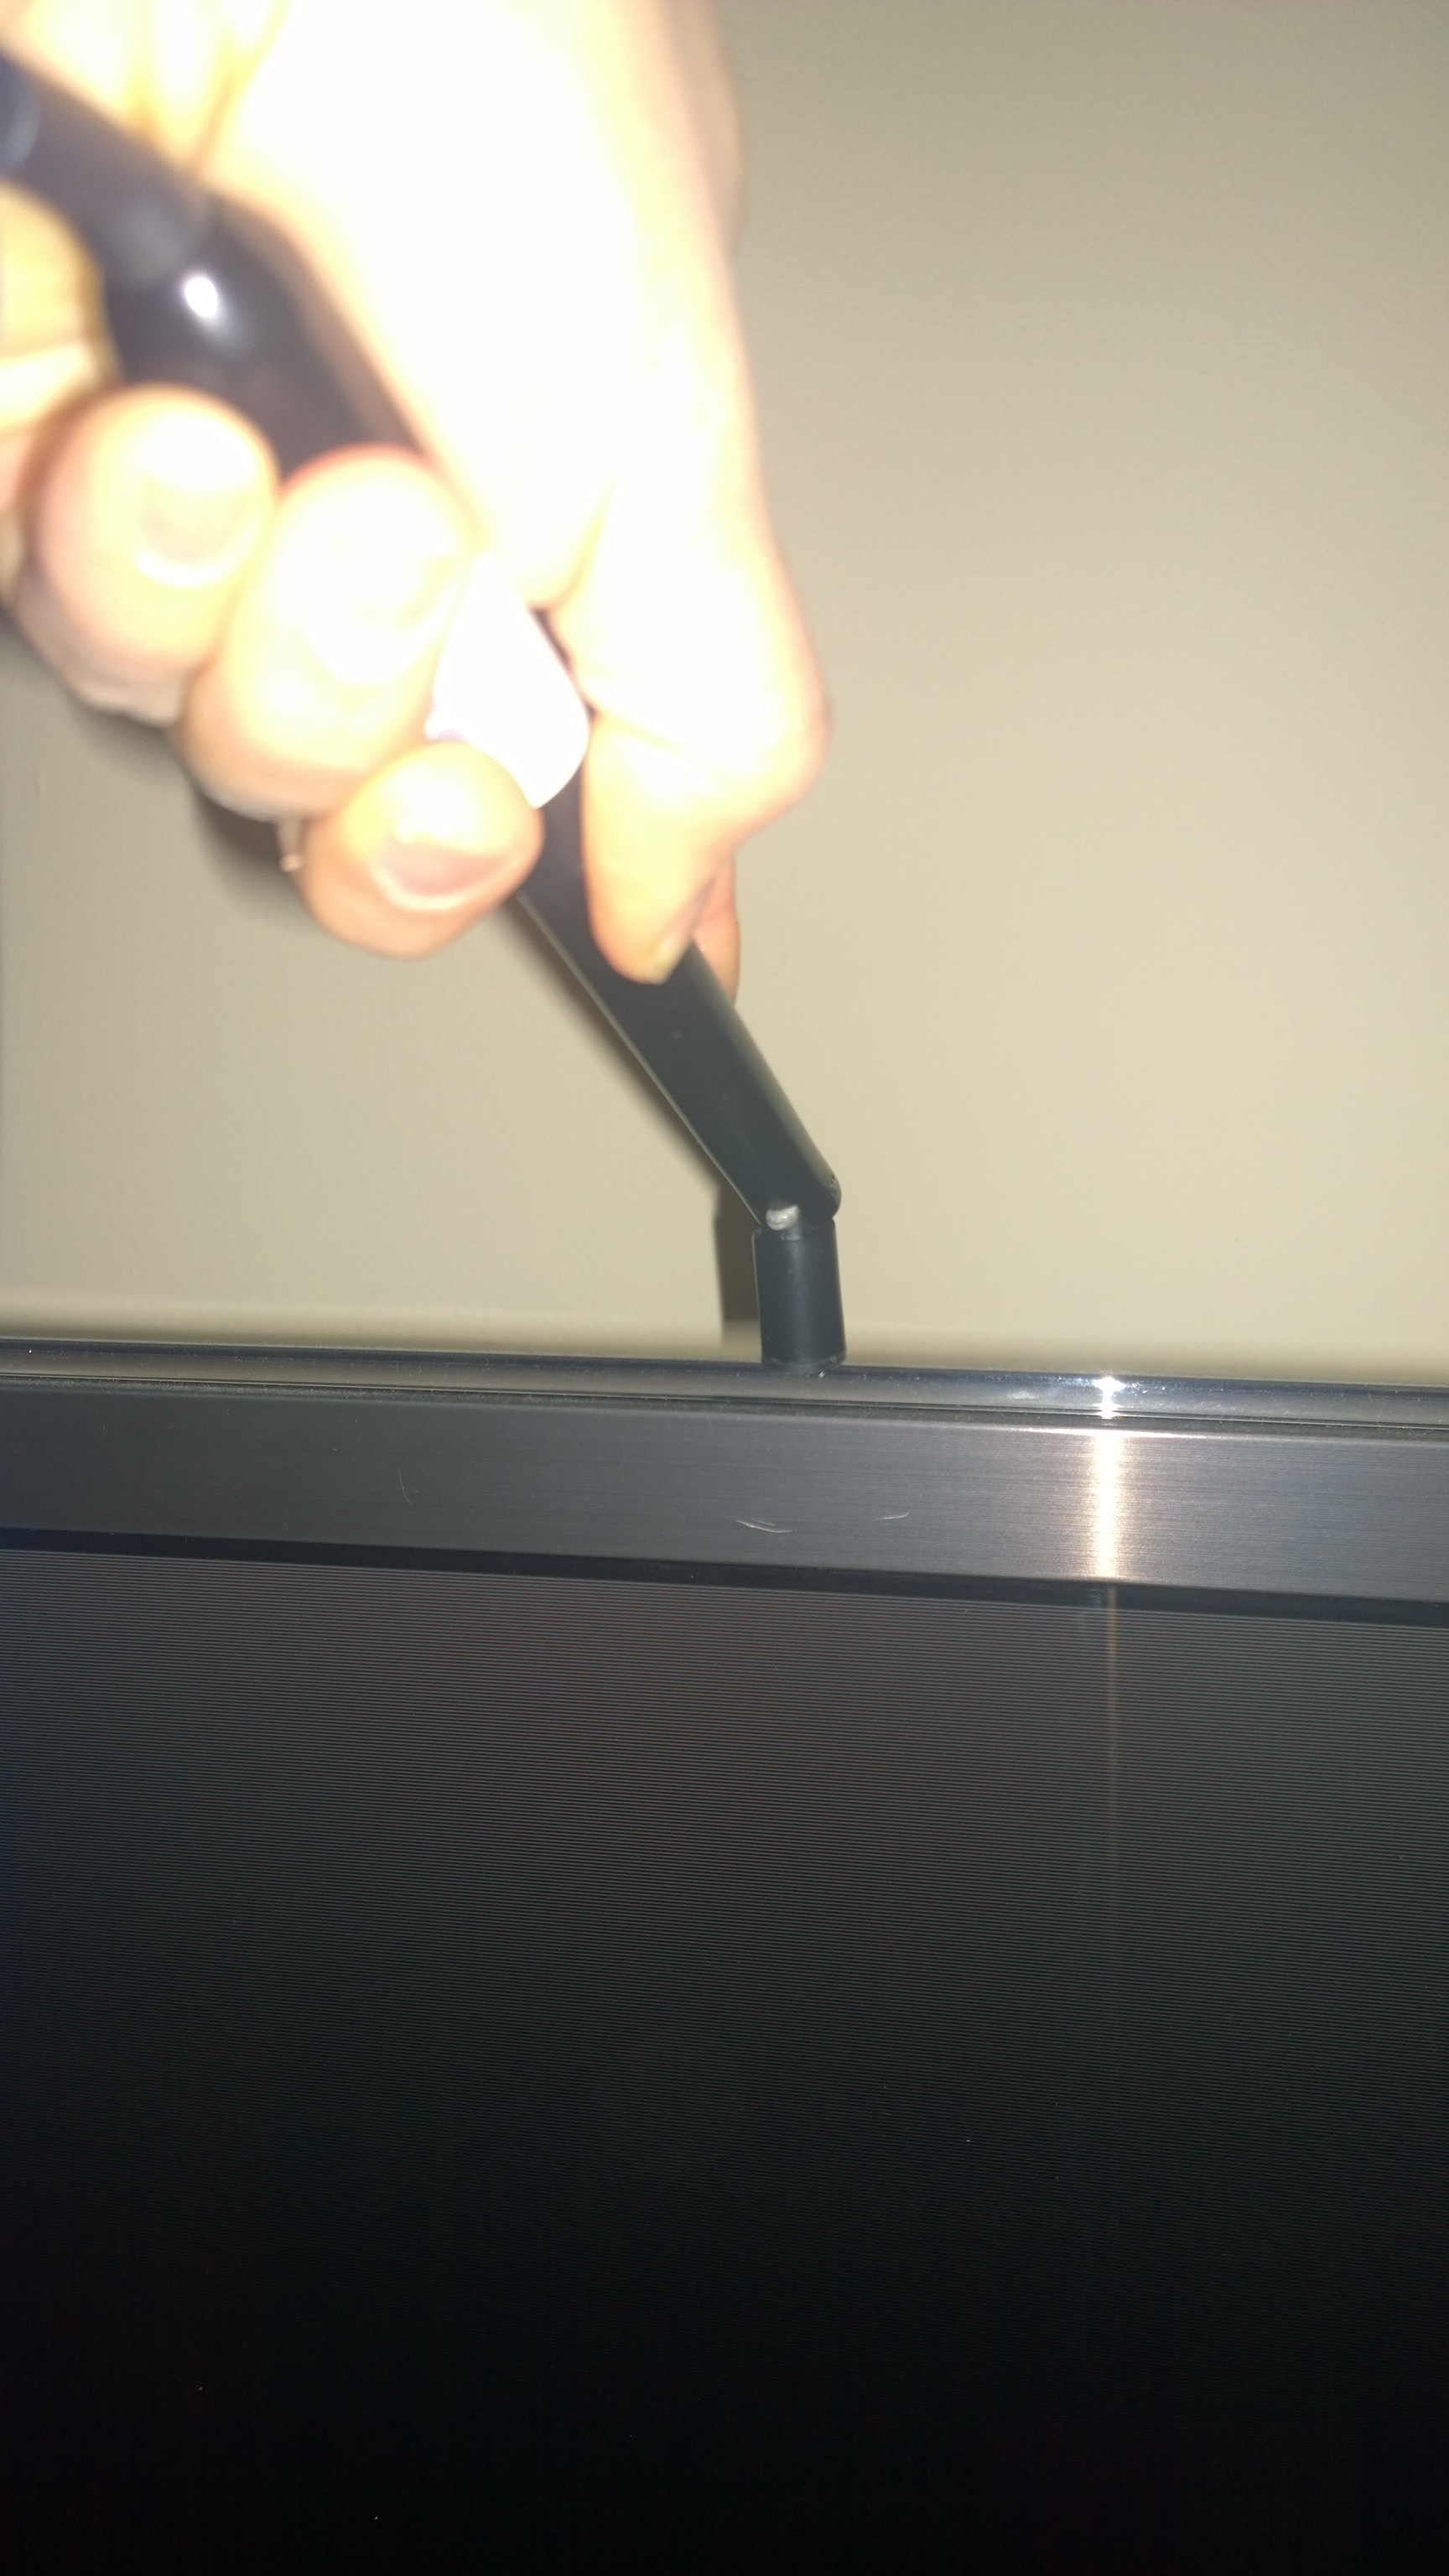
Figure 4: Tip is bent and on the top of the television frame; Parallel to the frame.
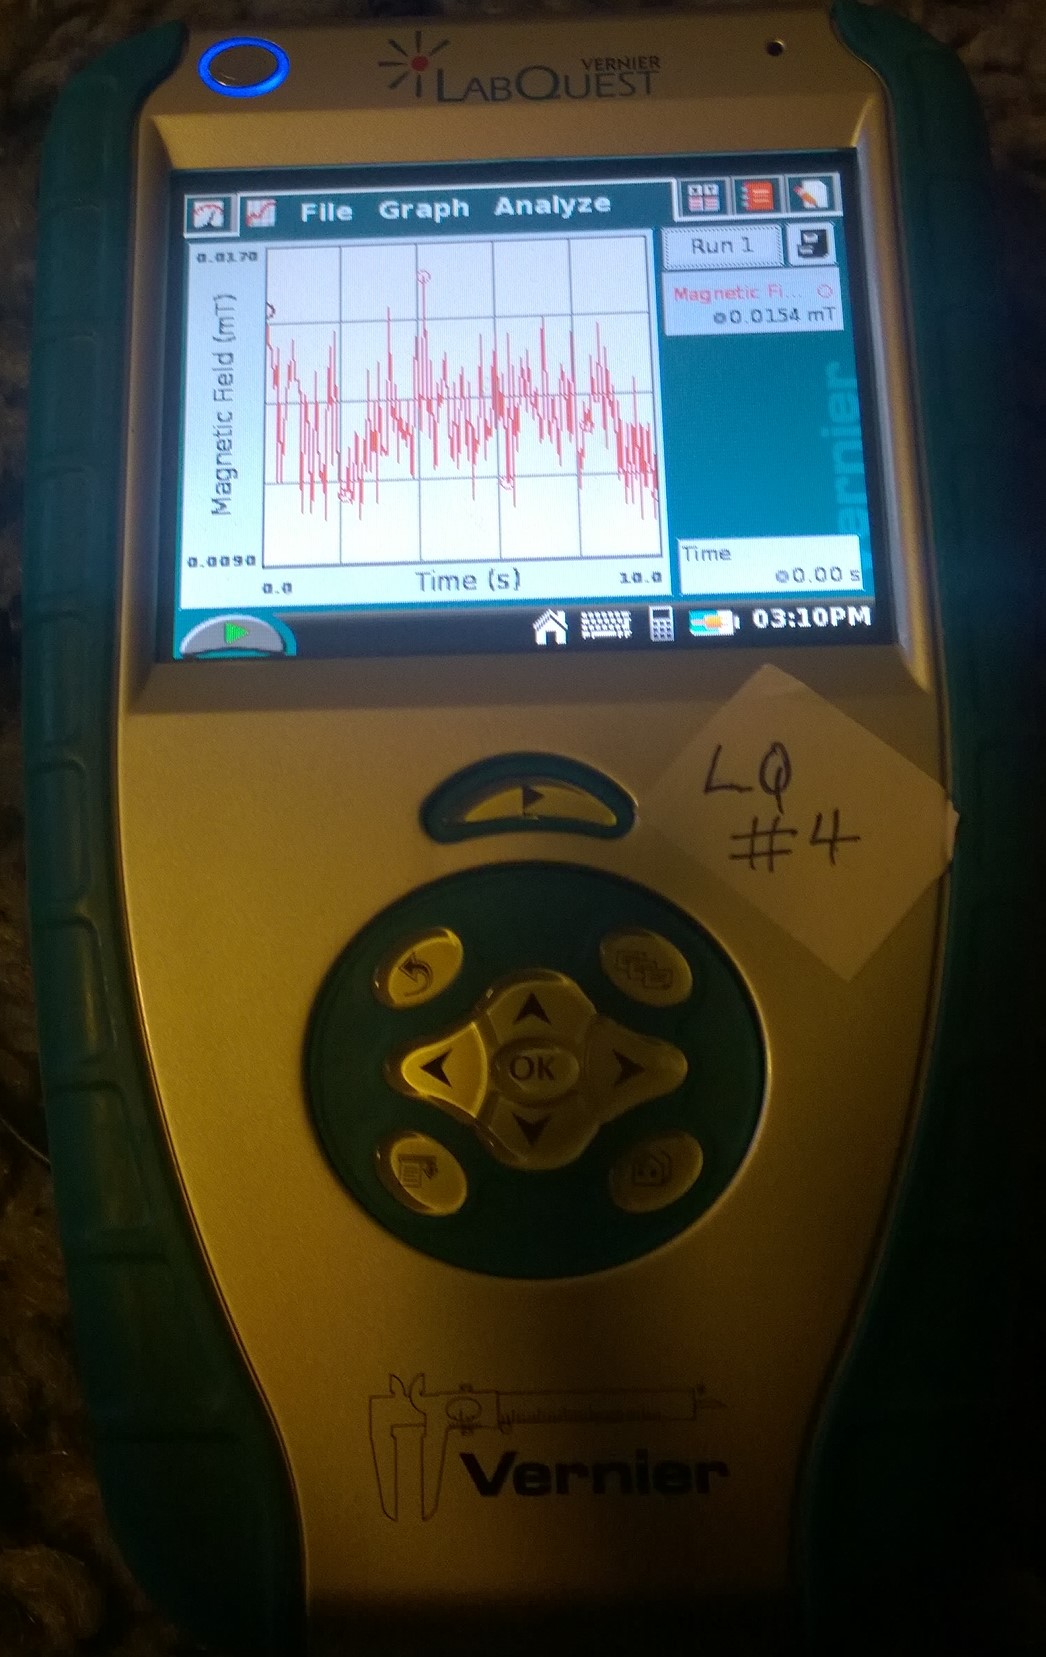
Figure 5: Magnetic Field vs Time graph (over a 10 sec period) on the LabQuest.
![Figure 6: Data collected [updated]](http://pages.vassar.edu/ltt/files/2014/02/Updated-Data.png)
Figure 6: Data collected [updated]

Figure 7: Average magnetic field for the low setting.
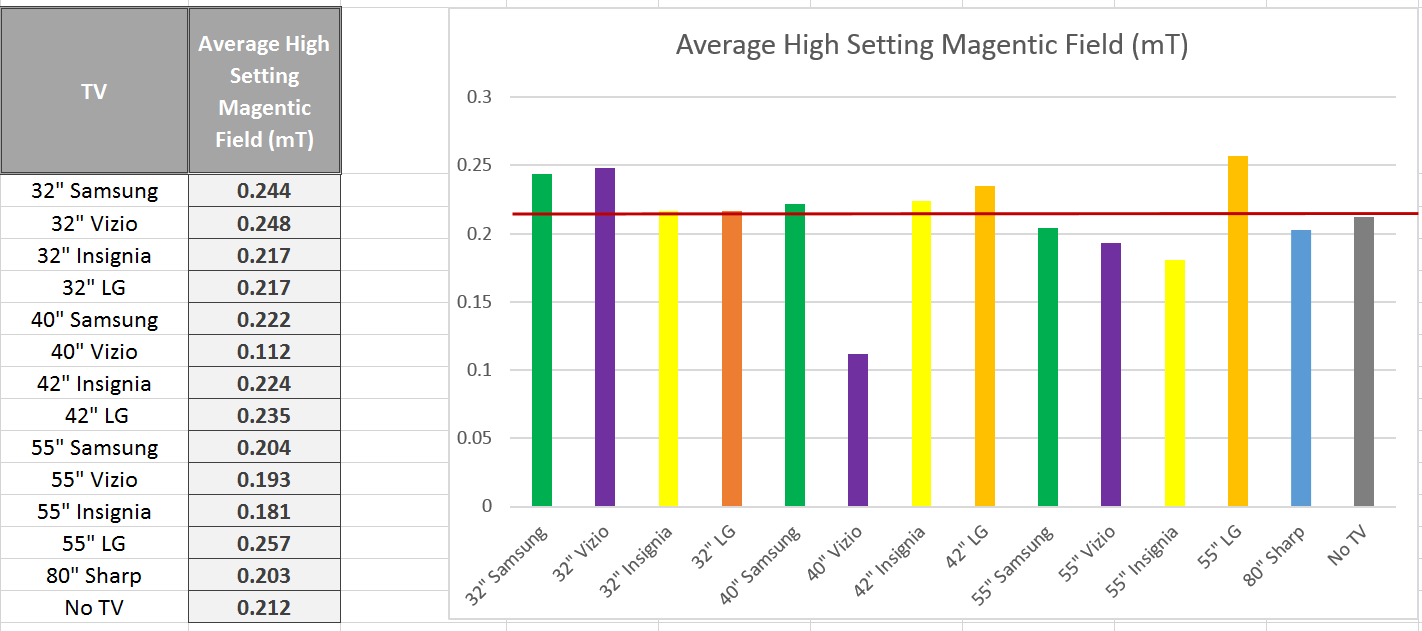
Figure 8: Average magnetic field for the high setting.
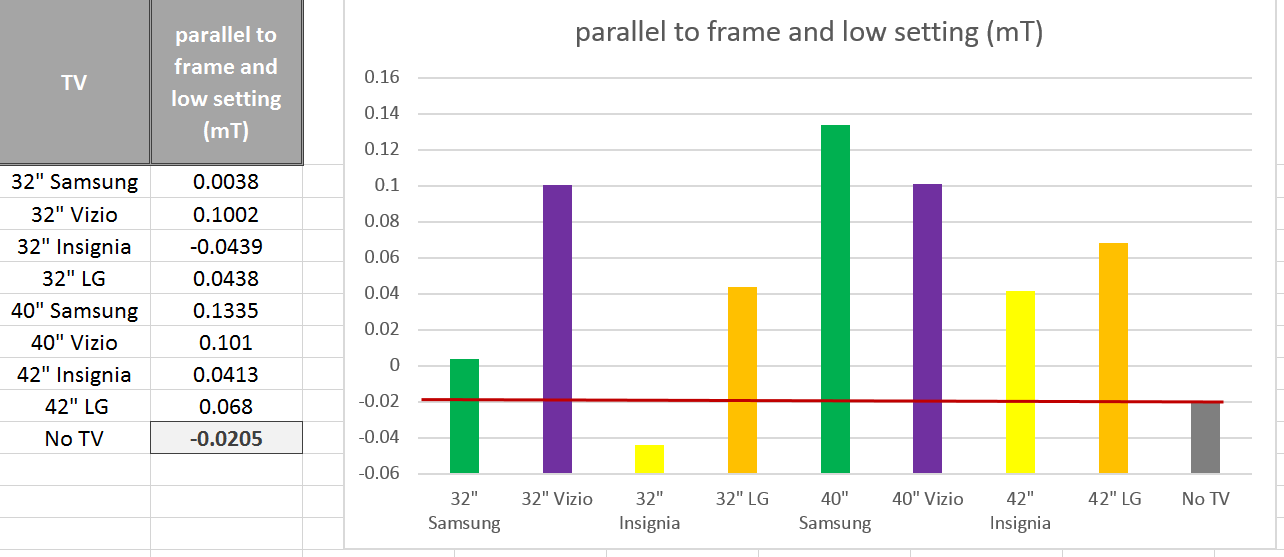
Figure 9: Frame reading under the low setting.
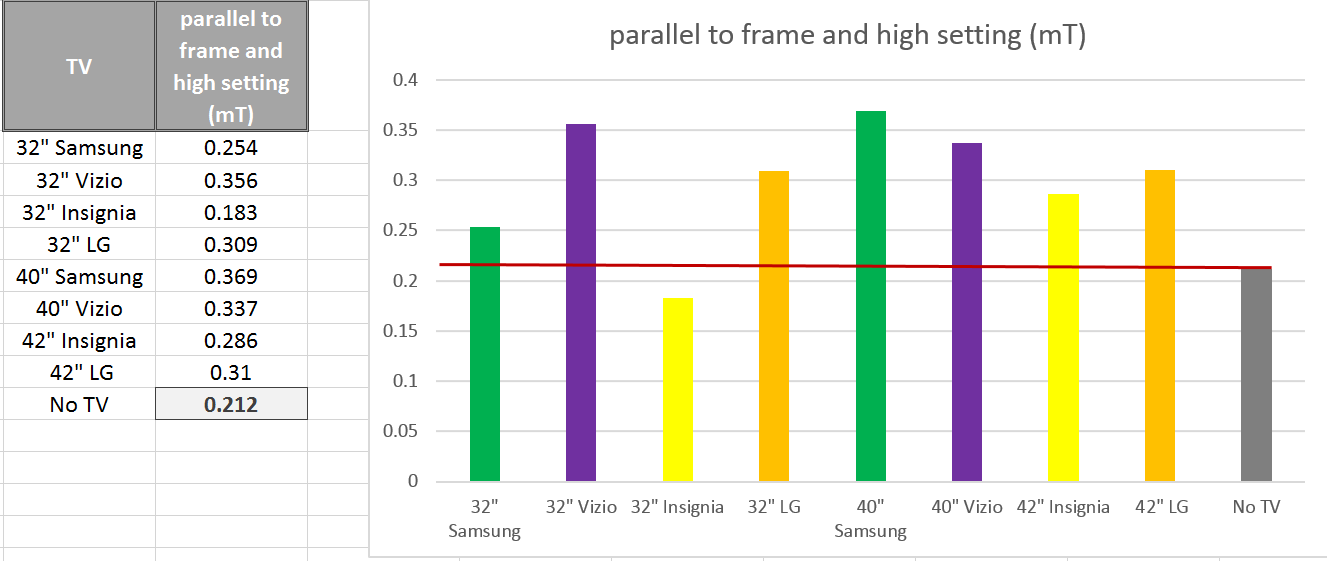
Figure 10: Frame reading under the high setting.
References
http://www.emfrelief.com/emf.html


