Category Archives: Water Spectroscopy

Group 9 Data (Spectroscopic and Light Sensor)

We gathered samples of multiple liquids, including mixtures of a few of them, and analyzed them using two separate instruments; a light sensor, and a portable spectrometer.

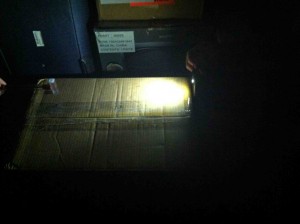
To begin with, we shined light through our samples and measured their opacities using the light sensor.  We took the data in a dark room, holding the samples against the light sensor and exposing it to only one source of light at a constant distance and intensity.  We used a cell phone flashlight.  This is a picture of our experimental setup.

setup 1

The light sensor we used had a slight systematic error of about 2.4 lux, that is, it measured 2.4 lux when completely covered.  We have adjusted for that in the table below.

Liquid Adjusted Opacity Values (Lux)
Water 67
Orange Juice 3.6
Extra Virgin Olive Oil 50
Listerine 63.6
Axe Shower Gel 1.3
Hand Sanitizer 66.8
Sprite 69
Coffee 0.4
Coffee plus Unknown Pineapple Juice 8.9
Shower Gel plus Listerine 19.6
Fireball Cinnamon Whiskey 59
Everclear Grain Alcohol 68.6
Orange Juice plus Oil 5.3
Low Fat Soy Milk 1.1
Whiskey plus Low Fat Soy Milk 3.6
Water plus Low Fat Soy Milk 3.4

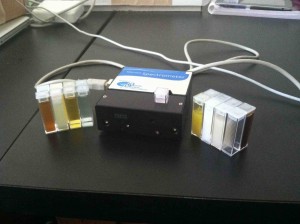
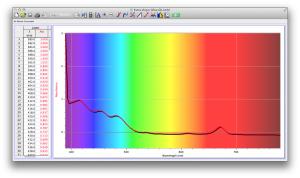
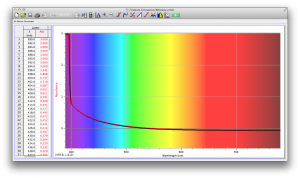
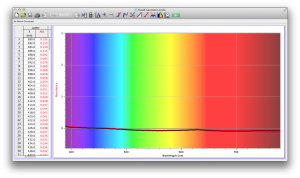
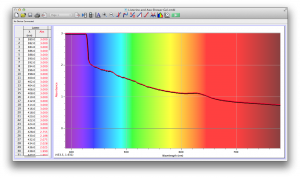
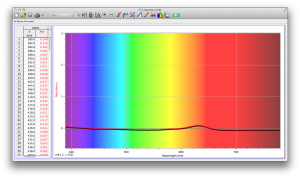
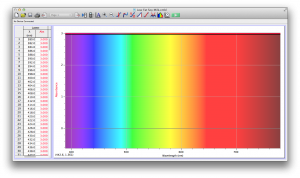
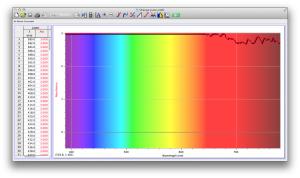
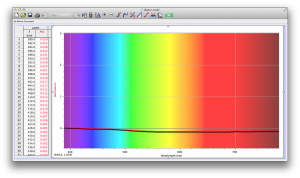
Our second set of data was attained by analyzing our samples through a portable spectrometer.  It also had a small systematic error, which we have accounted for.  The absorption readings were displaced on the y-axis by about 0.5, giving negative absorption readings.  In our graphs, we have displayed the y-axis from -0.5 to 3, which should be read as 0-3.  3 is the maximum opacity that this spectrometer can measure.  The y-axis records absorbance, while the x-axis displays wavelength.  The picture below is of our setup, showing the spectrometer and all the liquid samples we used.

setup 2

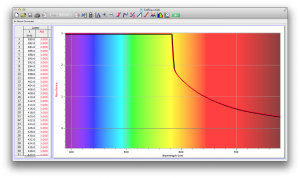
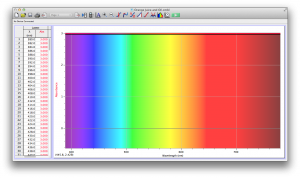
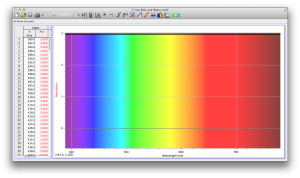
The spectrometer shines light through the samples, and records the absorbance on the wavelengths of the visible spectrum.  Below are our graphs of the data.
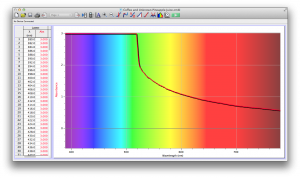
axe shower gel graph Axe Shower Gel

coffee and unknown pineapple juice graph  Coffee and Unknown Pineapple Juice
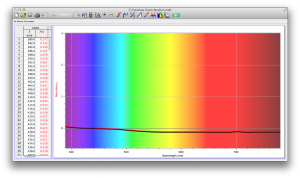
coffee graph  Coffee

everclear grain alcohol graph  Everclear Grain Alcohol

extra virgin olive oil graph Extra Virgin Olive Oil

fireball cinnamon whiskey  Fireball Cinnamon Whiskey

fireball whiskey and soy milk graph Fireball Whiskey and Soy Milk

hand sanitizer graph Hand Sanitizer

listerine and axe shower gel Listerine and Axe Shower Gel

listerine graph Listerine

low fat soy milk graph Low Fat Soy Milk

orange juice  Orange Juice

orange juice and oil graph Orange Juice and Oil

soy milk and water graph Soy Milk and Water

sprite Sprite

watergraph Water


Group Eight Results and Discussion

Results and Discussion:


Water Contaminant Concentration Tests

Hudson River Sunset Lake Drinking Fountain
Copper (Mg/L) 0 0 0
Nitrate (Mg/L) 5 0 0

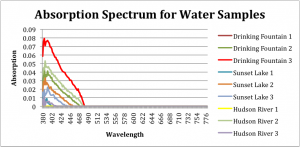
Unfortunately, we were unable to deduce anything about the water chemistry from our analysis of the water samples using a spectrometer –much less the concentration of contaminants!  The tests using the aquarium water sampling kits failed to demonstrate that either the Hudson River or Sunset Lake was not potable. The EPA water quality standard for nitrates is 10 mg/L, well below what we saw in the Hudson River. We were surprised to see that the Sunset Lake sample registered no nitrates. The New York government website states that a level of 3 mg/L is expected in any body of water where there is a significant human presence. We suspect this is due to the quality of our testing kit, which is only accurate to 5mg/L. So, does this mean the water in Sunset Lake and the Hudson River is potable? Absolutely not! Though our data does not allow us to conclude our water samples were not potable, we were able to test for only two of the over eighty contaminants listed on the EPA website.

Though we did not find any evidence in our results, our group performed further research to confirm our initial hypothesis that the Hudson River near Poughkeepsie was not potable. We found a USGS report on water quality in the Hudson River Basin that showed lead, chromium, and zinc were found in higher concentrations than deemed safe for drinking water in Hudson River water samples taken from a site near Poughkeepsie. Furthermore, we found a report published by the environmental organization Riverkeeper that showed that over 10% of water samples taken from the Hudson River near Poughkeepsie contained an unacceptable concentration of Enterococcus bacteria.

We were unable to find similar studies about the water quality of Sunset Lake. As stated above, our results do not confirm that the water from Sunset Lake is safe for human consumption. Further testing is needed to determine whether or not the water is potable. It is our opinion that future tests should focus on the presence of microorganisms, as they are much easier to detect than small concentrations of chemical contaminants.

Group VIII Conclusion

Our experiment returned different results than we expected.  Initially we were expecting the tests we performed (nitrate and copper tests) to give us sufficient evidence to classify our two water sources—the Hudson River and Sunset Lake—as non-potable.  However, as we discovered, the nitrate and copper levels are sufficiently low to be below the EPA’s cut-off for potability. We were disappointed by this outcome, as we had hoped to prove, beyond a shadow of a doubt, that the water sources were dangerous to drink.  In the future, given more time, we would like to have been able to perform tests to determine bacteria levels in the water, such as E. coli or other coli-form bacteria, and the levels of other organisms, such as Giardia. We would expect the levels of these bacteria and organisms to be too high to allow for safe drinking. Perhaps the spectroscopy readings suggest the presence of things other than simply water molecules, as the Hudson River and Sunset Lake had higher absorbance in the violet range of the spectrum than regular drinking water.

This experiment, while perhaps unsuccessful in terms of what we had hoped to discover, is a good example of why one or two negative tests do not necessarily account for all possible contaminants.

In conclusion, despite the negative results from our tests, we would still suggest that you choose not to drink from the Hudson or Sunset Lake.

Group VIII Project Plan

We are testing the water in Sunset Lake and the Hudson River using a spectrometer and a Tetratest Laborett Home Aquarium Water Testing Kit. We’ll be testing the levels of inorganic chemicals listed on the EPA’s Drinking Water Contaminants List. We expect that the levels of contaminants in both water sources will allow us to classify them as non-potable. Based on preliminary research, we have found that portions of the Hudson River contain Mercury and Cadmium above the EPA’s recommended levels, rendering them unsafe for human consumption. In addition, Vassar lore tells us that Sunset Lake contains heavy metals, in excess of the threshhold determined by the EPA.

We will collect water samples from the Hudson River and Sunset Lake on Monday, November 14, 2011. Testing will begin at 3 PM on Wednesday, November 16th, 2011. Stephen will make the data table and upload  it to the LTT blog site. We will meet at 11 AM on Friday, November 18th, to discuss our results and write up a conclusion based on said discussion. We will present our results in the form of a public service announcement. Filming will take place on Monday, November 21st. Rachel will film, Sam will write the script, and we will all contribute to the editing process.

Group 8 Abstract

We plan to compare water samples from Sunset Lake and the Hudson River at Poughkeepsie. We will compare spectroscopy readings and use a home aquarium water testing kit to determine the two sources’ potability. Should Vassar legend hold true, we expect Sunset Lake to contain more heavy metals due to its proximity to the Mudd chemistry building. We do not expect either water source to be potable.