Results:
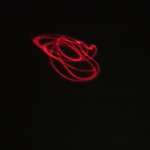
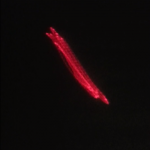
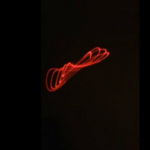
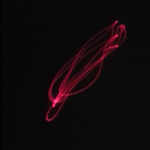
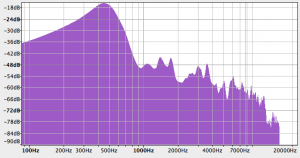
The results of our study are a collection of videos that documented the sound-designated laser patterns of two male and two female voices, as well as graphs depicting the decibel relationship to frequency of the sentences spoken. We also took screen shots of the laser patterns from each persons video of them saying the sentence “the quick brown fox jumps over the lazy dog” and charted them next to the individuals frequency/decibel graphs.
- Becca’s Voice
- Elizabeth’s Voice
- Jared’s Voice
- Tim’s Voice
Additional Male-Voice Frequency Graph:
Results Analysis:
The results show that male voices produce a larger laser pattern, one that affects the balloon-drum differently than the female voices; when comparing the videos/screenshots, the male voice patterns create bigger circles and squiggly patterns, when the female voices produce smaller figure 8s and tighter movement.
This difference may be explained by resonance modes. In short, when the balloon drum resonates with a certain frequency, it will oscillate/move more and with with a greater amplitude. When the male subjects spoke into the cup there were more vibrations/oscillations most likely because frequencies in a man’s voice are in resonance with the drum (stretched balloon). The human, and especially the male voice, has many undertones, and the drum vibrates more because of the increased number of resonant frequencies produced. This is why the male subjects created patterns covering larger surface area then the female subjects.
We did not have any specific predictions for male v. female voices in our project plan, but we expected that gender would affect the patterns differently. This expectation was confirmed by our results with the laser device. After running multiple tests with the laser device and analyzing the footage we decided that the differences were due to the differing frequencies present in lower, generally male, and higher, generally female, voices. The different frequencies produce different sound-waves which resonate uniquely with the drum and create different patterns. Although every voice regardless of gender creates a unique pattern, there are more similarities in the patterns between same gender voices than there are between genders.
Science Used:
We used a device to map the vibrations from a human voice visually allowing us to study resonance modes/the analysis of sound waves using frequency and decibel. Using the Vernier LabQuest Pro Sound Level Meter we mapped the decibel levels of our voices. And using a program called Audacity we were able to graph the frequency alongside the decibel.
The science used during this project included: resonance modes, and the analysis of sound waves (frequency, decibel–how it’s measured).
In Hindsight:
Some things we would do differently if we had to do the project again would be: change and experiment with the type of balloon used (ex. thicker v. thinner rubber) to find the most sensitive drum, and experiment with the types of cups used (paper, plastic, etc) to see the dampening effects the material may have on the sound waves.
Next Steps:
If we had six more weeks to continue the project, we would continue to take data from different male and female voices to get a better idea of the differences between the two; we would also vary the ages of the subjects to see if there is a difference in older v. younger voices; we would attempt to measure the different frequencies of music notes (through finding a musical apparatus/instrument or a singer that could produce specific pitches) to further examine the effects of specific frequencies and possible find the resonant one. It would also be interesting to try to discover and catalog what patterns individual notes make visually and then to see what happens when multiple notes are played at once, like in a chord or a song. Also to see how different a note looks across gender; would the same pitch look the same when sung by different people?
