We gathered samples of multiple liquids, including mixtures of a few of them, and analyzed them using two separate instruments; a light sensor, and a portable spectrometer.
To begin with, we shined light through our samples and measured their opacities using the light sensor. We took the data in a dark room, holding the samples against the light sensor and exposing it to only one source of light at a constant distance and intensity. We used a cell phone flashlight. This is a picture of our experimental setup.
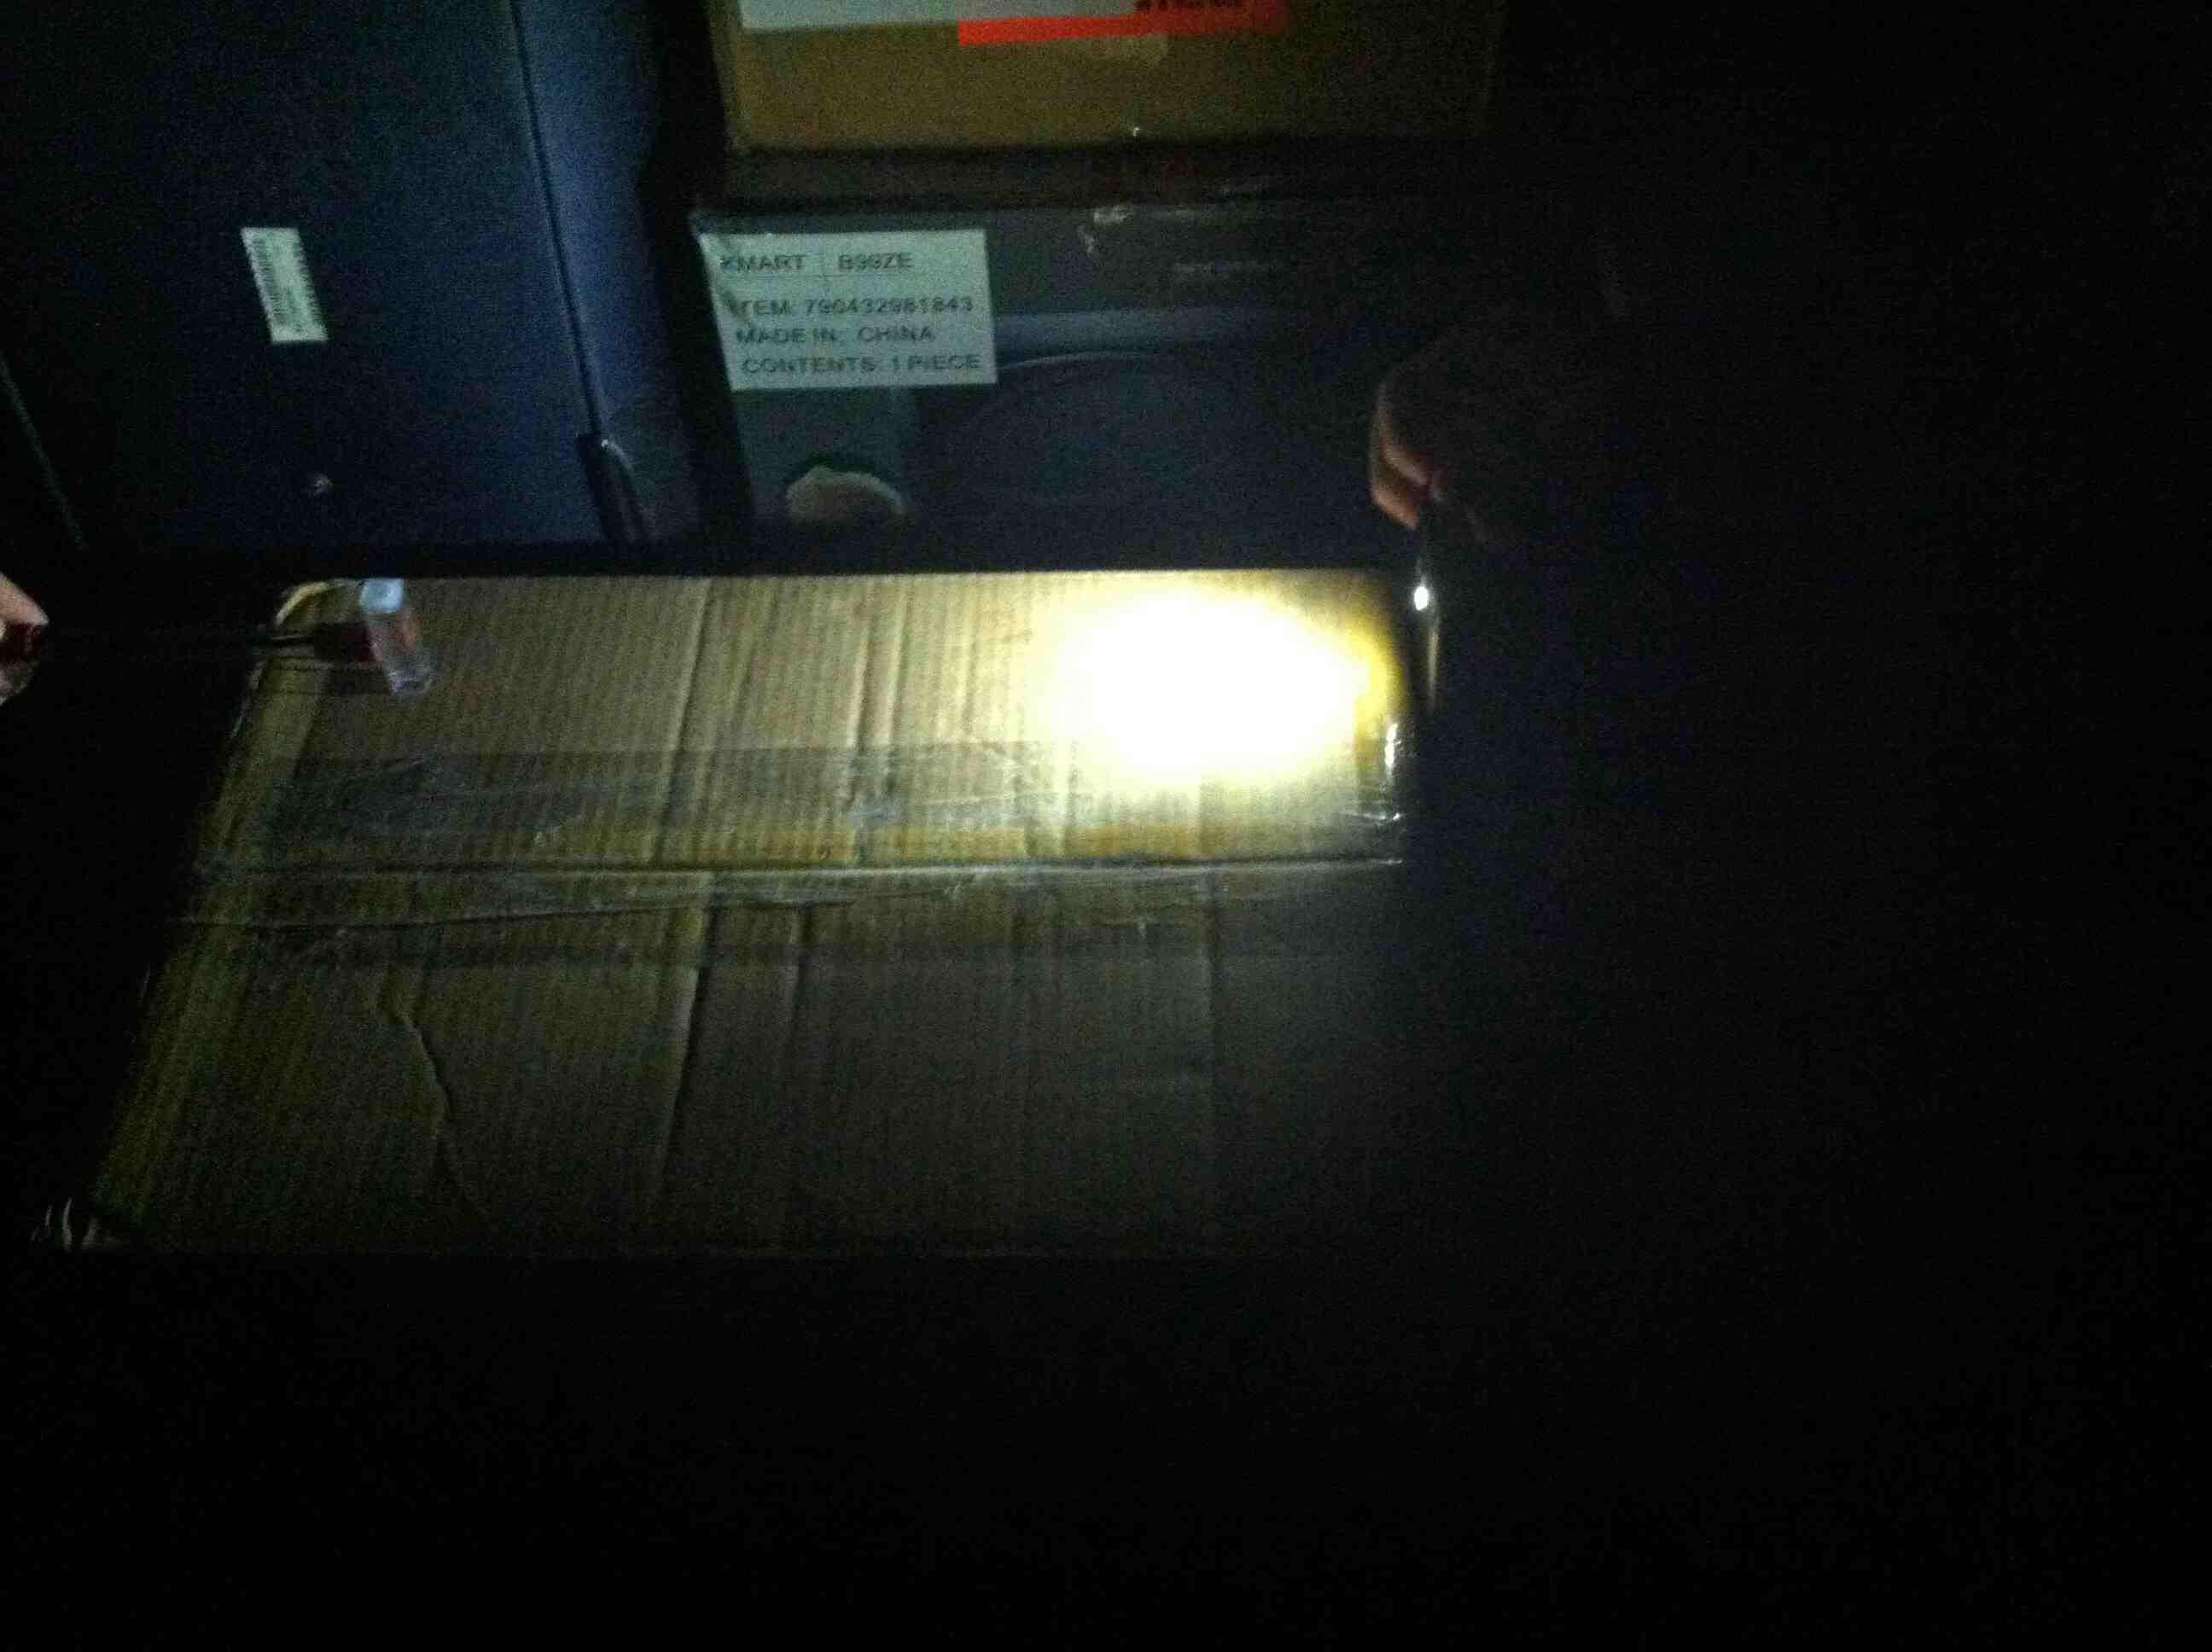
The light sensor we used had a slight systematic error of about 2.4 lux, that is, it measured 2.4 lux when completely covered. We have adjusted for that in the table below.
| Liquid | Adjusted Opacity Values (Lux) |
| Water | 67 |
| Orange Juice | 3.6 |
| Extra Virgin Olive Oil | 50 |
| Listerine | 63.6 |
| Axe Shower Gel | 1.3 |
| Hand Sanitizer | 66.8 |
| Sprite | 69 |
| Coffee | 0.4 |
| Coffee plus Unknown Pineapple Juice | 8.9 |
| Shower Gel plus Listerine | 19.6 |
| Fireball Cinnamon Whiskey | 59 |
| Everclear Grain Alcohol | 68.6 |
| Orange Juice plus Oil | 5.3 |
| Low Fat Soy Milk | 1.1 |
| Whiskey plus Low Fat Soy Milk | 3.6 |
| Water plus Low Fat Soy Milk | 3.4 |
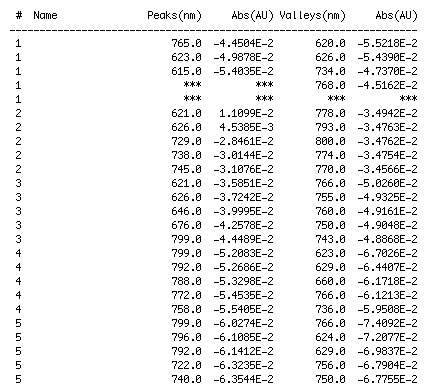
Our second set of data was attained by analyzing our samples through a portable spectrometer. It also had a small systematic error, which we have accounted for. The absorption readings were displaced on the y-axis by about 0.5, giving negative absorption readings. In our graphs, we have displayed the y-axis from -0.5 to 3, which should be read as 0-3. 3 is the maximum opacity that this spectrometer can measure. The y-axis records absorbance, while the x-axis displays wavelength. The picture below is of our setup, showing the spectrometer and all the liquid samples we used.
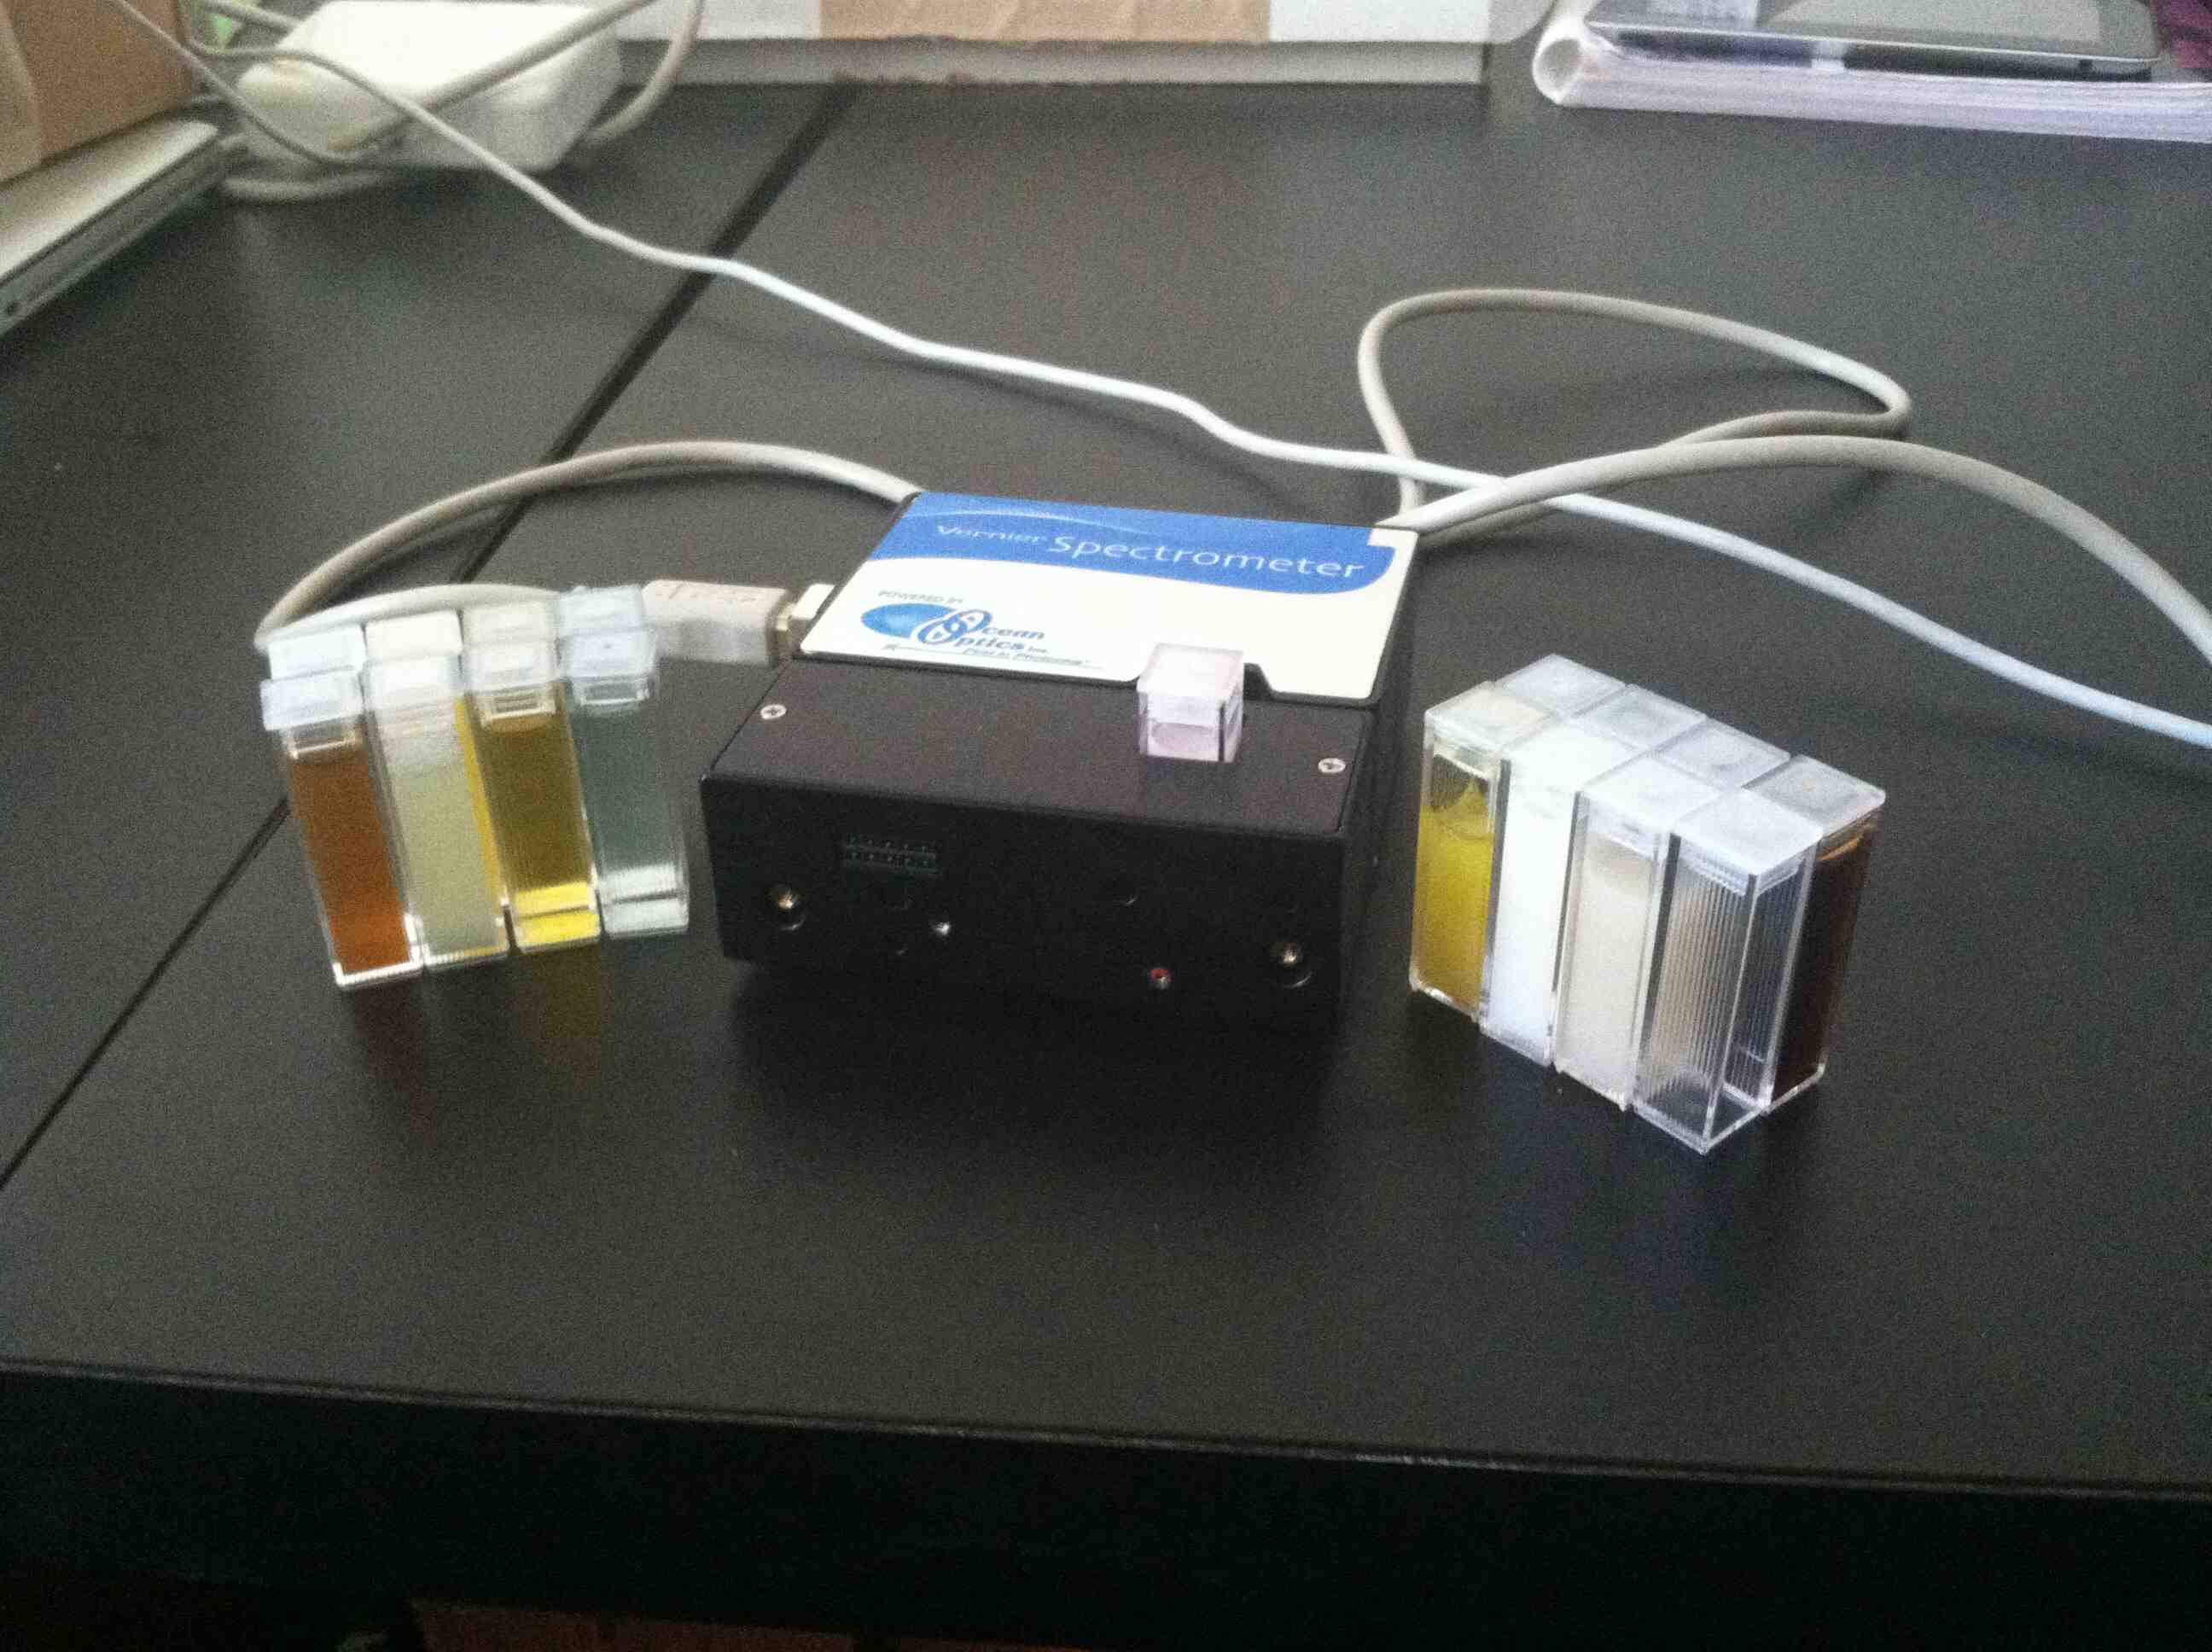
The spectrometer shines light through the samples, and records the absorbance on the wavelengths of the visible spectrum. Below are our graphs of the data.
 Axe Shower Gel
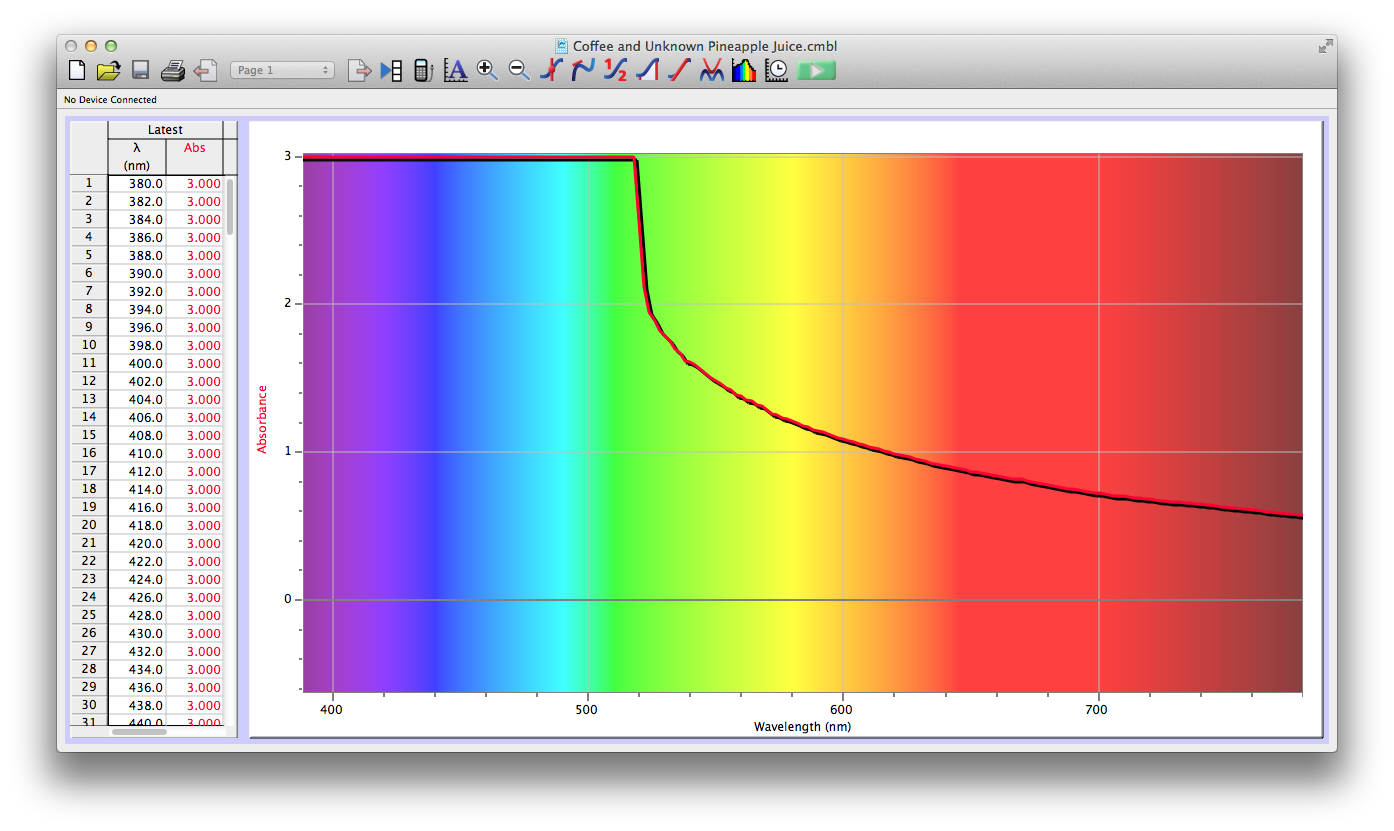 Coffee and Unknown Pineapple Juice
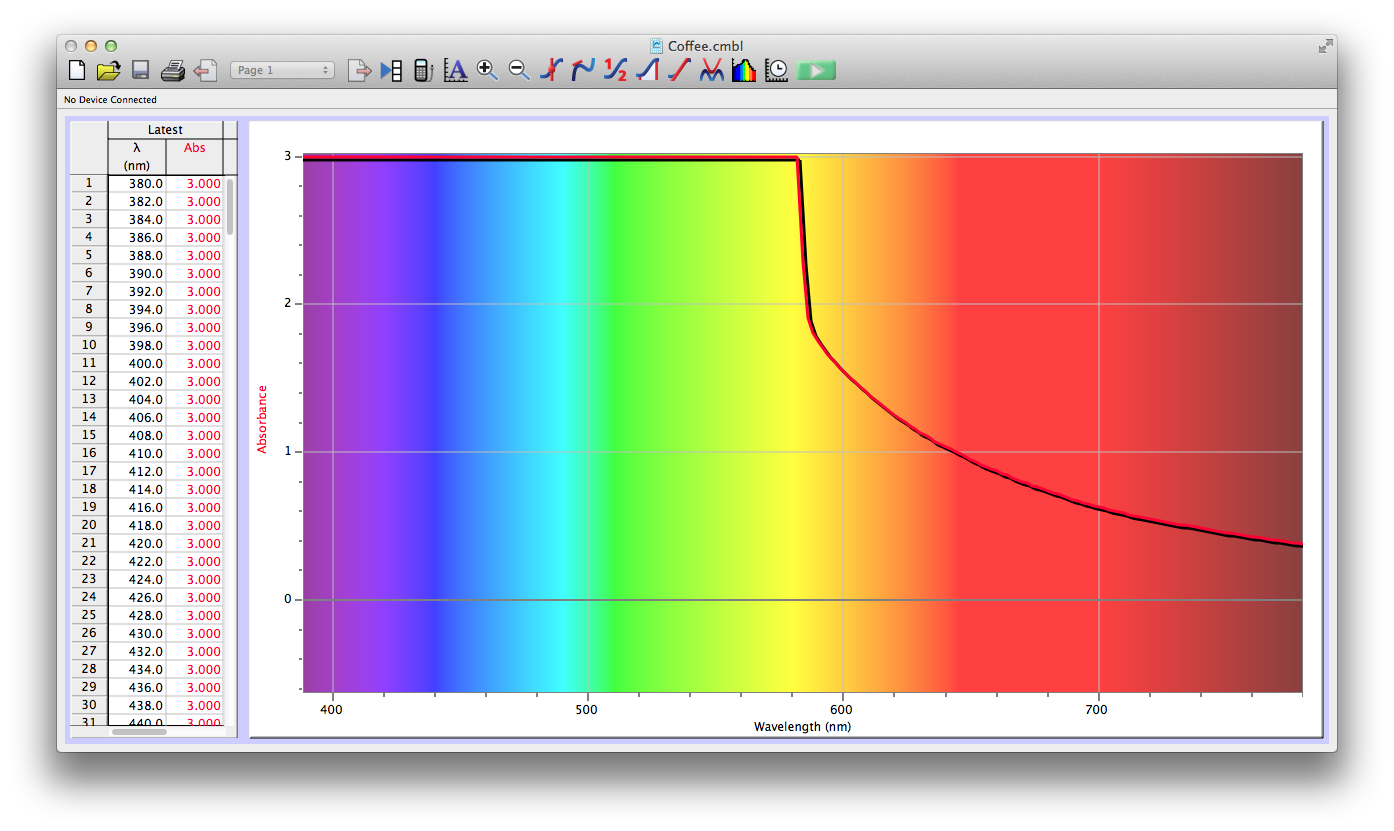 Coffee
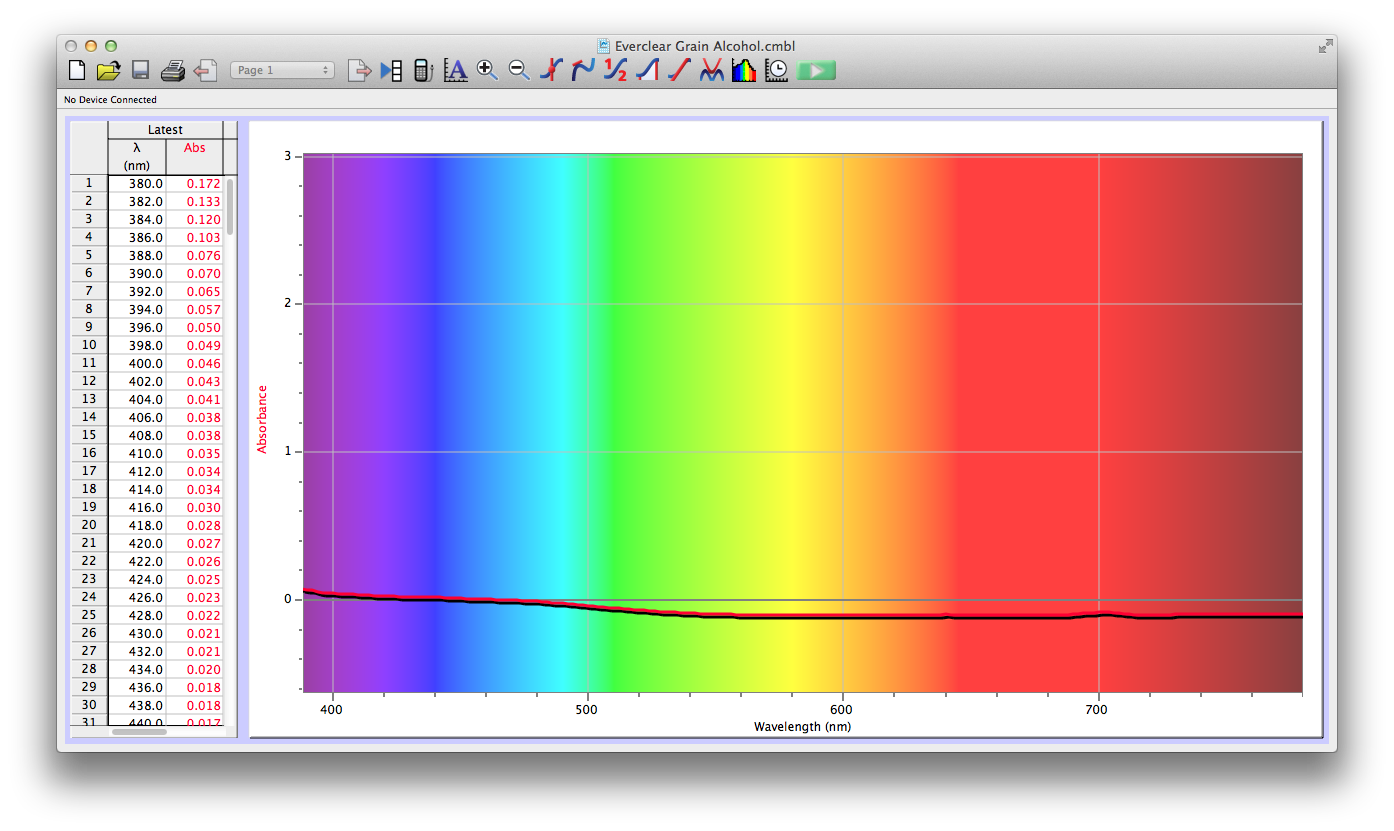 Everclear Grain Alcohol
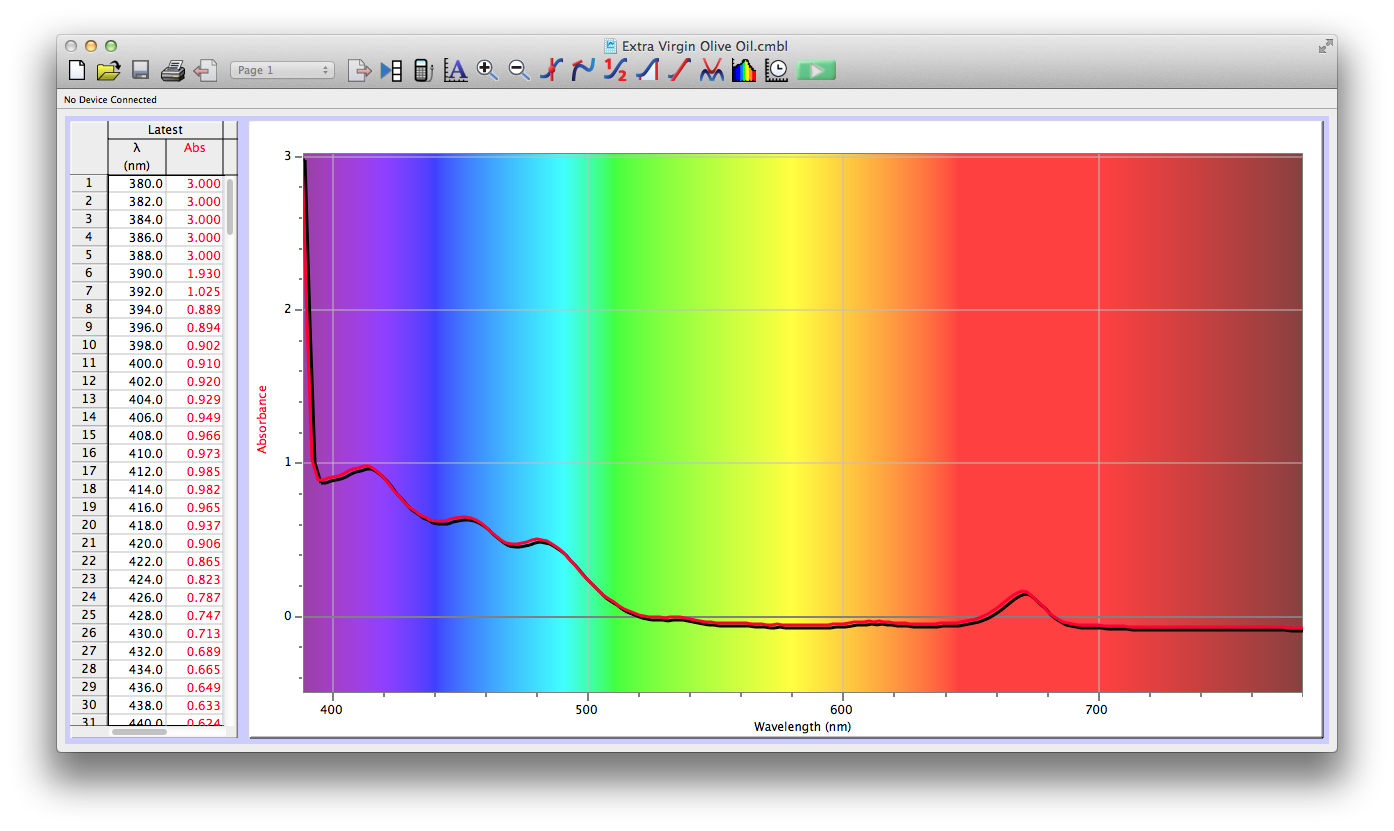 Extra Virgin Olive Oil
 Fireball Cinnamon Whiskey
 Fireball Whiskey and Soy Milk
 Hand Sanitizer
 Listerine and Axe Shower Gel
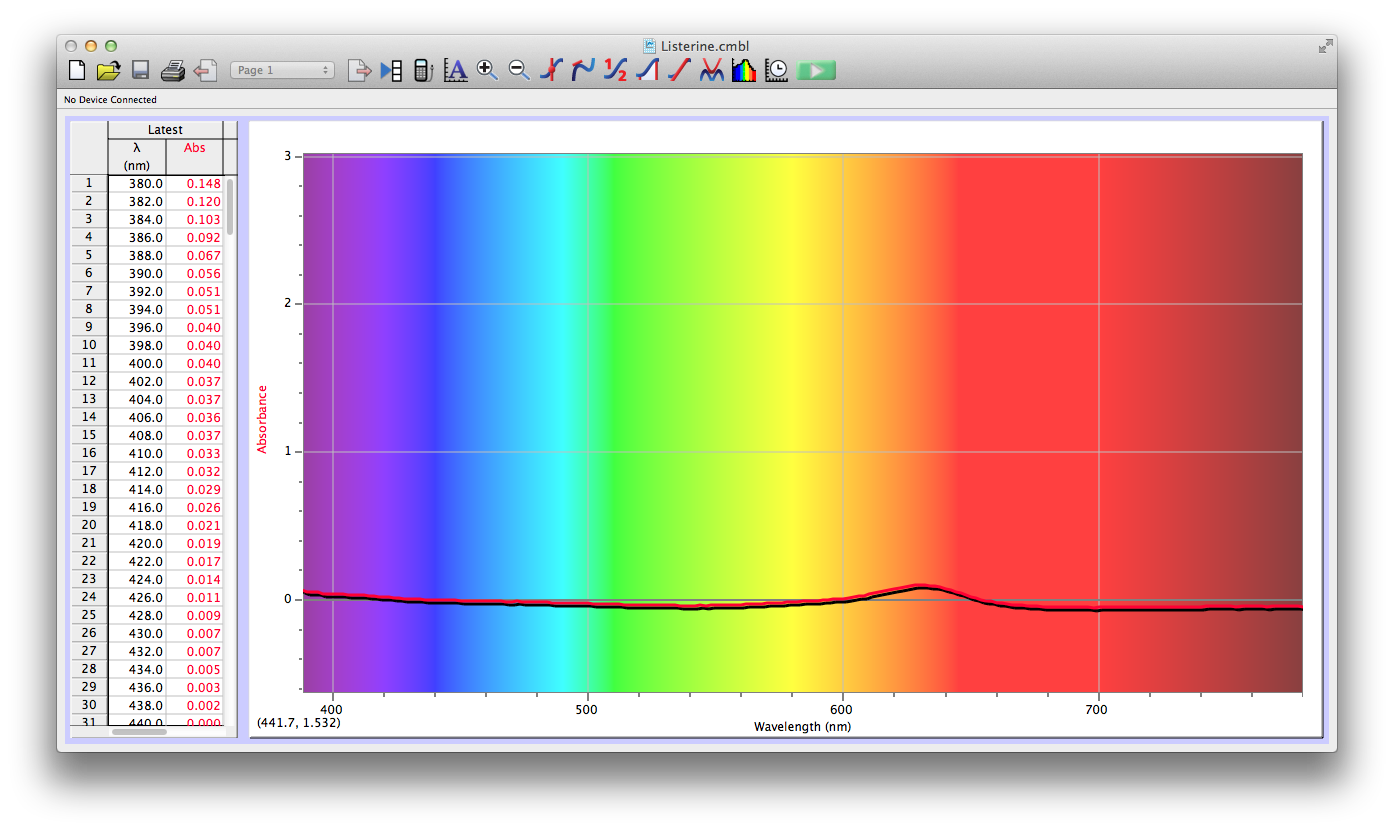 Listerine
 Low Fat Soy Milk
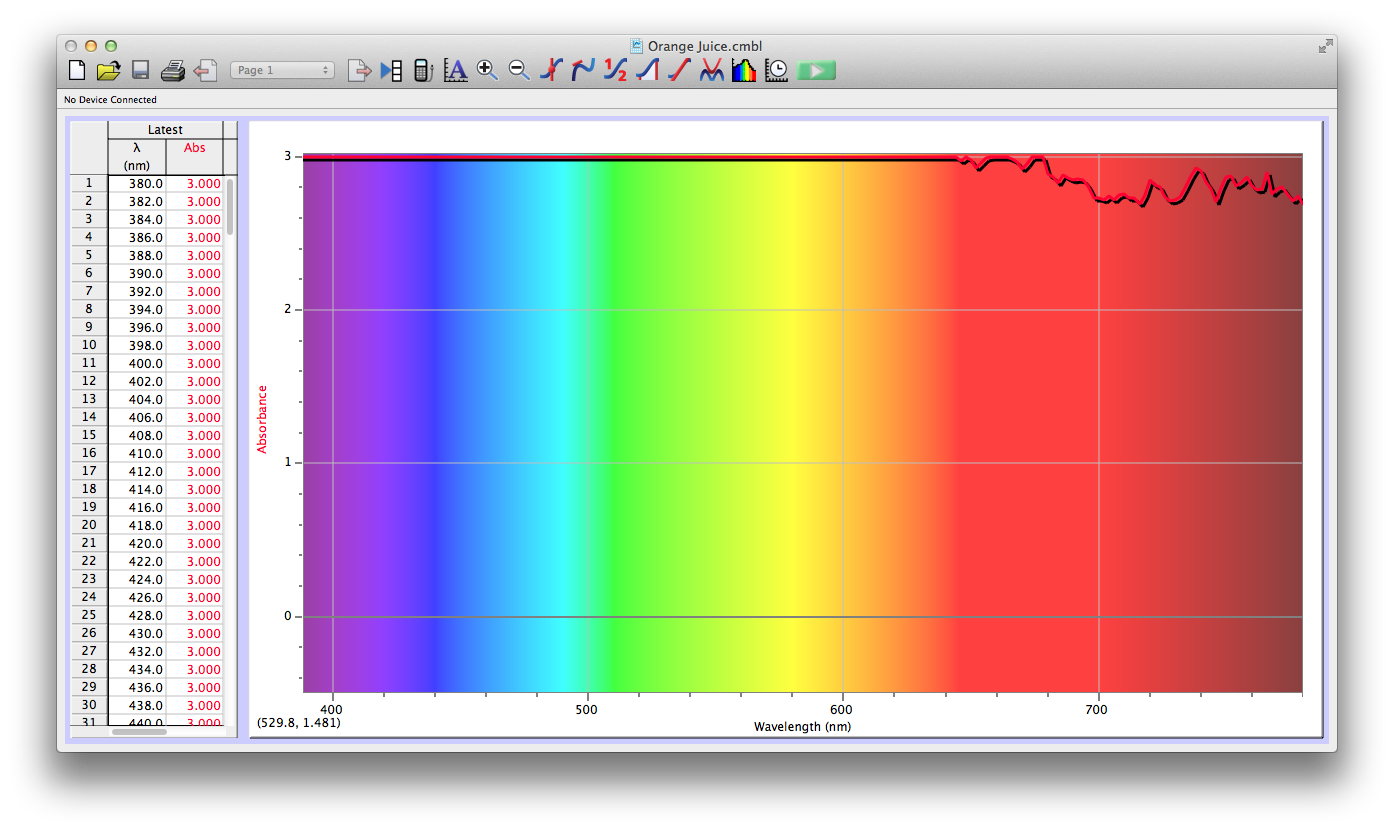 Orange Juice
 Orange Juice and Oil
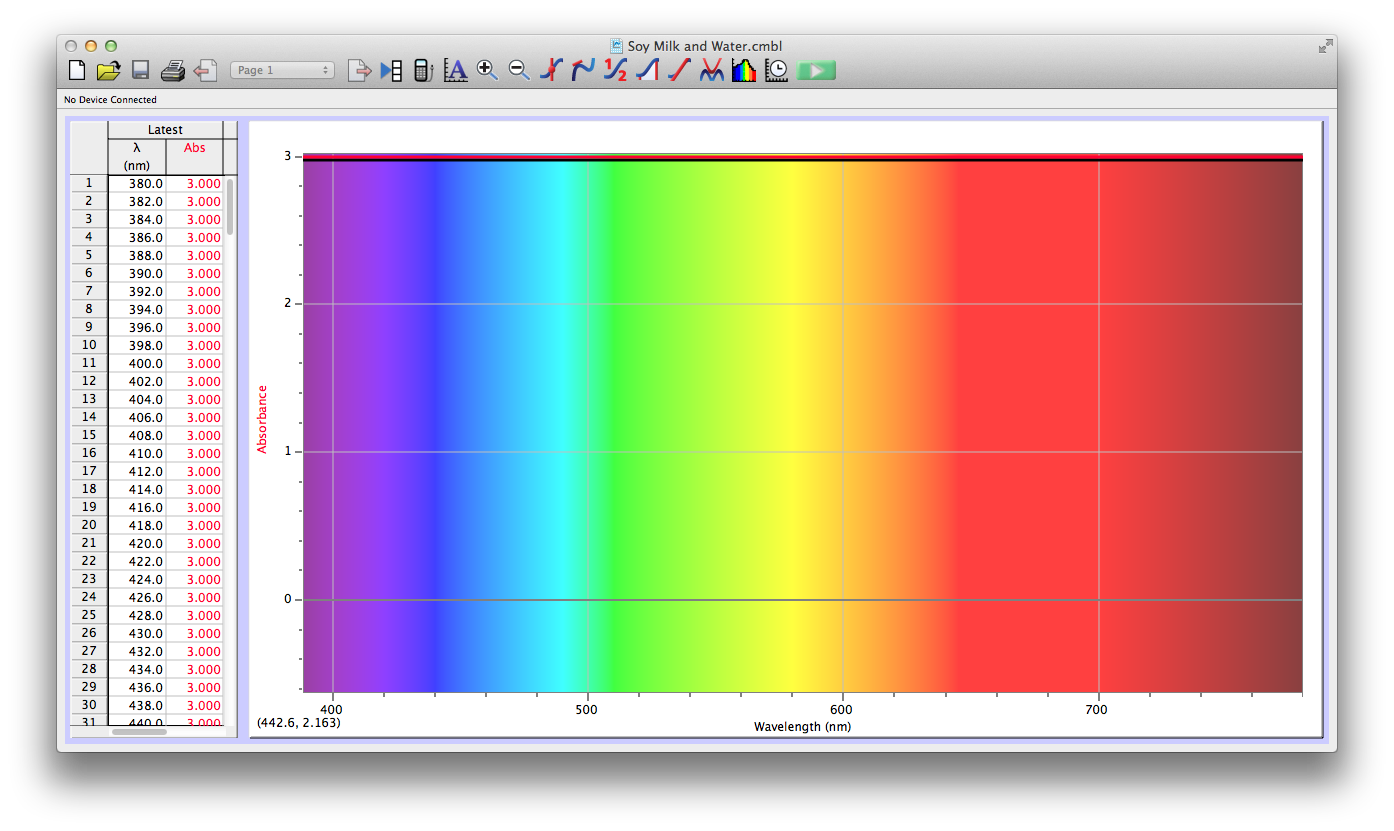 Soy Milk and Water
![]() Sprite
Sprite
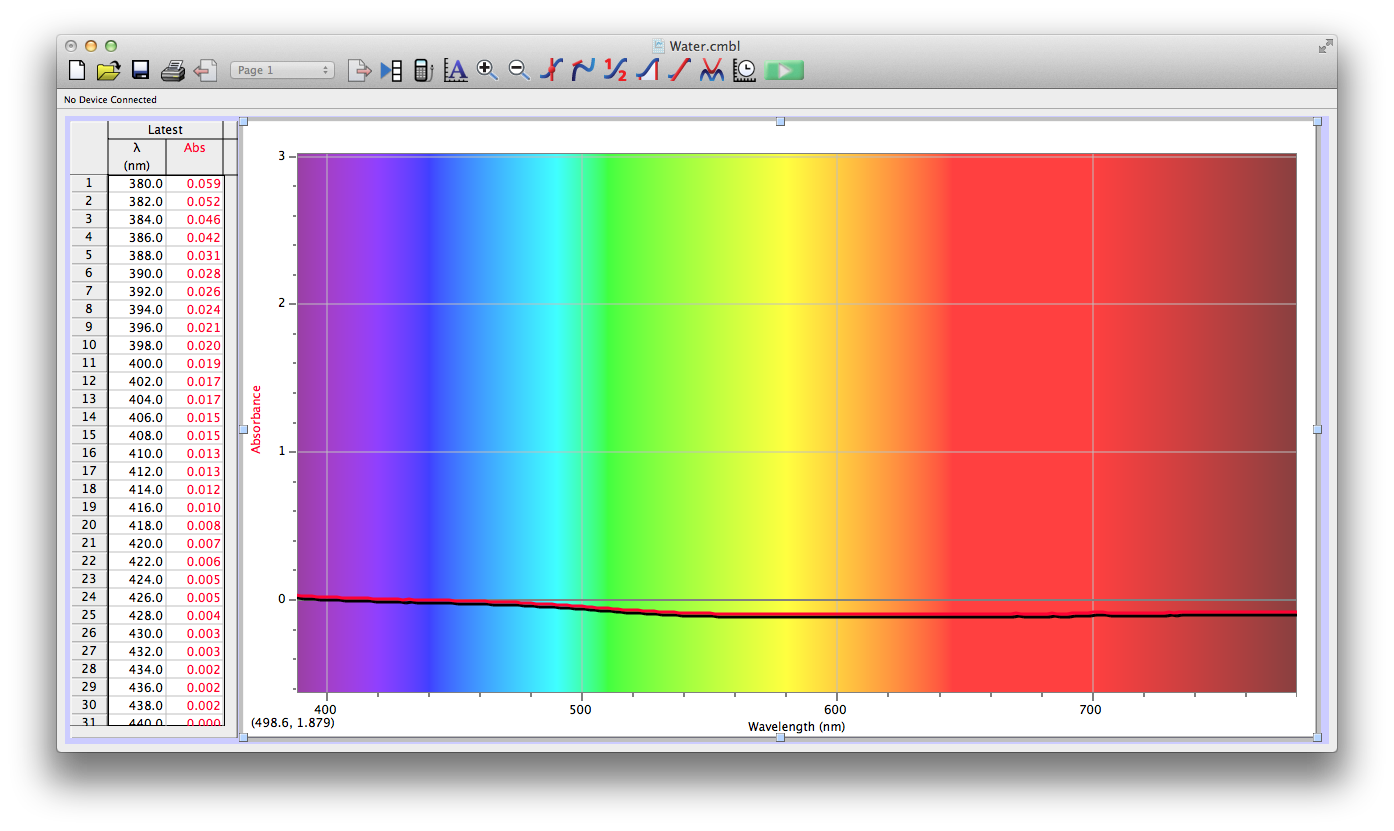 Water
Water