Author Archives: emfoley

How To Cook Yourself: Group 8 Analysis and Conclusions

I. Results

A. Results Regarding Radiation

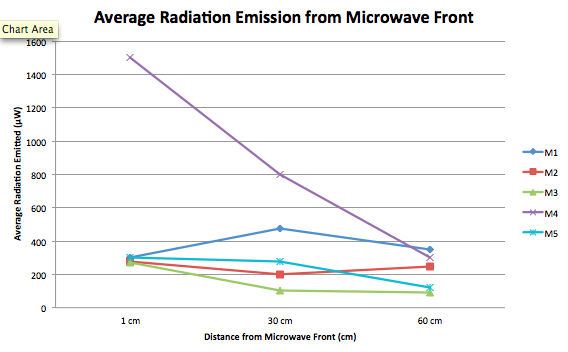
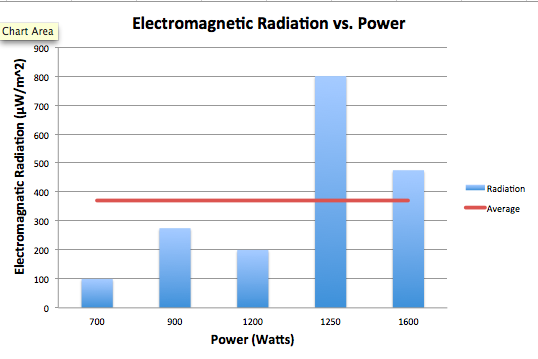
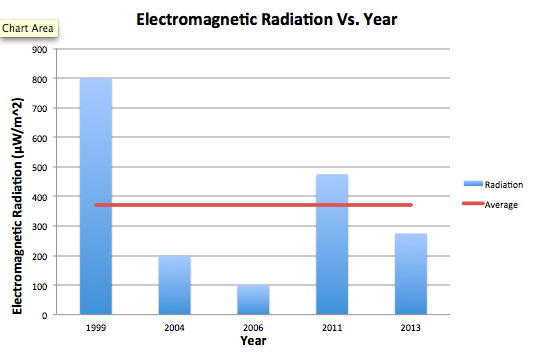
Overall, all microwaves measured emitted a fairly similar amount of radiation, ranging from the weakest emission at the furthest point from the microwave at 30 µW/m^2 to the strongest emission at the closest point to the microwave at 1,500 µW/m^2.  While the general trend seemed to be that radiation decreased as we moved further from the microwaves, not all cases followed this trend exactly.  To further understand factors that may have affected radiation, we compared radiation with 1) the power levels of microwaves and 2) the age of microwaves.  The following graphs show this comparison, with an added average line to see which microwaves fall below and above the average.  The graphs plot the Average values from the front at 30 cm.  We chose this orientation and distance because we felt it is the most practical in reference to where a person would be standing while microwaving food.  Furthermore, since some microwaves emit a relatively consistent amount of radiation regardless of distance from the microwave, and others taper off, we felt this represented a good middle ground.

i.  Microwave Age

It is certainly notable that the oldest microwave (M4) emitted by far the most amount of radiation.  However, as the years progress, the general trend after that case does not necessarily descend.  A microwave from 2011 also emitted a significant amount of radiation higher than the average.  It is also notable that when taking measurements of the 1999 microwave, the only industrial microwave in our sample, the radiation emitted seemed to appear in cycles.  It would drop down to zero, rise consistently, then fall back to zero.  This cycle made it difficult to choose an average from the reader, and also perhaps accounted for our perceived higher average radiation.  While microwaves may have become more advanced over the years, therefore emitting less radiation, we would need a larger sample and to keep power levels constant to test this hypothesis further.

Screen Shot 2014-02-27 at 12.19.41 AM

ii. Microwave Power

The association between power, in Watts, and electromagnetic radiation seems to be a positive one.  The microwaves that, on average, emitted the most radiation also were the highest in power, exceeding the average.  The microwaves that emitted radiation below the average were lower in power.  The exceedingly high spike in EM radiation in the 1250 Watt microwave may be influenced by other factors, considered in section i., but is significant nonetheless.  While again we would need a larger sample and more controlled conditions to test for a correlation between these two variables, there does seem to be a positive relationship. 
Screen Shot 2014-02-27 at 12.05.09 AM


IMG_3437 

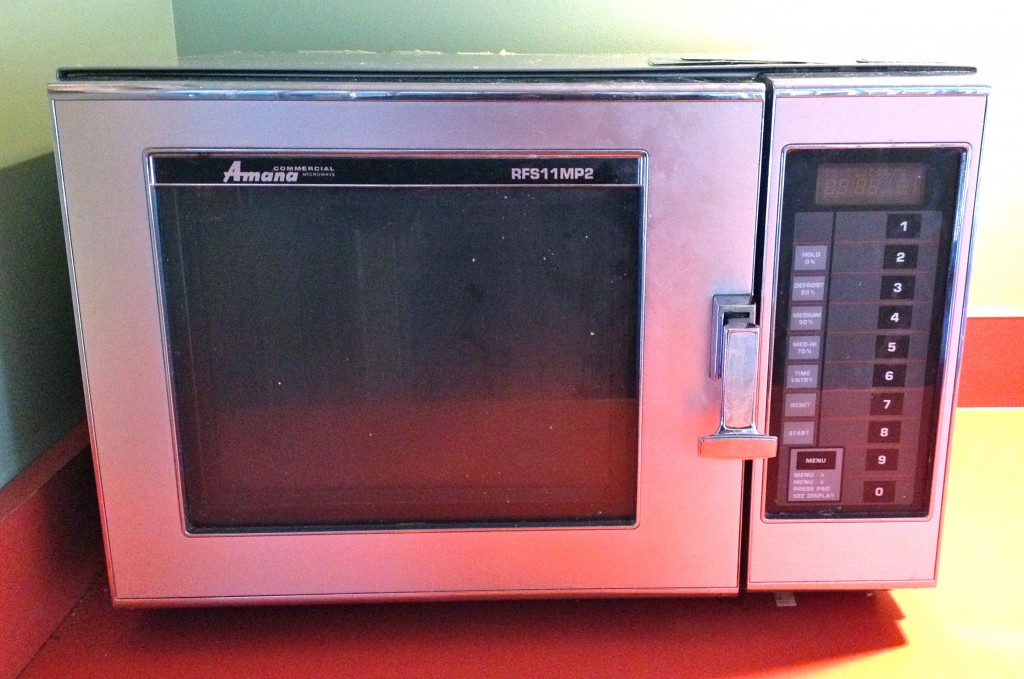
This microwave, M4, was the oldest microwave in our sample and also the only non-commercial microwave in our sample, as evident from its unconventional aesthetics.  While it emitted by far the highest amount of radiation, it provided an interesting case to investigate further.

B. Microwave Radiation and Safety Standards

The EM radiation data values were all significantly below the safety standards set for consumer microwaves.  (See Section II.)  Across variables of age, power output, wear and tear, and added interference, no microwaves at any point even exceeded half of the safety limit set by the United States Federal Food and Drug Administration.

C. RF Meter Findings

Through our data collecting process, we also went through trials and tribulations with the RF meter, an instrument used to measure EM radiation.  Since the manual was relatively vague, we performed a lot of trial and error to get the most accurate measurements possible.  We had a few helpful findings that may be helpful to individuals using this instrument moving forward.

First, we found it is necessary to take a preliminary measurement of EM radiation in the general vicinity of the appliance being measured.  This interference may account for unforeseen variance and unexpected values in a data set so it is good to know if it exists or not.  Furthermore, it is important to keep nearby cell phones and laptops off, as they can also interfere with these measurements.

Second, we found it more accurate, in our case, to measure from one axis rather than all three.  This limits interference from other directions, and therefore leads to a more accurate measurement of the appliance itself.

Finally, we found it important to use different settings of the RF meter to measure different values.  While we began measuring just on the “Maximum Average” setting, we soon realized that this was an unreliable measurement for getting a sense of the general radiation emitted.  Furthermore, the highest calculated “Maximum Average” value remains on the RF meter until a higher radiation is detected.  Therefore, if something interferes for even a second, its value will be displayed and remain displayed on the RF meter.  We decided that although this value is telling, we also needed a more reliable, general idea of emission.  We decided to use the “Average” setting for this, which averages the values every few seconds, and displays that reading.  Since the reading constantly changes, we watched the meter in pairs and decided a number that seemed to be a middle-ground of the readings we observed.  These settings are important to test and understand so that the operator is truly measuring what they are meaning to measure.

II. Results Analysis and Conclusions

The process of generating high levels of heat through the use of microwaves does mean that contact with human tissue and organs is potentially lethal. Despite this, there are few health risks posed by common consumer microwave ovens due to strict safety standards and efficient interlocking technology.

First, the International Electrotechnical Commission has set a standard of emission limit of 50 Watts per square meter at any point more than five centimeters from the oven surface. The United States Federal Food and Drug Administration has set stricter standards of 5 milliWatts per square centimeter at any point more than two inches from the surface. Most consumer microwaves report to meet these standards easily. Further, the dropoff in microwave radiation is significant with the FDA reporting “a measurement made 20 inches from an oven would be approximately one one-hundredth of the value measured at 2 inches.” As the majority of our readings, despite substantial electromagnetic interface at times, were in the microWatts range these standards appear to be successful.

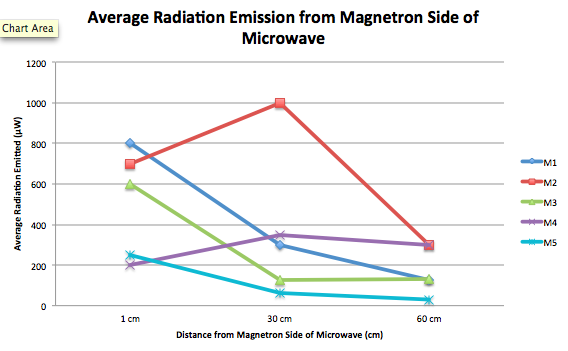
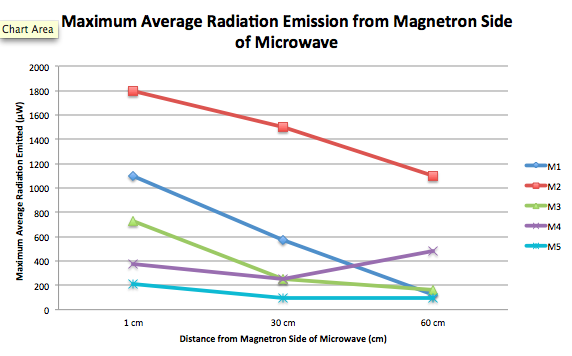
Second, microwaves use a two-step interlock system that ensures the magnetron cannot function while the door is open. This means little radiation leaks, and opening the door even when the oven is turned on will immediately shut off all microwave radiation emission. Our readings did suggest higher levels leaked from the right side of the oven (near the magnetron) than from the door, but these levels remained well below international standards.

Our results are not overly surprising as we entered the experiment recognizing the strict safety standards in place for microwave oven radiation levels. Thus, our data supports our hypothesis: standard consumer microwave ovens do not emit microwave radiation levels anywhere near levels needed to be dangerous to the user. While not all of our data is as logical, when graphed, as expected, we believe this to be a result of our imperfect data taking conditions and irregular interference levels. Should we continue to record data in more controlled conditions, we believe the outcomes would continue to adhere to safe standards.

III. What Science Did We Learn?

Microwaves are high frequency radio waves used for many purposes from television broadcasting to kitchen cooking. Microwave ovens are common household items that generate microwaves (around 2450 MHz) using a metal tube called a magnetron. These microwaves are directed into the oven cavity – a space of metal walls, roof, and ground with the exception of the oven door. Metal totally reflects microwaves, creating high bounce back in the oven, while glass and some plastic is nearly transparent to microwaves, allowing the waves to be readily absorbed into food (especially those largely water based). Microwaves force atoms to reverse polarity at high enough rates to generate heat and, thus, cook the food or boil the water.

While the radiation of microwaves can be dangerous, microwave ovens adhere to safety standards that prevent harm with proper use and maintenance (if an oven door is damaged, more radiation may leak out). While microwaves have been shown to break down key nutrients in some food, the process does not radiate the food or make it dangerous to eat, only less healthy.

IV. For the Future…

If we had to do this project again, we start by testing the RF meter and its functions before gathering data with it to gain a better understanding of its diverse (and sometimes unintuitive) settings (Max Avg vs Avg, etc etc). We collected some surprising data from the industrial microwave (M4) tested; the radiation levels fluctuated from almost nothing to nearly 2.5mW/m2 (Max Avg), which is a huge range! Perhaps this was partially caused by the base-level radiation (this was the only microwave whose surroundings had a measurable electromagnetic field without being on), perhaps we didn’t have a complete handle of the RF meter, or perhaps the microwave functioned in a different way from the others, sending out pulses instead of a steady stream of microwaves and so creating the oscillation in our readings. Should we do the project again, we would make sure we knew precisely how all data the RF meter takes is taken, and we would research further the different mechanics of microwaves to better explain surprising data such as this.

V. Next Steps

If we had to extend this project, we would test a wider variety of microwave models: it would be interesting to test the trend of microwave emission over the years, gathering data and testing a hypothesis concerning the technologic improvement being made in microwave development.  It would also be interesting to test industrial microwaves versus commercial microwaves, seeing as how M4 differed so greatly from the other microwaves.   We would also be sure to widen our sample selection to more reliably test some of the relationships we have preliminarily identified.  While the relationship between microwave power output and EM radiation seemed promising, we would need to test this hypothesis in a bigger sample, with more controlled conditions, to find a mathematical formula to describe this relationship.

Emma Foley; Hunter Furnish; Hannah Tobias
Group 8 Project Data: Microwave Radiation

EXPERIMENT SET-UP:

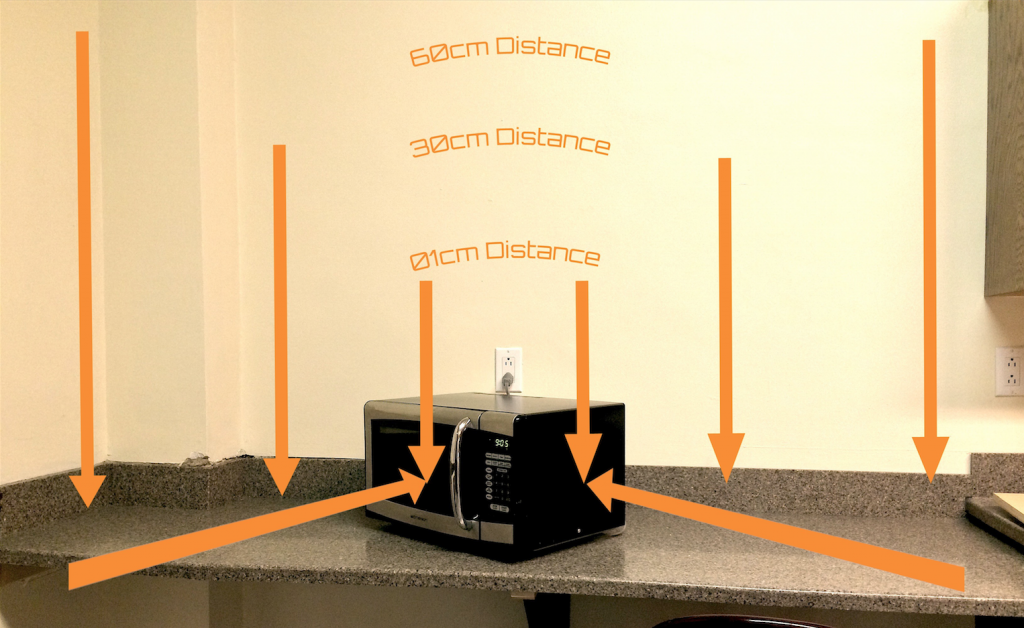
Readings were taken at three distances (1 cm, 30 cm, and 60 cm) from the microwave oven door as well as from the right side (magnetron) of the oven.

 ExpSetUp

TECHNOLOGY USED:

Our data was collected with entirely with an RF Meter: with it, we tested the EM field strength around different microwaves at various locations around campus. The only other technology used in this experiment were the microwaves tested, which were all of varying models and ages.

DATA COLLECTION OVERVIEW:

We collected our measurable data as a team, with all three people assessing the qualitative variables before beginning measurements, and then one person recording data, and two using the RF meter in conjunction with the microwave to collect data. We allowed the microwave for ~30 seconds before starting to collect data to make for a more consistent readings from each distance.  We first observed the average value at each distance.  This required us to be subjective–since the average value switched as the RF meter collected data, every second or so, two people observed the average values for about 10 seconds before deciding an approximation where most of the values fell.  We then switched to measuring the maximum average, a value that stood constant on the RF meter.  We repeated this process at each distance from the microwave.  We of course switched roles periodically in order to give each member of the group a better understanding of the overall process!

We got to this streamlined process through trial and error, and toggling with the RF meter, whose manual is not extremely comprehensive.  We had to test measuring from different axes and also realized that we needed to measure the radiation in the general vicinity of the microwave before we measured for microwave radiation, so that we had an idea of the baseline of EM fields in the area.  We also had to toggle with measuring values on different settings.  While we began measuring only maximum average, we realized this did not give a sufficient idea of the radiation emitted on average.  Furthermore, if the RF meter caught a signal from something like a cell phone receiving a text, that outlying measurement would appear on the meter rather than the measurement from the microwave.  We decided to use both average and maximum average measurements to get an idea of how much radiation was generally emitted, as well as how much could potentially be emitted.

We also collected data by researching the safety standards of microwaves.  This data will help us understand what our values mean during analysis/conclusions.  We found that the International Electrotechnical Commission has set a standard of emission limit of 50 Watts per square meter at any point more than five centimeters from the oven surface. The United States Federal Food and Drug Administration has set stricter standards of 5 milliWatts per square centimeter at any point more than two inches from the surface. Most consumer microwaves report to meet these standards easily. Further, the dropoff in microwave radiation is significant with the FDA reporting “a measurement made 20 inches from an oven would be approximately one one-hundredth of the value measured at 2 inches.”

DATA COLLECTING CONDITIONS:

The conditions under which our data was collected were simply the conditions of the microwaves habitats: some were found in secluded kitchens without much EM feedback from its surroundings (before testing each microwave we made a note of the general, ground-level EM reading in the vicinity so we could adjust and compare microwaves after taking that initial radiation into account), and others were found in areas where wi-fi signals and cell phone usage really bumped up the ground-level readings, and requiring us to adjust how we understood the data accordingly,

UNITS:

  1. Distance from the microwave (cm.)
  2. Power of Microwave, found on microwave label (Watts)
  3. Radiation (µW/m^2)

DATA TABLES:

1) Preliminary Observations

Sample #

Location

Brand

Wear and Tear, Year?

Radiation Off

M1

Strong Kitchen

GE

MSES1139BC03

June 2011

No major wear and tear

AVG: 0.00

MAX AVG: 0.00

M2

Retreat

LG Orbit

LRM1230W

December 2004

In good shape

AVG: 0.00

MAX AVG: 0.00

*but when measuring not on avg., values did appear

M3

Noyes Dorm Room

Microfridge with Safe Plug

N060203077

February 2006

Squeaky noises

AVG: 0.00

MAX AVG: 0.00

M4

UpC

Amana Commercial Microwave

RFS11MP2

February 1999

AVG: 17.7 µW/m^2

MAX AVG: 18.4 µW/m^2

M5

South Commons Senior Housing

Emerson MW8999SB

March 2013

New condition

AVG: 0.00

MAX AVG: 0.00

2) Average EM Radiation Values

Sample #

Power (Watts)

EM Radiation from Front (1 cm)

EM Radiation from Front (30 cm)

EM Radiation from Front (60 cm)

EM Radiation from Magnetron (1 cm)

EM Radiation from Magnetron (30 cm)

EM Radiation from Magnetron (60 cm)

M1

1,600 W

300 µW/m^2

475 µW/m^2

350 µW/m^2

800 µW/m^2

300 µW/m^2

125 µW/m^2

M2

1,200 W

275 µW/m^2

200 µW/m^2

250 µW/m^2

700 µW/m^2

1.00 mW/m^2

300 µW/m^2

M3

700 W

270 µW/m^2

100 µW/m^2

90 µW/m^2

600 µW/m^2

125 µW/m^2

130 µW/m^2

M4

1,250 W

1.5 mW/m^2

800 µW/m^2

300 µW/m^2

200 µW/m^2

350 µW/m^2

300 µW/m^2

M5

900 W

300 µW/m^2

275 µW/m^2

120 µW/m^2

250 µW/m^2

80 µW/m^2

30 µW/m^2

3) Maximum Average EM Radiation

Sample #

Power (Watts)

EM Radiation from Front (1 cm)

EM Radiation from Front (30 cm)

EM Radiation from Front (60 cm)

EM Radiation from Magnetron (1 cm)

EM Radiation from Magnetron (30 cm)

EM Radiation from Magnetron (60 cm)

M1

1,600 W

628.3 µW/m^2

662.5 µW/m^2

508.8 µW/m^2

1.1 mW/m^2

571.3 µW/m^2

123.4 µW/m^2

M2

1,200 W

1.2 mW/m^2

282.9 µW/m^2

482.9 µW/m^2

1.8 mW/m^2

1.5 mW/m^2

1.1 mW/m^2

M3

700 W

457.7 µW/m^2

182.2 µW/m^2

169.1 µW/m^2

726.3 µW/m^2

252.2 µW/m^2

162.4 µW/m^2

M4

1,250 W

2.5 mW/m^2

1.7 mW/m^2

1.6 mW/m^2

372.0 µW/m^2

250.0 µW/m^2

477.9 µW/m^2

M5

900 W

798.2 µW/m^2

488.8 µW/m^2

149.6 µW/m^2

209.4 µW/m^2

92.3 µW/m^2

97.9 µW/m^2

DATA GRAPHS

1) Average Radiation from Front

Screen Shot 2014-02-17 at 9.35.17 PM

2) Average Radiation from Magnetron

Screen Shot 2014-02-17 at 9.35.06 PM

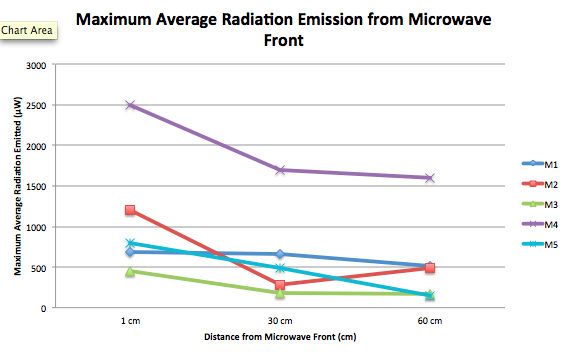
3) Maximum Average Radiation from Front

Screen Shot 2014-02-17 at 9.34.50 PM

4) Maximum Average Radiation from Magnetron

Screen Shot 2014-02-17 at 9.34.35 PM


Emma Foley; Hunter Furnish; Hannah Tobias
Group 8 Project Plan

Group Roles: In order to effectively collect and analyze data while ensuring that each group member is a part of each step of the process.

Data Collecting: Data Recorder – Hannah; Data Collector 1 – Hunter; Data Collector 2 – Emma

Analyzing/Synthesis: Comparing Differences in Radiation – Hannah; Comparing Radiation to Power – Emma; Research on Safety of Radiation Levels – Hunter

Equipment Used: RF Meter (to test EM field strength around the microwaves at various locations), WattsApp (to measure the microwaves’ power), ~9 microwaves (of various models, ages, and conditions), TI-30X Calculator, Pencils, Notebooks

Science/Technology Involved: When the microwave is turned on, the magnetron, an electron tube in the upper part of the oven, generates microwaves to excite molecules and heat the food.  Despite protective measures to ensure as little radiation seeps through the microwave as possible, such as the metal behind the door and the metal walls meant to reflect the radiation, absorption and leakage occur nonetheless while the microwave is on.  These waves penetrate past the microwave, exciting molecules, to generate an electromagnetic field that emits some amount of radiation. The government has deemed this radiation safe to the human body based on the Specific Absorption Rate (SAR), the rate at which our bodies absorb energy, but others disagree that this exposure is dangerous nonetheless.

The Watts Up Pro meter will also provide us with the technology to measure the power (watts) that each microwave uses to function. With this data we can track correlations between power, and the strength of the generated EM fields.

“Microwave Ovens,” Federal Office of Public Health, 2009. http://www.bag.admin.ch/themen/strahlung/00053/00673/03752/index.html?lang=en

Activity Plan: We will measure the strength of the EM field while a microwave is on and compare how different microwaves emit more or less radiation.  Furthermore, we will test different sides and distances from a microwave to determine if the radiation is 1) stronger at a certain side of the microwave (in the front, or closer to the magnetron, for example) and 2) if the field drops off after a certain distance.

On Friday, February 7th, at 1:00 pm we will walk around to different dorms to determine the status of each microwave.  We predict many of them will be relatively the same model, but if some seem much older or have a lot of wear and tear (for example, the front screen has a hole in them) we will collect data on those individuals to see if there is a correlation between age/wear and tear and EM radiation.  We will also compare power output and radiation.  We will record the power output labeled on each microwave to do so.

We will collect our data on Saturday, February 8th at noon.  We would like to test different microwaves both provided by the college and those provided by MicroFridge.  We hope to test multiples of each brand to ensure our results are consistent. We will use an RF meter to measure the strength of the EM field and use the setting “Max Average” to get an average measurement over the course of a few seconds of radiation emission.  We will collect data in the following table:

Sample #

Location

Brand

Wear and Tear?

M1


M2


M3


M4


M5


M6


M7


M8


M9


Sample #

Power (Watts)

EM Radiation from Front

(1 cm)

EM Radiation from Front

(10 cm)

EM Radiation from Front

(20 cm)

EM Radiation from Right

(1 cm)

EM Radiation from Right

(10 cm)

EM Radiation from Right

(20 cm)

M1


M2


M3


M4


M5


M6


M7


M8


M9


After we have collected the data, we will compile research on various proposed safety levels of microwave radiation, and compare our findings.

Expected Outcomes: Our group expects to confirm the safety of standard consumer model microwaves in regards to the level of microwave radiation emitted. This is due to the rapid falloff in radiation over distance as well as the strict safety standards established by the FDA. The more interesting analysis will be any correlation between the level of radiation, power usage of the unit, and cost of the unit. We expect to find high power microwaves emit higher levels of radiation (though still at safe levels). While cheaper units may theoretically result in less safety precautions, FDA standards should prevent this at any noticeable level.

Emma Foley; Hunter Furnish; Hannah Tobias