Category Archives: Group 2

Group 2: Conclusions Lasers and Sound

Results:

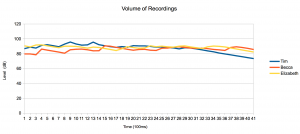
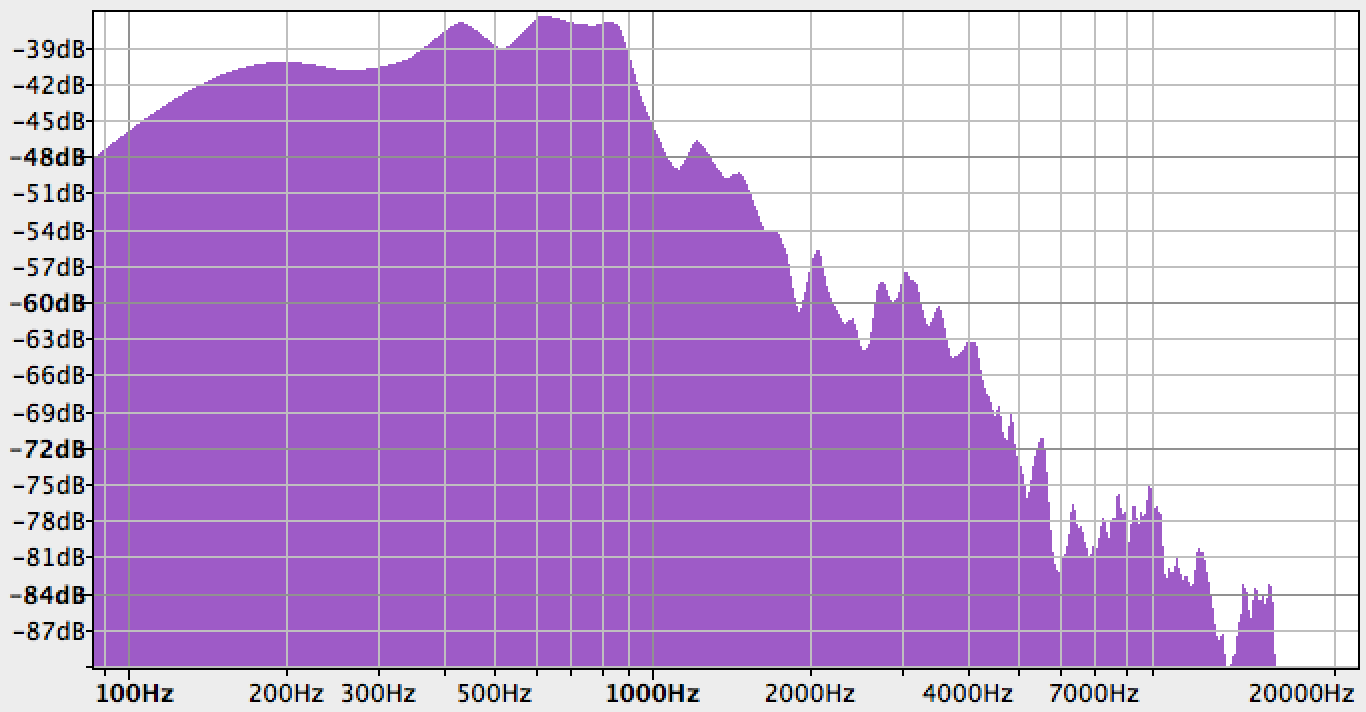
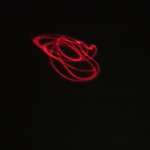
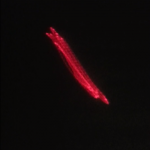
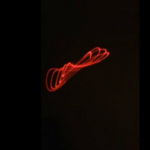
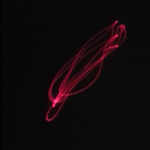
The results of our study are a collection of videos that documented the sound-designated laser patterns of two male and two female voices, as well as graphs depicting the decibel relationship to frequency of the sentences spoken. We also took screen shots of the laser patterns from each persons video of them saying the sentence “the quick brown fox jumps over the lazy dog” and charted them next to the individuals frequency/decibel graphs.

Additional Male-Voice Frequency Graph:

Frequency graph of Jared's voice

Frequency graph of Jared’s voice


Results Analysis:

The results show that male voices produce a larger laser pattern, one that affects the balloon-drum differently than the female voices; when comparing the videos/screenshots, the male voice patterns create bigger circles and squiggly patterns, when the female voices produce smaller figure 8s and tighter movement.

This difference may be explained by resonance modes. In short, when the balloon drum resonates with a certain frequency, it will oscillate/move more and with with a greater amplitude. When the male subjects spoke into the cup there were more vibrations/oscillations most likely because frequencies in a man’s voice are in resonance with the drum (stretched balloon). The human, and especially the male voice, has many undertones, and the drum vibrates more because of the increased number of resonant frequencies produced. This is why the male subjects created patterns covering larger surface area then the female subjects.

We did not have any specific predictions for male v. female voices in our project plan, but we expected that gender would affect the patterns differently. This expectation was confirmed by our results with the laser device. After running multiple tests with the laser device and analyzing the footage we decided that the differences were due to the differing frequencies present in lower, generally male, and higher, generally female, voices. The different frequencies produce different sound-waves which resonate uniquely with the drum and create different patterns. Although every voice regardless of gender creates a unique pattern, there are more similarities in the patterns between same gender voices than there are between genders.

Science Used:

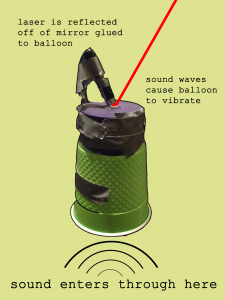
We used a device to map the vibrations from a human voice visually allowing us to study resonance modes/the analysis of sound waves using frequency and decibel. Using the Vernier LabQuest Pro Sound Level Meter we mapped the decibel levels of our voices. And using a program called Audacity we were able to graph the frequency alongside the decibel.

The science used during this project included: resonance modes, and the analysis of sound waves (frequency, decibel–how it’s measured).

In Hindsight: 

Some things we would do differently if we had to do the project again would be: change and experiment with the type of balloon used (ex. thicker v. thinner rubber) to find the most sensitive drum, and experiment with the types of cups used (paper, plastic, etc) to see the dampening effects the material may have on the sound waves.

Next Steps:

If we had six more weeks to continue the project, we would continue to take data from different male and female voices to get a better idea of the differences between the two; we would also vary the ages of the subjects to see if there is a difference in older v. younger voices; we would attempt to measure the different frequencies of music notes (through finding a musical apparatus/instrument or a singer that could produce specific pitches) to further examine the effects of specific frequencies and possible find the resonant one. It would also be interesting to try to discover and catalog what patterns individual notes make visually and then to see what happens when multiple notes are played at once, like in a chord or a song. Also to see how different a note looks across gender; would the same pitch look the same when sung by different people?


Group 2 Data: Lasers and Sound

For our project, we build a device to convert sound waves into patterns of laser light:

diagram

We recorded each member of the team saying a standard sentence into the device, and then took a video of the resulting pattern. We also took data regarding the volume (dB) and frequency (Hz) of each speaker.

Displayed here are three different voice recordings of one sentence, “the quick brown fox jumps over the lazy dog.” This sentence was chosen because it contains all the letters of the alphabet and would hopefully provide variation in the laser patterns produced. The patterns of one boy’s voice and two girls’ voices were measured. As seen in the video clips, deeper/lower voices/frequencies created a larger, circular laser pattern; higher pitched voices created a smaller ring-shaped pattern and also figure 8 shapes, as well.

Elizabeth’s Sentence:

Tim’s Sentence:

Becca’s Sentence:

The length of the sentence was about four seconds. The data recorded includes the video of the laser patterns, the audio recording, and the decibel recording, as well.

While further playing around with the device, we found that “P” noises (like the word “pop”) elicit a large circle, whistling into the cup and also playing music through an iPhone (classical and also bass/drum heavy) do not vibrate the balloon enough for much of a visible laser response.

Decibel levels of each speaker’s sentence:

db_graph

Frequency plot of Elizabeth’s voice:

freq_elizabeth


Frequency plot of Tim’s voice:

freq_tim


Frequency plot of Becca’s voice:

freq_becca


Looking at Tim’s frequency plot, there is a steep drop-off after 500Hz. This lines up with our observation that lower frequencies had more of an impact on the laser pattern, as his was much larger than the other two.

Decibel level did not have a discernible effect on the results. Much more important was the low frequencies.

We also recorded each member singing a set of three notes:

Elizabeth Singing:

Tim Singing:

Becca Singing:

Problems Encountered:

-The correct assembly of the device. For instance, less stretched balloon drum on top of the cup responded better to sounds. The application of the piece of mirror to the balloon drum was best executed using glue instead of tape, which buffered and absorbed some of the vibrations of the balloon, desensitizing the mirror and laser’s responses. The size of the mirror was also important–the heavier and larger the mirror piece, the less it would respond to vibrations. The material for the cup was also important and plastic works best (over paper). Mounting the laser onto the cup using a paperclip was best done by unfolding the clip to have two legs to tape to the cup, rather than one.

-The distance of the device and input source from the observation point, a black board. A distance of about 12.5 feet worked well for us; a longer distance increases the amount of the pattern seen.

-Playing music from a phone didn’t have enough low frequencies to move the laser a discernible amount.

Group 2 Project Plan

Roles: 

Rebecca Gluck, Tim Brown and Elizabeth Berridge will all take on equal roles in Data Collecting, Recording and Analyzing.
Data Collection of Human Voices: Rebecca Gluck
Data Collection of musical Instruments: Tim Brown, Elizabeth Berridge
Data Collection of Concerts: Rebecca Gluck, Tim Brown, Elizabeth Berridge
Data Recorders: Rebecca Gluck, Tim Brown, Elizabeth Berridge
Data Analysis/ Comparing differences in Human Voices/Instruments /Discerning Patterns in images from Concert: Rebecca Gluck, Tim Brown, Elizabeth Berridge
List of equipment and supplies: 
1. Device to view sound waves(plastic cup, balloon, duct tape, mirror shard, laser pointer, paper clip), 2. phone camera, 3. computer 4. Vernier LabQuest Pro Sound Level Meter
What is the science/technology involved?
We will use the device created with a plastic cup, balloon, duct tape, mirror shard, laser pointer, paper clip etc. to have a visual means of reviewing sound waves. The sound will enter the end of the plastic cup and vibrate the balloon stretched across the other end. Attached to the balloon will be a small shard of mirror which will vibrate with the balloon. A laser pointer will be reflecting off the mirror onto a flat surface (most likely a wall). The reflected light on the wall will move in correspondence with the vibrations caused by the sound waves entering the cup. Different sounds have different waves and will create different patterns. By analyzing the visuals we can discern differences in voices and instruments as well as recognize patterns between sounds and their sources.
We will also record the sounds that enter the cup using the Vernier LabQuest Pro Sound Level Meter, which will measure the frequency and decibel level to compare with the visuals and recognize patterns between the two types of data(visual and numerical).
Activity plan (how will you take your data, what equipment will you use). Include dates and meeting times.
We will take our data using the aforementioned devices. We will be meeting at 1 pm on sunday afternoons and begin by creating the two or three cup/balloon devices. Individually throughout the week and on sundays together we will collect data by having different people speak into the cup while one group member records the visuals and another records the numerical data with the Vernier LabQuest Pro Sound Level Meter. We will repeat this process with different subjects as well as with different instruments. Recording data from concerts will depend on when the next concert is scheduled, we will attend said concert and let the sound penetrate the device while recording the data.
What outcome(s)/data do you expect? Why?
We expect to have different data for every sound/voice/instrument because each sound uses a different frequency and therefor has a different wave length which will correspond to a different kind of pattern from the reflected laser pointer. We expect there will be a greater similarities between same sex voices versus opposite sex voices, most likely because of similar frequencies among same sex voices. We expect there will be erratic  numerical and visual data from a concert, as there will be a multitude of sounds and sound waves. We also expect to see data correspond between the visuals, and the numerical data taken with the Vernier LabQuest Pro Sound Level Meter. The patterns that are projected will no doubt change based on the sound wave length and hopefully with the numerical data we will be able to discern which frequencies/sound waves correspond with which patterns.

Group Two Project Abstract

Our group will be constructing a device to translate sound waves into a visual representation. The device consists of a cup with a balloon stretched over one end, with a laser pointing at a mirror taped onto the outside of the balloon. As sound waves enter one end of the cup, this causes the balloon to vibrate, and reflects the light respectively.

Each person will test the device on one of three categories of sounds: differences in human voices, musical instruments, and live concerts.  We will gather the decibel level of the sound waves to see what effect this has on the size of the laser projection. We will also be filming the resulting laser projections to compare the visual data.

We plan to meet on Sundays to take data and conduct specific experiments. In addition, we will attend live concerts on campus to gather this data. We expect to find distinct patterns relating to differences in sound type and origin. We also expect that the decibel level will correspond to the size of the visuals.