Group 4 Project Plan
Roles: –
Because there are only two of us, we will be collaborating throughout the entire project. We will be completing the data collection together, taking turns measuring and recording each appliance’s energy use and monthly cost. Post data collection, we will divide the recorded data evenly and calculate the cost of powering each of the appliances for an entire semester. We will also work together to complete the rest of the calculations, double checking each other’s work to ensure that any conclusions we end up with are supported by data that is as accurate as possible.
Together we will then analyze our data and see in what ways seniors can save costs by eliminating or limiting the use of certain appliances (such as toaster oven vs. microwave). We will then illustrate this in a simple energy saving plan/diagram.
List of equipment and supplies: –
Watts Up Pro
TH appliances (listed below)
Calculator
Vassar Expenses via Student Accounts
Pencil/Notepad
Microsoft Excel
Google
Science/technology: –
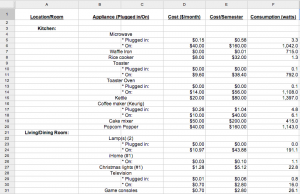
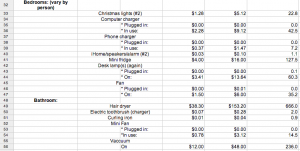
We will be using Watts Up? Pro to measure the monthly average cost (in $) and energy consumption (in watt hours) of each appliance typically found in a TH. We will then use Microsoft Excel to determine the total cost and energy consumption of these appliances over the course of a semester (four months). Due to the fact that some appliances remain plugged in at all times and yet are only “in use” occasionally (e.g. microwave, toaster, floor lamps, etc.), we will be taking two sets of measurements for each of these appliances: one with the appliance just plugged in, and one with it actually in use. We will then be determining about how long each of these appliances is actually in use (versus just plugged in) per day, and we will use this detailed information to calculate a more accurate monthly expenditure and energy consumption for the personal appliances in a Vassar TH.
Expectations: –
We expect there to be a variety of ways that we as students can save costs and energy consumption. We expect that some appliances (such as microwaves and minifridges) will consume much more energy than others (and be more costly as a result), which can inform our decisions related to appliance use at Vassar as well as in the future when we will be paying our own electricity bills. In addition, we expect that Vassar students receive a pretty fair deal with regards to our flat rate housing costs as we would probably end up having to pay more if we payed for the specific amount of energy we consume each semester.
Activity plan: –
We will calculate the cost as well as the energy consumption (in watt hours) for all of the personal appliances (did not come with the TH) of one TH for a semester. The Watts Up? Pro will give us the monthly average cost (in $) of using each appliance, and we will multiply this number by 4 to figure out what it would cost to power each appliance for a semester (4 months).
We will meet at TH 108 on Friday, February 14 and together we will go from room to room and record the monthly cost as well as the energy consumption of each personal appliance in the room. We will exclude all appliances that are fixtures in every household such as the main refrigerator, the overhead light fixtures, the heating, and the stove/oven (including light & fan). Although we are aware that these appliances contribute to the overall energy consumption and expenses of each TH, we are considering them to be part of the fixed house expenses (such as rent and water) because they come with every house, and it is also not possible to use the Watts Up? Pro to get calculations for these appliances. Our goal is to focus on the total energy consumption and costs of the appliances that we, as Vassar students, bring in to the THs and for that reason we will only be calculating the electronics we bring. We will consider appliances such as the stove, refrigerator and overhead lighting, as well as the heat, a baseline in cost and energy consumption that should have little variability between houses.
Lastly, we will compile our data and organize it into a simple energy-saving diagram. This will display the relative costs and energy consumption of the appliances measured, informing readers of possible energy-saving and cost-saving techniques (substituting some appliances for other less costly ones) for the future.
List of appliances: –
Kitchen:
– Microwave
– Waffle Iron
– Rice cooker
– Toaster/ Toaster Oven
– Kettle
– Coffee maker (can vary)
– Cake mixer
– Blender
Living/Dining Room:
– Mini fridge(s)
– Lamp(s)
– Stereo
– Christmas lights
– Television
– Game consoles
Bedroom (5):
– Christmas lights
– Computer charger
– Tablet Charger
– Phone charger
– iHome/speakers/alarm
– Iron
– Mini fridge (again)
– Desk/floor lamp(s) (again)
– Fan
Bathroom (2):
– Hair dryer
– Electric toothbrush (charger)
– Curling iron
– Electric Razor


