Author Archives: nomolasky

Group 6 Results

For our project we attempted to compare three smart technologies, a smartphone, a tablet, and a macbook based on four criteria: battery life, issues with overheating, cost, and energy consumption. All criteria were tested in two ways, while the devices were using Netflix, and while they were on but not running any other processing devices. The results of each test are as follows:
Battery Life:
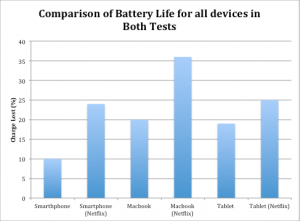
 Screen Shot 2014-02-26 at 11.54.20 PM
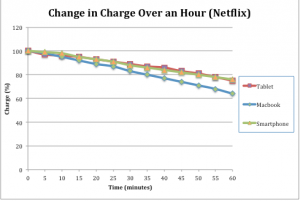
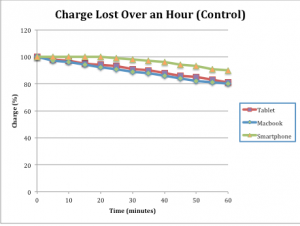
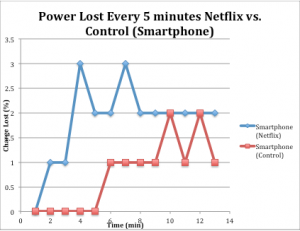
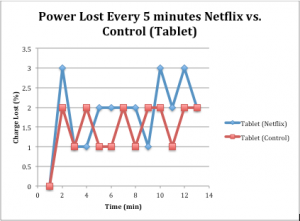
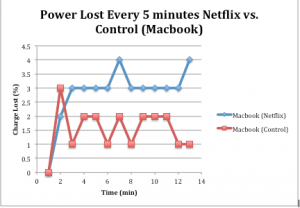
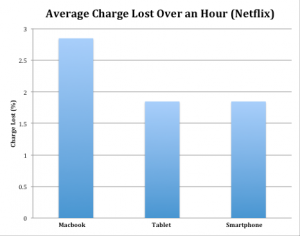
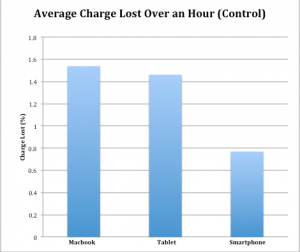
Here we have a graph comparing how much charge each device lost over an hour. In the control test the Macbook lost the most charge, and the smartphone lost the least. In the Netflix test group the Macbook lost the most charge and the smartphone lost the least. It is interesting to note the  difference in the control and Netflix test for all the devices, the graph shows a huge increase in loss of charge for all devices while watching Netflix when compared to the control group.
Issues with overheating:
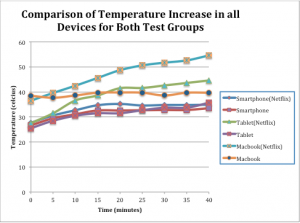
Screen Shot 2014-02-26 at 11.53.32 PM
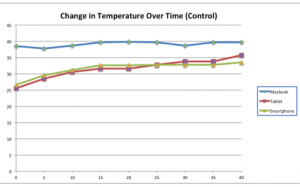
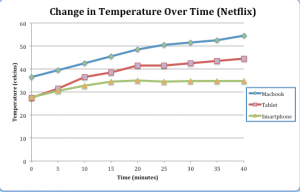
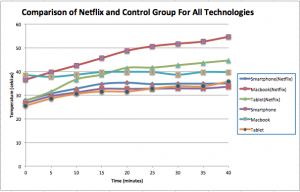
Here, we have a graph that tracks the increase in temperature over a period of 40 minutes, data was taken every five minutes. This graph illustrates how each device increased in temperature over time to some degree. It is interesting to see how, while watching Netflix all the devices’ temperatures increased more rapidly than while in the control test groups.
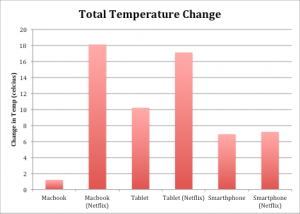
Screen Shot 2014-02-27 at 3.01.48 PM
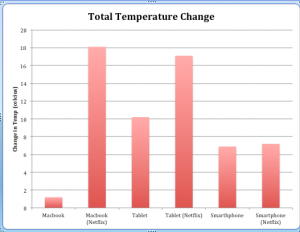
This graph is a comparison of the overall change in temperature for all of the devices. In the control group the Macbook’s temperature increased the least, and the tablet’s temperature increased the most. In the Netflix test the MacBooks’ temperature increased the most, and the smartphone’s temperature increased the least. Also, the tablet has the least amount of change between its temperature increase in the control and Netflix tests, and the macbook has the most amount of change between the two tests.
Cost:
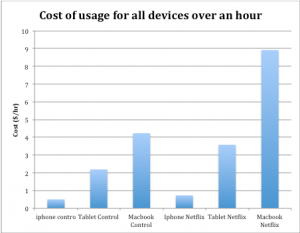
Screen Shot 2014-02-26 at 11.47.52 PM
This graph compares the amount of money it takes to run each device over an hour. For both tests the macbook costs the most to run, and the smartphone costs the least to run. More interestingly there is a huge increase in cost between the control and the Netflix groups. For all devices the cost of running while using Netflix for an hour was on average $2.103 dollars higher than the control group.
Energy Consumption:
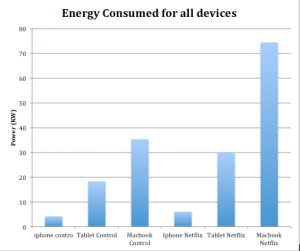
Screen Shot 2014-02-26 at 11.50.35 PM
This graph compares how much power each device used over an hour in Kilowatts. In both tests the iPhone used the least amount of energy, and the macbook used the most. There is an interesting increase in energy consumption for the devices while they use Netflix when compared to the control tests.
In order to understand what or results meant, we compared varying test groups to see if there
were any correlations that could me made between them.
Comparison of battery life and the change of temperature:
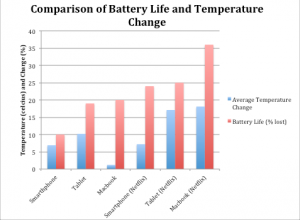
Screen Shot 2014-02-26 at 11.52.43 PM
The above graph is a comparison of the change in temperature and the loss of charge over an hour. When comparing the data (especially the smartphone and tablet) we saw that though there was a significant difference between how much each device increased in temperature, there was not a corresponding significant increase in loss of charge. This meant that there was not a correlation between the loss of charge and the increase temperature.
Comparison of the loss of charge and the energy consumed over an hour:
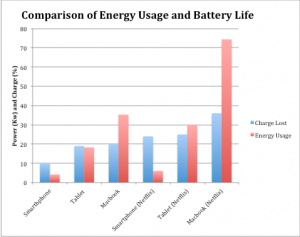
Screen Shot 2014-02-26 at 11.53.12 PM
The above graph is a comparison of the charge lost and the energy consumed over an hour for all devices. We noticed that since the energy consumed increased significantly when comparing all the devices, and the loss of charge did not increase significantly between all devices there is no correlation between the two.
Comparison of energy consumed and the change in temperature for all devices:
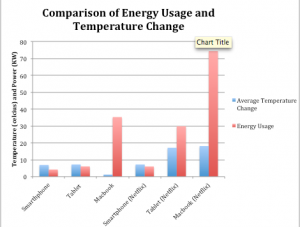
Screen Shot 2014-02-26 at 11.51.45 PM
The above graph is a comparison between the energy consumed and the change in temperature change. There is a noticeable correlation between the amount of energy consumed, and the increase in temperature. However, there is an outlier to this correlation – the macbook in the control group did not increase with energy consumption. This can be explained because, when running dormant, a macbook has temperature control software that prevents overheating.
Comparison of the energy consumed and the cost of the devices:
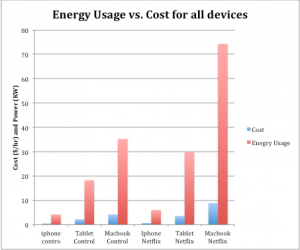
Screen Shot 2014-02-26 at 11.50.57 PM
The above graph shows that there is a correlation between the energy consumed and the cost of the device. As the energy consumed increases per device the cost of the device also increased.
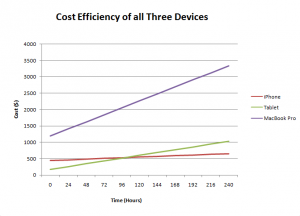
We also decided to analyze the cost of the device, when taking into account the down payment/data plan for each device. The most cost efficient device was calculated to be: iPhone
Were your results as expected?

We predicted that the MacBook Pro would use the most energy, followed by the tablet, followed by the smart phone. This prediction was accurate, in both the control tests and Netflix tests. This is due to the positive correlation between the size of the device/number of processes and energy consumption.

We expected the laptop to have the best battery life, followed by the tablet, then the phone. However, it turns out the smartphone lost the least amount of charge over an hour, followed by the tablet, followed by the laptop. Battery life is effected significantly by rate of energy consumption as well, and because the MacBook Pro consumes a very large amount of energy, it’s battery life is the worst of the devices tested. The iPhone, because it consumes very little energy, has the best battery life.

We expected the phone’s temperature to increase the most when using Netflix, followed by the tablet, then the laptop. However, the MacBook Pro’s temperature increased the most during the Netflix test, followed by the tablet, and then the smartphone. It is more resource intensive for a laptop to watch Netflix than a tablet or a phone, so it is understandable why the laptop would have the largest increase in temperature for the Netflix test.

We predicted that the tablet would be the most cost effective of these devices because the down cost of a MacBook Pro is quite high, and the cost of a phone plan is high as well. However, it turned out that the tablet uses so much more energy than the smart phone, that over time it becomes less cost efficient. These costs were obtained using the cost per hour of each device obtained from the Netflix test.

Graph
What science did you learn?
We learned how take measurements using an infrared temperature probe, and a Watts up Pro? How to take raw data and convert raw data and convert it into graphical form. Lastly, we learned
how to calculate the cost of a device using KWH (1 hour is equal to 12 cents).
What would you do differently if you had to do this project again?
Instead of using Netflix as a test, we would use a more resource intensive task that would provide more accurate data with regards to battery life and issues with overheating. We would also use devices from the same provider, (i.e. all windows product, all mac products, or all android products) this would provide for a more controlled experiment.
What would you do next if you had to continue this project for another 6 weeks?
We would continue our tests in the same manner as before, and compare the sound quality on each device, the screen clarity,the  ability to connect to wifi, and the amount of radiation that each device produces.
 

Group 6 Data

We performed tests to compare a smartphone, a laptop, and a tablet with one another. The smartphone used was an iPhone 4 running iPhone 5 software, the laptop used was a Macbook pro, and the tablet used was a nook running android software. We compared each device with regards to battery life, overheating issues, energy consumption, and cost efficiency.

Battery Life: This test was to see how much charge each device’s battery lost over the course of an hour. We tested the battery life of each device using a stopwatch and the device’s charge reading. Each device was tested while they were running Netflix (Netflix test group), and while they were on but not performing any additional tasks (Control test group). A reading of the battery’s remaining charge was taken every five minutes. All data readings were taken in percentage. After all data was collected we calculated the amount of charge the devices lost every five minutes respectively. We then took the average of the charge lost every five minutes to show the average charge lost every five minutes.

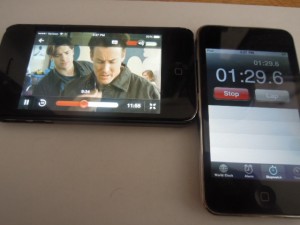
Test set up pictured below (Netflix):
DSCN4413

Loss of charge (Netflix):

Time (minutes) Macbook (%) Tablet (%) Smartphone(%)
0 100 100 100
5 98 97 99
10 95 96 98
15 92 95 95
20 89 93 93
25 87 91 91
30 83 89 88
35 80 87 86
40 77 86 84
45 74 83 82
50 71 81 80
55 68 78 78
60 64 75 76

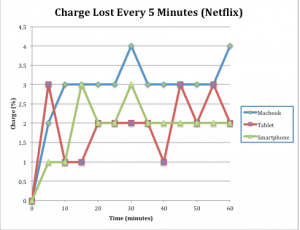
Charge lost every five minutes (Netflix):

Time (minutes) Macbook (%) Tablet (%) Smartphone (%)
0 0 0 0
5 2 3 1
10 3 1 1
15 3 1 3
20 3 2 2
25 3 2 2
30 4 2 3
35 3 2 2
40 3 1 2
45 3 3 2
50 3 2 2
55 3 3 2
60 4 2 2
Average: 2.846153846 1.846153846 1.846153846

Loss of charge (Control):

Time (minutes)  Macbook (%) Tablet (%) Smartphone (%)
0 100 100 100
5 97 98 100
10 96 97 100
15 94 95 100
20 92 94 100
25 91 93 99
30 89 91 98
35 88 90 97
40 86 88 96
45 84 86 94
50 82 85 93
55 81 83 91
60 80 81 90

Charge lost every five minutes (Control):

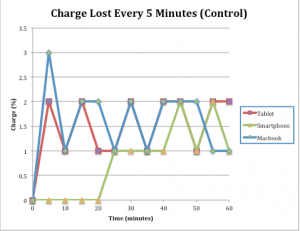
 Time (minutes) Macbook (%) Tablet (%) Smartphone (%)
0 0 0 0
5 3 2 0
10 1 1 0
15 2 2 0
20 2 1 0
25 1 1 1
30 2 2 1
35 1 1 1
40 2 2 1
45 2 2 2
50 2 1 1
55 1 2 2
60 1 2 1
Average 1.538461538 1.461538462 0.769230769

We then took this data and graphed it to compare the devices and the test groups:

Comparison of the charge lost over an hour in all three devices (Netflix):
Screen Shot 2014-02-20 at 4.47.14 PM

Comparison of the charge lost over an hour in all three devices (Control):
Screen Shot 2014-02-20 at 4.51.47 PM

Comparison of the loss in charge every five minutes for all devices (Netflix):
Screen Shot 2014-02-20 at 4.47.55 PM

Comparison of the loss in charge every five minutes for all devices (Control):
Screen Shot 2014-02-20 at 4.51.21 PM

Comparison of the charge lost every five minutes for the Netflix group and the Control group (Smartphone):
Screen Shot 2014-02-20 at 5.04.56 PM

Comparison of the charge lost every five minutes for the Netflix group and the Control group (Tablet):
Screen Shot 2014-02-20 at 5.03.54 PM

Comparison of the charge lost every five minutes for the Netflix group and the Control group (Macbook):
Screen Shot 2014-02-20 at 5.04.07 PM

Average Charge Lost every 5 minutes for all devices (Netflix):
Screen Shot 2014-02-20 at 4.50.10 PM

Average charge lost every five minutes (Control):
Screen Shot 2014-02-20 at 4.50.54 PM

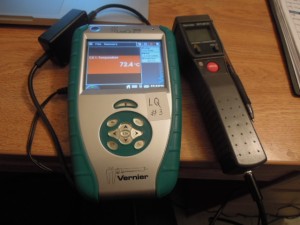
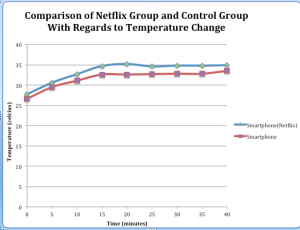
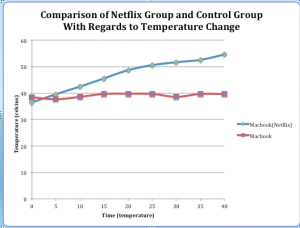
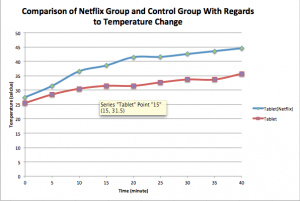
Temperature Change: We recorded the temperature change in all three devices using an Infrared temperature probe. We used this probe in two tests: a control test where the devices were on, but not performing any additional tasks, and a Netflix test where the devices were running Netflix.  A temperature reading was taken every five minutes, and each trial lasted 40 minutes. The probe was placed at the same spot on the device for every reading, the placement of the device was determined prior to testing using the infrared temperature probe to find the hottest spot on the device. After each trial we calculated the overall change in temperature by subtracting the final temperature reading from the initial reading. All temperature data was taken in degrees celsius.

Infrared temperature probe pictured below:
DSCN4402

Change in Temperature (Netflix):

Time (min) Macbook Temp (°C)
Tablet Temp (°C)
Smartphone Temp (°C)
0 36.5 27.5 27.7
5 39.6 31.5 30.6
10 42.5 36.6 32.7
15 45.6 38.6 34.7
20 48.7 41.5 35.2
25 50.6 41.6 34.6
30 51.7 42.6 34.8
35 52.6 43.6 34.8
40 54.6 44.6 34.9
Overall Change 18.1 17.1 7.2

Change in Temperature (Control):

Time (min) Macbook Temp (°C)
Tablet Temp (°C)
Smartphone Temp (°C)
0 38.5 25.5 26.6
5 37.7 28.5 29.5
10 38.6 30.5 31.1
15 39.7 31.5 32.6
20 39.8 31.5 32.6
25 39.7 32.7 32.7
30 38.6 33.7 32.8
35 39.7 33.7 32.8
40 39.7 35.7 33.5
Overall Change: 1.2 10.2 6.9

We then took this data and graphed it to compare the differences in all of the test groups:

Comparison of all three devices in the Control group:
Screen Shot 2014-02-18 at 10.53.23 PM

Comparison of all three devices in the Netflix group:
Screen Shot 2014-02-18 at 11.12.12 PM

Comparison of the temperature change between the Netflix group and the Control group (Smartphone): 
Screen Shot 2014-02-18 at 11.08.35 PM

Comparison of the temperature change between the Netflix group and the Control group (Macbook): 
Screen Shot 2014-02-18 at 11.07.16 PM

Comparison of the temperature change between the Netflix group and the Control group (Tablet):
Screen Shot 2014-02-18 at 10.56.05 PM

Comparison of the difference in temperature between all three technologies in both the Control and the Netflix test groups:
Screen Shot 2014-02-18 at 10.56.21 PM

Comparison of all the devices with regards to the overall temperature change (Netflix and Control):
Screen Shot 2014-02-18 at 11.06.43 PM

Energy Consumption: We recorded how much power (in watts) each of these devices uses in an hour while idling (control) and while watching a film on Netflix. This was done using a Watts Up Pro and Logger Pro software. First, each device was fully charged, then the control test was done. In the control test, each device’s power consumption was measured while their displays were left on. Afterwards, still with a full charge, the Netflix test was done. Both tests measured the wattage of each device for 30 minutes. The Watts Up Pro took real time measurements of energy consumption and Logger Pro graphed these measurements. The overall wattage used by each device was obtained by taking the integral of each graph in Logger Pro.
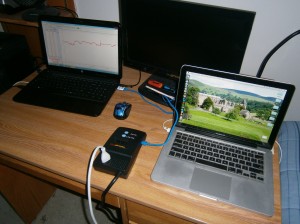
OLYMPUS DIGITAL CAMERAWatts Up Pro setup shown above.

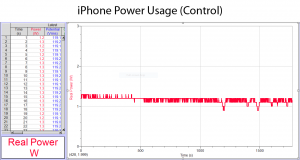
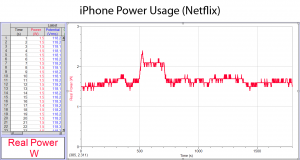
iPhone (Control) iPhone (Netflix)

The iPhone, while idling, used a total of 2,069 watts in 1,775 seconds, which is about 4,196 watts/hour. The iPhone, while watching a video on Netflix, used a total of 3,018 watts in 1,797 seconds, which is about 6,046 watts/hour.
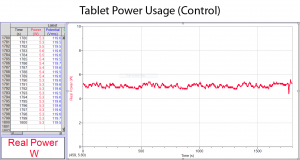
Tablet (Control) Tablet (Netflix)

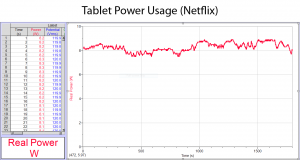
The tablet, while idling, used a total of 9,133 watts in 1,800 seconds, which is 18,266 watts/hour. The tablet, while watching a video on Netflix, used a total of 14,910 watts in 1,800 seconds, which is 29,820 watts/hour.
MacBook Pro (Control) MacBook Pro (Netflix)

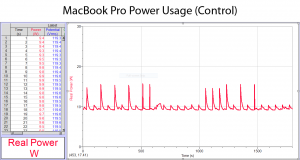
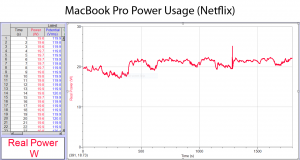
The MacBook Pro, while idling, used a total of 17,640 watts in 1,800 seconds, which is 35,280 watts/hour. The MacBook Pro, while watching a video on Netflix, used a total of 37,180 watts in 1,800 seconds, which is about 74,360 watts/hour.

Device Control Test (W) Netflix Test (W)
iPhone 4,196 6,046
Tablet 18,266 29,820
MacBook Pro 35,280 74,360

Cost Effectiveness: By converting each of these power consumption values to kilowatt hours, we determined the cost to run each of these devices for an hour while both idling and watching Netflix. The average cost of a kilowatt hour in the United States is 12 cents.

iPhone (Control): 2069 W / 1775 s = 2.069 kW / 0.493055555 h = 4.1963 kW/h

4.1963 (12) = 50.3556 cents ($0.50 per hour)

iPhone (Netflix): 3018 W / 1797 s = 3.018 kW / 0.499166666 h = 6.0461 kW/h

6.0461 (12) = 72.5532 cents ($0.73 per hour)

Tablet (Control): 9133 W / 1800 s = 9.133 kW / 0.5 h = 18.266 kW/h

18.266 (12) = 218.712 cents ($2.19 per hour)

Tablet (Netflix): 14910 W / 1800 s = 14.910 kW / 0.5 h = 29.82 kW/h

29.82 (12) = 357.84 cents ($3.58 per hour)

MacBook Pro (Control): 17640 W / 1800 s = 17.640 kW / 0.5 h = 35.28 kW/h

35.28 (12) = 423.36 cents ($4.23 per hour)

MacBook Pro (Netflix): 37180 W / 1800 s = 37.180 kW / 0.5 h = 74.36 kW/h

74.36 (12) = 892.32 ($8.92 per hour)

Device Control Test ($/hour) Netflix Test ($/hour)
iPhone 0.50 0.73
Tablet 2.19 3.58
MacBook Pro 4.23 8.9

Group 6 Project Plan: A comparison of Smart Technologies

  • Project Goal: The goal of this project is to determine which of the three smart technologies we are testing is the best with regards to overheating, cost effectiveness, energy consumption, and battery life.
  • Roles: We are splitting the test and the resulting analysis equally. Ryan will conduct the tests/analysis regarding cost effectiveness and energy consumption. Nora will conduct the tests/analysis regarding battery life and overheating.
  • Equipment/Supplies: Our experiments will require the following materials: 1. A Watts Up? Pro 2. A temperature probe 3. An infrared temperature probe (if available) 4. Duct tape 5. A stopwatch 6. A Nook HD+ tablet 7. An HTC smartphone 8. A Macbook Pro laptop
  • Science/Technology Involved: We are using a Watts Up? Pro to test both the energy consumption levels of each device and the cost efficiency of each device. A Watts Up? Pro measures the amount of electricity being consumed by a device in real time, it can measure this in both Watts and KWH.  We are also planning on using a Vernier temperature probe and an infrared temperature sensor (if available). The Vernier temperature probe will be duct taped to the back of each device to read temperature increases. The infrared sensor works by reading the black-body radiation (energy) emitted by the device and converting it into a temperature. The infrared temperature probe would be more affective because it does not require contact with the device to measure an increase in temperature. The three devices we are testing are an HTC evo 3D smartphone, a Nook HD+ tablet running Android 4.1 software, and a Macbook Pro Laptop running Mac 0SX version 10.7.
  • Activity Plan: Overheating Test: To test the severity to which each device overheats we will open up Netflix on each device (each device will be tested individually for more accurate data). We will make sure that there are no background programs running on the devices while Netflix is playing. We will choose a show that is either an hour or 30 minutes long depending on the time it takes for the first device’s temp to increase by approximately 10 degrees. At the start of the show we will begin taking the temp, this reading will be at t=0, after every 5 minutes we will record the temperature reading. We will run 2 trials for each device using both a Vernier temp probe and an infrared temperature probe. After all data is collected we will graph temperature versus time and compare the results accordingly. Battery life test: First, after fully charging it, we will turn on the device. As soon as the device  powers on fully we will start a stopwatch. We will record how long it takes for the battery to use up 20%, 40%, 60%, 80%, and finally 100% of its charge. Repeat the test now using Netflix while conducting the test recording how long it takes for the battery to run out of charge. Once all data is recorded we will graph loss of charge versus time and compare the results. Energy Consumption: We will be using the Watts Up Pro to measure how much energy, in watts, each device uses in an hour. We will have each device play a video on Netflix to use up energy. After recording the wattage each device uses, we will import the data from the Watts Up Pro into Logger Pro to get a graph of energy used over time. Cost Effectiveness: Once we determine the energy consumption for each device, will we find the kilowatts used per hour of all three devices. Knowing the price per kilowatt hour, we can convert these numbers into a cost. Taking into account things like the down payment costs of each device and how much a phone plan costs, we can determine which device gives you the most for its cost.
  • Meeting Times: We will meet three times a week. Thursdays at 5:00 pm, and then on Saturdays and Sundays at noon.
  • Expected Data/Outcomes: We expect that with regards to energy consumption the Mac laptop will use the most energy because it has the largest processing system out of the three devices tested. The tablet will follow the laptop in energy consumption, and the phone will use the least amount of energy. With regards to cost effectiveness we expect that the tablet will be the most cost effective because it costs less than a laptop and, though it probably uses more energy, it does not have the cell phone/data plan that a smartphone has. We expect that the laptop will have the best battery life, because it has the biggest battery and therefore has more energy to consume than both the tablet and the smart phone. The tablet will probably have the second best battery life, and the phone will probably have the worst. Once again, this hypothesis is based off the difference in battery size and the fact that battery life is most likely directly proportional to energy consumption. Lastly, with regard to temperature data, we expect that the phone’s temperature will increase the most when using Netflix, then the tablet, and then the laptop. This is because the phone has the smallest processor so using Netflix will be the most taxing to this device.