Category Archives: Advanced EM

Advanced Electromagentism (Phys 341)

Magnetic Field Conclusions

When I started this project I initially had the intention to model the magnetic fields due to a cylinder, bar magnet, and sphere. Little did I realize that while I knew that these fields should look like theoretically, modelling them would  have been a great undertaking. The fields due to a bar magnet is that of a magnetic dipole and that in itself seemed as though it would have been a project. The sphere could have been modeled in two different ways: as a rotating sphere of charge, or a collection of current-carrying loops. Both were very difficult to find the magnetic field for at any given point and so I was at a loss for things to model.

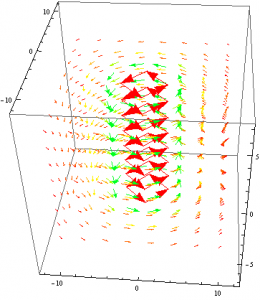
I was only able to successfully plot the magnetic field due to a line of charge rather than a cylinder since I was having trouble making Mathematica plot piecewise vector functions. The plot below was all that I had to work with.

1


After some discussion with Professor Magnes, I decided I would take what I had, and make more complicated systems with it.

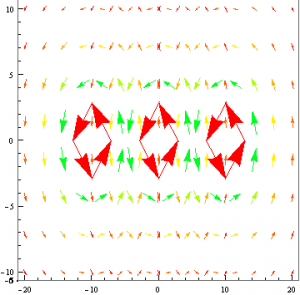
As seen in my previous Final Data post, I was able to show that if identical current-carrying wires were aligned next to each other, their resulting magnetic field would resemble that of the field due to a plane of current as the distance between them decreases. 

6

The only problem I faced was that I could not find a way to superimpose the vector fields from my aligned wires. While this would have made my model look nicer, it is still relatively clear to understand how the field lines add together.

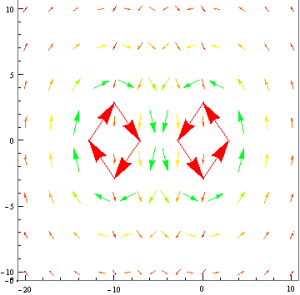
Next I decided I would use the same method that I used to mimic a plane of current and attempt to model a magnetic dipole. Rather than placing two identical current-carrying wires next to each other, I made one of them have a negative current. I would then plot their resulting vector fields and change the viewpoint such that only the x,y plane was seen.

7

Again I was faced with the issue of superimposing my two vector fields. However, I suspect that if I found a function Mathematica that would do this for me, I would have indeed modeled a magnetic dipole.

While the topic of my project was by no means a very complicated one, it would be false to say that I did not learn anything from it. My understanding of how Mathematica functions as a program has grown and I have come to appreciate its capabilities. I also learned that while something may seem simple at first in theory, it can be very complicated to achieve in reality.


Share

Conclusions: Capacitors

(Revised 5/7/14)

Initially, I intended to model capacitors of various shapes, including more realistic configurations like rolled-up plates or variable (i.e. adjustable) capacitors. Though these configurations were not ultimately simulated, the information gathered, looking only at square parallel plate capacitors, was illuminating, and the foundational programs I wrote could, with some manipulation, be extended to more complicated arrangements.

The method I ended up using, detailed extensively in the data post, was relatively efficient but still took a non-trivial amount of time (see below) to simulate the electric fields that dictate the properties of a capacitor. The size of grid I used (averaged over two grids: one with 211^2 = 44521 points, the other with 212^2 = 44944 points) was chosen so that the simulated electric fields were at least 99.9% accurate over the distances examined and so that the simulations took no more than 10 minutes each to run (6 plate simulations were run in total, resulting in an hour of pure computation; note that by taking advantage of plate symmetry, this was actually 1/4 the time one might have expected, as it took about 2.4 seconds to find the E-field at any point).

Accuracy of the method at calculating the E-field was checked at a few points against the computationally inefficient but presumably 100% accurate theoretical model, which is based on fundamental physics (integral Coulomb’s law). This method took up to 10 minutes to calculate the E-field at an arbitrary point near the capacitor, though it was much faster far away from the capacitor (where we are naturally not interested).

Splitting a shape into thousands of manageable quantized points charges (each producing a field in accordance with Coulomb’s law for point charges) proved to be an effective tool, even for the relative simple square plates studied here. This method could be expanded in the future to much more complicated surfaces or even volumes to accurately model the electric field of complex shapes that would otherwise be hopeless to analyze analytically. Of course, a real charged object is charged with a finite number of charge carriers, so this method is not physically unsound (on the other hand, a plate charged to 10^-6 C like mine would need 6.25 x 10^12 electrons spread over it rather than a mere 44,000)

It should be noted that I did not examine the effects of dielectrics placed between plates. Though this was originally planned, I omitted doing this not out of time constraints, but rather because it would not have proved particularly illuminating. Linear dielectrics (the only kind extensively analyzed in 341) have very straightforward effects on energy storage and capacitance, which do not seem to depend on capacitor dimensions. Equation 4.58 and an unlabeled equation on page 197 make this clear (Griffiths, 4th ed.):

Overall, this project was an excellent exercise in computation and matrix manipulation (the data for the electric field at a set of points above a plate was stored in a 3 by 1024 matrix, for example). It was also very useful for practicing using approximation methods based on fundamental physics to solve an otherwise complicated problem. In the end, the ideal model of a capacitor was shown to be insufficient for extremely accurate capacitor parameters at all but the closets plate separations. Of course, real capacitors have by their design very close plates to maximize capacitance, so the choice of method depends on one’s needs and situation.

Perhaps the most useful “next step” would be to take the data for more plate separations and fit a curve to the points, resulting in a function for capacitance or energy as a function of plate separation. Based on the few points I took (see the animation), such a function is approximately a straight line for very small separations (i.e. the ideal approximation) but diminishes with distance like a square root function.

The code used to run these simulations could be expanded upon to use for visualizing electric or potential fields, or for any other application where an arbitrarily complicated electric field (or possibly a gravitational field) needs to be modeled. I tried to keep a neat, albeit very lengthy, notebook file, though I could have labeled my graphics and the computation times more clearly (I used the Timing function on almost every computation, but the way Mathematica returns the timing value is not extremely conspicuous).

Share

Conclusion- Modeling the E and B Fields of A Cylinder

In the beginning, I set out to model the electric and magnetic field of any objects shaped like a cylinder. I wanted to demonstrate the direction and intensity for a conductor, a dielectric, and a coil. I did not get to model the E and B fields for all those different types of cylindrical objects, however I developed a method for modeling on mathematica. With the “Help” tab I was able to model the direction and intensity for a conducting cylinder.

To find the electric field I chose to look at the E and B-fields of a long cylinder first, where this cylinder had a uniform charge density. Using Gauss’ Law I derived the E field (inside the long cylinder) and started looking at different functions on mathematica, to determine which one best demonstrated the direction and magnitude of the electric field. I first converted the coordinates from cylindrical to cartesian using the TransformedField function. After playing around with the VectorPlot and VectorPlot3D I was able to show (using the Show function) the electric field of a long cylinder. The E-field for the long cylinder, from my previous post, demonstrate the electric field within the long cylinder, where the electric field magnitude is directly proportional to the radius of the Gaussian cylinder. So, it makes sense that the arrows are getting thicker instead of shrinking in size.

To find the magnetic field I also chose the same long cylinder, only this time, with a uniform current distributed on the surface of the cylinder. With this induced current flowing in the negative X direction, into the screen, I used the right hand rule to find that the magnetic field is in the positive phi direction. Using Ampere’s Law I came up with the equation for both inside and outside of the cylinder. As you can see in my previous post, the B-field equals zero inside of the cylinder and the B-field outside is inversely proportional to the radius of the cylinder. This is so because all of the current is on the surface of the long cylinder and as you move further away from long cylinder the intensity decreases.

I then used the same procedures, kept the charge density for the E-Field and uniform current for the B-field the same. However, the equations are different now because of the parameters I placed on the finite cylinder. This cylinder has a length of 30cm with a radius of 10cm. After putting that into mathematica, similar results to the long cylinder were produced.

My main focus for this project was to learn how to use mathematica because deriving the E and B fields for a cylinder are things we learn in class. Mathematica is frustrating at first but after figuring out the proper functions I was able to model what we learn in class.


Share

Conclusion

While I have made a lot of progress since the start of this project, I am disappointed that I don’t have more time to work on it because I made so much progress right at the end, finally figuring out techniques that worked well in Mathematica.  If I had more time I would try to make some contours of multiple dipoles, and see how things cancel out.  Admittedly this would be a lot harder to picture the perpendicular field lines, and the 3D structure would probably become more necessary.  Its also possible that the contour technique I used here might not work well at all for multiple dipoles, but it would have been good to check it out a bit at least.

That being said, I did make some pretty cool 3D graphs of magnetic equipotential surfaces that scale as expected with current intensity.  The 2D case helped greatly to show how these contour surfaces represent the magnetic field in a general way, partly because of the greater number of contours that could be shown at once in a plot.  This 2D case is actually more helpful in my mind because the field of a single dipole is so symmetric in a lot of ways that 3D images actually just confuse the issue and get in the way of each other.  If I got the chance to model multiple dipoles, I likely would have tried to keep their dipole moments (vectors normal to the center of the current loops) in the same plane (xz most likely, for consistency).  This way, at least in some regions, the field would still be independent of $\phi$, and thus the analysis of such fields would be simpler.

The 3D graphical limitations of Mathematica could be seen on some of my contour plots, especially those with the current loop shown as well, where the surface disappeared around the xy plane.  I expect this is due to the near horizontal nature of the contour at this point, and the rendering issues that come into play when plotting such an extreme surface.  The limitations (or just my inability to utilize Mathematica to its full extent) of VectorPlot3D and similar functions are pretty obvious in my case as they didn’t work well at all for the vector functions that I was trying to plot.

Despite these limitations and my Mathematica difficulties, I think that I managed to convey a good amount of information about the fields (and the less generally useful equipotential surfaces) of a single magnetic dipole.  Hopefully I also laid the groundwork for students in this class in the future to work on modeling magnetic dipoles, specifically multiple dipoles in complex configurations.  I also learned a lot about the benefits, frustrations, and limitations that Mathematica brings to the table as a computational scientific tool.

Share

Conclusion: Corrections and Deconvolution

Update:

I concluded in my preliminary data post that the ‘Convolve’ function has its limitations and will not work properly with complicated functions. That may be so with relatively obscure functions, but I was wrong in my example. When I computed the convolution the long way by taking the Fourier transform of the product of Fourier transforms, I used the ‘FourierTransform’ function. I should have used the ‘InverseFourierTransform’ function instead. A Fourier transform of a Fourier transform is not necessarily the same as the inverse Fourier transform of a Fourier transform.

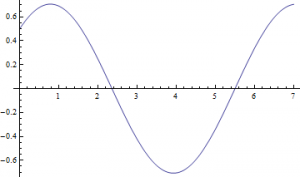
If f_1(x)=exp(-x)unitstep(x) \quad f_2(x)=cos(x), then through both methods I yield this plot:

Update

Mathematica file: https://vspace.vassar.edu/zerogoszinski/Update.nb

Vspace works better on Macs. If you are not using a Mac, please open the file from the Google Drive folder located at the end of this post. The file name is called ‘Update’.

Deconvolution:

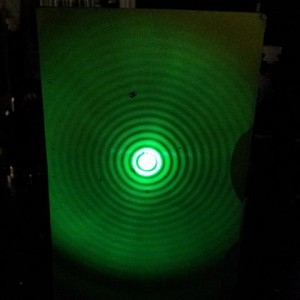
Convolution has applications in imaging, in that a blurry image is simply the convolution of the image and a lens or instrumental function. This function is also called ‘point-spread function’ (PSF). Convoluting two functions is simple since the individual functions are known. Deconvolution is the reverse process, in which you have a convolution and you want to extract the desired image. This requires an understanding of the blurring function, which requires understanding the system that is causing the distortion. Extracting the pure image is much more difficult since every blurring variable needs to be taken into account. A perfect PSF is impossible to determine, so accounting for this function requires good approximations (4). Deconvolution is very important in astronomy, since all data comes from optical based systems. Even a perfect lens convolutes images, as they have unique diffraction patterns. The best focused spot for a camera lens is called the Airy disk:

\theta=1.22f\lambda/d

f is the focal length, \lambda is the wavelength, and d is the diameter of the lens.

http://upload.wikimedia.org/wikipedia/commons/thumb/4/4b/Airy_disk_created_by_laser_beam_through_pinhole.jpg/480px-Airy_disk_created_by_laser_beam_through_pinhole.jpg

http://upload.wikimedia.org/wikipedia/commons/thumb/4/4b/Airy_disk_created_by_laser_beam_through_pinhole.jpg/480px-Airy_disk_created_by_laser_beam_through_pinhole.jpg


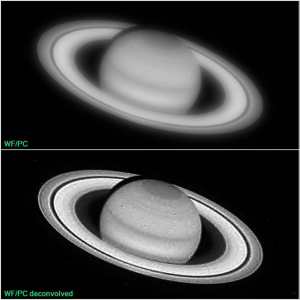
Here is an example of deconvolution in action:

http://opticalengineering.spiedigitallibrary.org/article.aspx?articleid=1183218

“Experience with the Hubble Space Telescope: 20 years of an archetype”
http://opticalengineering.spiedigitallibrary.org/article.aspx?articleid=1183218

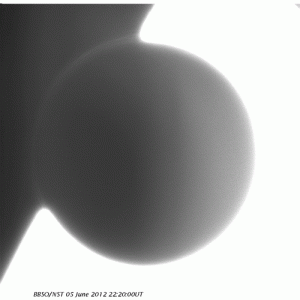
A particularly cool example of the effects of PSF in astronomy is the black-drop effect during the transit of Venus. The black-drop effect is an optical effect where the planet seems to stick to the edges of the star during ingress and pull apart like taffy as it enters the surface. Calculating the transit time would determine the orbital period of Venus. Kepler’s third law would then determine the radius of orbit. Astronomers of the 18th and 19th century wanted to figure this out in order to determine the actual size of the solar system. The black drop effect made it difficult to determine the exact moment Venus entered the Sun’s surface. The cause for this effect was discovered to be mostly due to PSF (Schneider, G., Pasachoff, J. M., Golub, L., 2004, Icarus, 168, 249). Poor optics creates this optical illusion, and accounting for point-spread function [and solar limb darkening] eliminates this effect.


Created by Zeeve Rogoszinski using data taken from Big Bear Solar Observatory.  http://imgur.com/p19moKI

Click to see the animation.
Created by Zeeve Rogoszinski using data taken from Big Bear Solar Observatory.
http://imgur.com/p19moKI

As you can see convolution and deconvolution have important applications in optics. Light beams get distorted as they pass through matter, and the scientist needs to be able to determine what exactly he or she is looking at. If I had the time I would have tried to deconvolute my convolution in the previous post, and try to extract one of the optical filters. I would have first assumed I knew what the second filter looked like, and try to work out the procedure from there. I would then assume I have no idea how the filters behave, and try to blindly deconvolute the filters. This would require looking into the theory behind deconvolution in a more rigorous manner.

Transit Paper:

http://web.williams.edu/Astronomy/eclipse/transits/Schneider_jmp_lg_Icarus2004.pdf

All of my data:

https://drive.google.com/folderview?id=0BxRRP3LUVuftVmFCcnNPMWFhU1k&usp=sharing

Share

Final Data

The next phase of my project involved actually creating some models of the magnetic field of a magnetic dipole.  This proved to require more steps and creativity than previously thought, but in the end I did get some useful plots.  The three finalized Mathematica files that I refer to throughout this post can be found via the link at the bottom of this post.

The first breakthrough I had was using a different technique to convert the expression for the magnetic field from spherical to cartesian coordinates so that Mathematica can plot some version of its information.  This technique worked way better than using Mathematica’s built in TransformedField function, which produced some weird results (see Preliminary Data post).  Instead, I decided, with the help of Shelly Johnson, to write out the explicit cartesian forms of $r$, $\theta$, and $\phi$ as well as the explicit spherical forms of $\hat{r}$ $\hat{\theta}$, and $\hat{\phi}$, and then let Mathematica substitute these expressions in the larger expression for the magnetic field.  This worked pretty well to give the three components of the magnetic field, $\vec{B_x}$, $\vec{B_y}$, and $\vec{B_z}$, as can be seen at the top of my Mathematica file titled “3D_vector_graphs.nb”.

When these expressions are plotted using VectorPlot3D, however, the results are pretty uninformative.
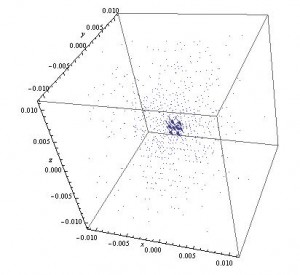
3D vector plot of the magnetic field of a magnetic dipole

3D vector plot of the magnetic field of a magnetic dipole

Even zoomed in and seen from a more right angle, this field is not helpful.
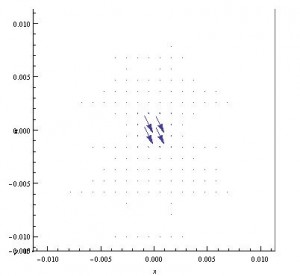
Same plot as above, but seen zoomed in and in the xz plane

Same plot as above, but seen zoomed in and in the xz plane

Since this approach didn’t work well, for reasons discussed more in my next Conclusion post, and my previous attempts at plotting the vector field at representative points was getting complicated as well, I decided to try to use this new transformation by substitution method to try Contour plots instead.

I began by forming one expression for the magnetic field value at points in space, with no vector information.  This expression ends up being pretty manageable, and the contours of this can be made effectively using ContourPlot3D.  Some different results are shown below, taken from my Mathematica file “3D_contour_graphs”.
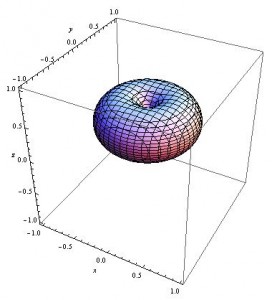
3Dcontour1simple

3D contour of my expression for the magnitude of the magnetic field of a magnetic dipole. This contour is for when the magnetic field equals 1
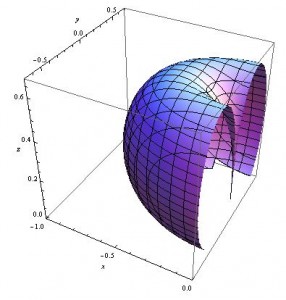
The same plot as above, but this time zoomed in and shown "cut in half" to see what happens on the inside of the symmetric circular outer portion

The same plot as above, but this time zoomed in and shown “cut in half” to see what happens on the inside of the symmetric circular outer portion

These results are pretty promising, so I then added in a few more contours, to see how the different values looked relative to one another.
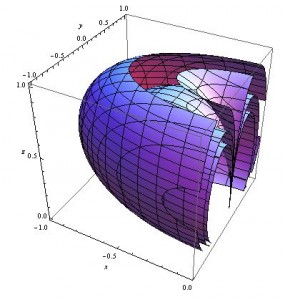
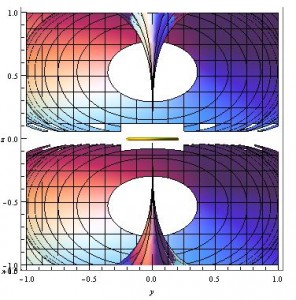
Similar plot to the above, but this time with three contours.  From the inner to outer contours, these surfaces represent the places where the magnitude of the magnetic field equals 0.75, 0.5, and 0.28 respectively.

Similar plot to the above, but this time with three contours. From the inner to outer contours, these surfaces represent the places where the magnitude of the magnetic field equals 0.75, 0.5, and 0.28 respectively.

This is pretty good, but where are these surfaces in relation to the small current loop that is supposed to be creating these magnetic field contours?  My next few contours include a small yellow ring at the origin, which indicates the placement of the loop, and also plots both positive and negative contours, which gives the whole picture both above and below the ring (which, looking at the original equation, should be symmetric).
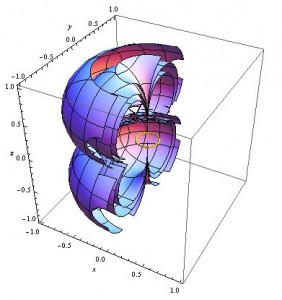
The same three contours as above, along with their negative counterparts, and a small yellow ring representing the current loop that creates the magnetic field modeled.
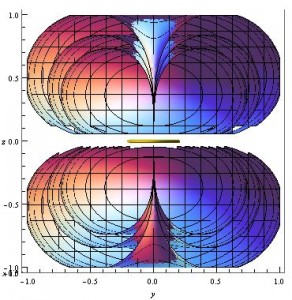
The same three contours as above, along with their negative counterparts, and a small yellow ring representing the current loop that creates the magnetic field modeled.

A different view of the above graph, which allows one to look into the part of the contour that has been "cut open".

A different view of the above graph, which allows one to look into the part of the contour that has been “cut open”.

Now that there is a current loop in our models, what happens when the current in this loop is increased?  The above models were made with a magnetic dipole moment, $m=1$, but the below image increased the current so that $m=2$.
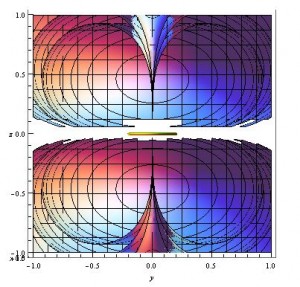
Similar plot to above, but with a stronger magnetic field (m=2).

Similar plot to above, but with a stronger magnetic field (m=2).

Putting images with $m=1$, $m=2$, and $m=3$ side by side shows that the same contours move farther away (and change curvature a bit) for models with larger values, which is expected because larger m values indicate larger magnetic fields.


A different view of the above graph, which allows one to look into the part of the contour that has been "cut open".Similar plot to above, but with a stronger magnetic field (m=2). 3dcontourmultiplebiggerB2                                              

From left to right, Contours with m = 1, m = 2, and m = 3.

This is all pretty good, but what are these contour surfaces actually telling us about the magnetic field?  These contour surfaces represent places where the magnitude of the magnetic field is at a constant value, so these shapes represent equipotential surfaces.  While equipotential surfaces are not often talked about when talking about magnetic fields, the general principle that field vectors are perpendicular to equipotential surfaces is true of magnetic fields as well as electric.  Therefore, these contours actually tell us something about the magnetic field of a dipole, albeit in an indirect manner.

To try and get a better picture of what the field lines look like around this current loop, I plotted these contour surfaces in 2D by removing any y dependence, so that the 2D contours plotted are shown in the xz plane.  This doesn’t lose much information again because of the $\phi$ independence of the magnetic field of a dipole.  The result is shown below, which is taken from my Mathematica file “2D_contour_graphs”.
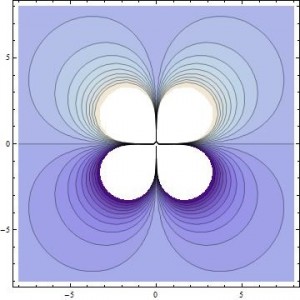
2D contour, showing 20 different contour lines, both positive and negative.

2D contour, showing 20 different contour lines, both positive and negative.

This gives us a representation where the vector field lines may be easier to picture, and easier to compare to the lines shown in Griffiths’ “Introduction to Electrodynamics” 5.4.3 – pg. 255, which are shown in 2D.  It took some squinting, but I can see that lines perpendicular to these (and more) contour lines forms loops expected of a magnetic dipole.  I overlaid a few representative loops over my 2D contour image in paint to illustrate this idea.
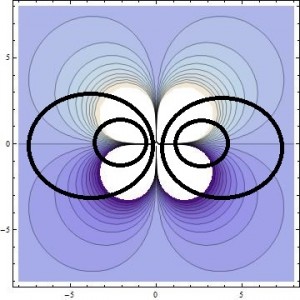
Same image as above, but with (approximate) magnetic field lines overlaid in thick black.

Same image as above, but with (approximate) magnetic field lines overlaid in thick black.

Link to final Mathematica files: 3 Final Mathematica Files
Share

Railgun Physics: Final Thoughts

Having completed this project I have several thoughts about what I did, what I could’ve done, and what I want to do in the future. This project taught me a lot about physics, a little about engineering, and a great deal about modeling and the work and mindset necessary to complete projects of this nature.


The physics I got to explore as part of this project was extraordinary. Before I began, I knew little about railguns, only that they used extremely powerful electromagnetic forces to create massive destruction. The first part of my results showed an interesting but unsurprising result. The initial current originating from the capacitor was extremely large; a capacitor charged to 1.8 coulombs generated an initial current of over a million amperes. At first, this value seemed a bit high, and in reality was most likely a little higher than we expected. However, within a matter of several hundredths of a micro-second, this value immediately dropped to several hundred thousand amperes and then even lower values shortly thereafter. The current dropped even further when the length of the rails changed or when the cross sectional area of the rail decreased. Doing both of these, something that is realistic over time, lowers the current even more drastically. Therefore, we saw that the rail gun really does involve an initial intense burst of current followed by no further circuit action. We then saw the effect of EMF. At the beginning of the project, I thought that EMF would be too hard to derive and almost discounted it. Having done it, I realize that this decision would have been poor, as EMF ended up playing a huge role. The EMF induced a current that reduced the original current by almost 3/7ths, a substantial amount. Once again, this factor was dependent on the length of the rails and conductivity of the material. Finally, the resulting magnetic field was extremely powerful but fell in line with all the other results we found. In the first moments of the circuit’s operation, an enormous magnetic field is generated, creating a large force for a very brief amount of time.  This occurrence made sense of course, as magnetic field depends on current. I am happy with these results, as they mirror the conceptual understanding of railguns I have developed during the course of this project; an enormous power lasts for an infinitesimal amount of time.

    Part of our project was not able to happen, of course. We had originally planned to build the small scale rail gun, but because of time and safety concerns were unable to. In the future when doing these kinds of projects I will be able to better adjust my plans for safety and for time. I also could have tried to make more 3D models of my models, but thought that the 2D representations made sense in the context of the project.

    In the future I would like to be able to derive equations of motion as functions of time. So many of the results I obtained were dependent on velocity and position. I adjusted for this by allowing these variables to be selected over a certain range; for example, using my model can tell you what the magnetic field of a railgun is at an exact time, position, and velocity. This result is very useful, but I would ideally like to be able to have position and velocity as functions of time as well. With more time and more math, specifically a greater knowledge of differential equations, I think I would be able to do so.

Share

Conclusion: Diffraction Patterns of C. elegans

I set out to model the diffraction patterns created by C. elegans nematodes using mathematica, specifically using the diversely useful mathematical tool of the Discrete Fourier Transform. The Transform is a quick way to find the diffraction patterns from Fraunhofer diffraction and interference (far-field diffraction). In simpler language, $\left| FT^{2} \right|$ produces the diffraction pattern, which is an analysis of the Electric field strength across the aperture, in this case, the image. The goal of this project was to produce a “library” of shapes and their corresponding diffraction patterns. However, there were many obstacles that made it necessary for me to do quite a bit of relevant research.

When I started, I did not know that the type of diffraction I was studying was Fraunhofer. Diffraction patterns are a result of the type of wave and the type of experimental setup. In this case, the light source, the aperture, and the screen were are far enough away to classify it as far-field. Mathematically, $L>>\frac{b^{2}}{\lambda}=\frac{area. of. aperture}{\lambda}$ . The fact that this is an example of Fraunhofer Diffraction makes it possible to apply the FT (on Mathematica) to yield the diffraction pattern.

I came in with some preliminary knowledge of what Fourier Transforms were in theory. In general, when applied, it changes a function’s variable dependence: $F(t) \leftrightarrow \Phi (v)$. I did quite a bit of research on the derivations of the transform and understood the matrix calculations necessary to do the transform “by hand” (see Project Plan).

To produce good-quality images, it was also necessary to do quite a bit of exploring in the Mathematica Documentation Center, becoming familiar with a variety of image manipulation commands. Those included: sharpening, brightening, finding the pixel count and dimensions, cropping, changing the color scheme to grayscale, partitioning and reassembling images manually based on the pixel dimensions, and more, depending on what degree of manipulation the image needed.

All in all, the images produced are not only pretty, but informative and now available for reference. Because it is mathematically impossible to go from the diffraction image to the shape, it is necessary to have some type of library, like the one I created, to go in that direction. (It is impossible to do it mathematically because when the Fourier Transform is applied, the phase information of the light is lost as the data is converted to the complex space.) Therefore, my “library” is useful because I have made it possible to guess the approximate shape and orientation of the worm from the diffraction pattern for some basic worm shapes. Another application for this analysis is that a compilation of several consecutive diffraction patterns shows the thrashing frequency of the worm. For example, if you took several pictures within a few seconds and found the diffraction patterns, the amount that the patterns change corresponds to the “thrashing frequency,” or the quantifiable amount that the worm wiggles.

If I were to continue this project, I would continue to build upon the library in the same manner, testing to see if different input image qualities would make a difference in the final product (if different pieces of the worms were fluorescing, if the worm was glowing a different color, etc). Finally, I would construct a real library (instead of this evolving blog site) that was easy to navigate, and generally more accessible for research.

Share

Conclusion- RLC Circuits

Overview

In this post, I will draw conclusions from my previous final data post about both RLC circuits that I have modeled.

RLC Circuit- No Voltage Source

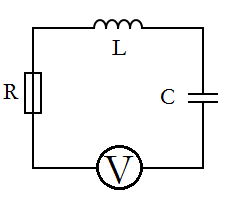
This RLC circuit [Figure 1] proved to be an interesting demonstration of the current in a circuit without a voltage source. The initial current running through the circuit is provided by the charged capacitor. However, this initial current undergoes damping due to the resistor in place, and the current running through the circuit pretty approaches zero pretty quickly.

1[Figure 1]

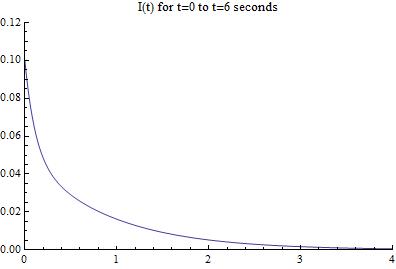
My model of this circuit verifies this idea since it shows an exponential decay of the current as a function of time [Figure 2]. After about 4 seconds, there is no longer an active current running through the circuit due to the resistor. My Mathematica notebook is easily set up for changing the values of the different components, and one can easily change them to see what effect this has on the circuit.

RLCCircuitsworking_finaldata1[Figure 2]

RLC Circuit- AC Voltage Source

The second RLC Circuit that I modeled was identical to the one above, except that it had an alternating current voltage source as well [Figure 3]. This allowed it to continue to have a current present despite the effects of the resistor.

circuitwithnumbers1[Figure 3]


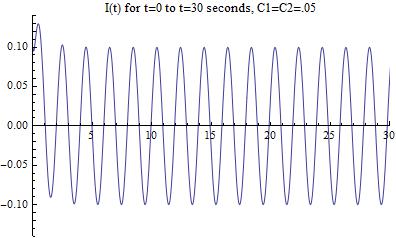
Initially, I approximated the solution to the differential equation governing the circuit by ignoring the damping terms. This resulted in a an extremely good approximation, as the damping terms should only effect the circuit’s current flow in its first few seconds. After some computational hiccups that inaccurately displayed long-term variations in the current, I went on to graphically solve the complete form of the equation and graphed it to prove that the two damping terms only had a small effect in the first few seconds of the circuits behavior[Figure 4].

RLCCircuitsworking_finaldata9[Figure 4]

Final Remarks

Given the chance to work more on this project, I would develop manipulable animations within Mathematica that would allow one to change a given variable (ex. resistance, inductance, capacitance). This would allow the reader to easily see the effects that the different components have on the circuit. This would also be helpful from an educational standpoint as an applet to someone wanting to learn more about RLC circuits, or circuitry in general.

On a final note, I managed to learn a lot more about Mathematica and its differential equation solving capabilities. Solving the equations for these circuits by hand would have been an extremely length procedure, but once I provided Mathematica with the commands in the correct syntax, it solved them much faster than any human could. This project helped me appreciate the uses of computational tools in physics, and I am very glad that they exist.

Share

Final Data – E Fields of Spherical Objects

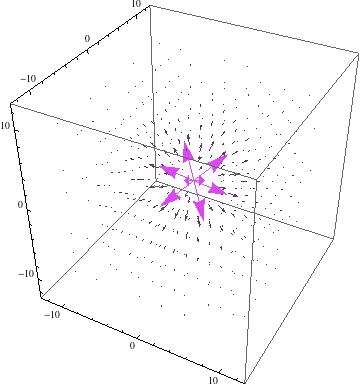
I began by modeling the electric field for a point charge +q, equal to the value of an elementary charge.

phys1


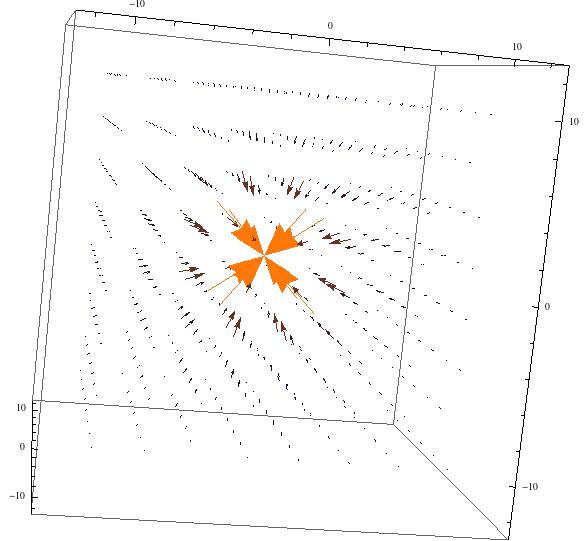
I also modeled the electric field of a point charge of -q.

phys2


Next, I attempted to model the electric field due to spherical hollow conductor with total charge +q. First, I graphed a sphere of radius 5 using Mathematica’s SphericalPlot3D function. I superimposed the electric field of a positive point charge over this sphere, knowing that this would be incorrect. By Gauss’s Law, the stated configuration would result in an electric field of 0 inside of the spherical conductor, and an electric field following $\textbf{E} = \frac{1}{4 \pi \epsilon_0} \frac{q}{r^2} \mathbf{\hat{r}} $ for r > 5. The following image shows a partially transparent sphere with an electric field inside of it, violating Gauss’s Law.

phys3


However, thanks to Brian Deer, I learned to use Mathematica’s RegionFunction, which allowed me to specify which regions of the graph on which the vector function would apply. The following now shows a hollow conductor of radius 3, with an electric field only present outside of it. Unfortunately, this step took a lot of time to work out, as I tried many different ideas to only get the field to show for certain radius values (i.e. be 0 inside of the conductor). I was unaware of RegionFunction, and even when I did learn what it was, I had trouble getting it to work with my model.

phys4


My updated Mathematica file can be found here.

Share