Maybe not the most awesome, but I’ll try to make it so.
(1) 
Roger Rothenberg
holograms
Using the LitiHolo Holography Kit (http://www.litiholo.com/hologram_kits.htm), I created transmission holograms and attempted to create a reflection hologram.
Transmission Hologram Procedure:
In the dark room, I assembled the LitiHolo kit as instructed (see image 1), with the object to be rendered in the delineated box on the black plastic base (with rubber foundation to reduce vibration). I turned on the laser, turned off all other light in the darkroom (save for a blue darkroom LED [the LED’s blue wavelength, while illuminating the room enough for me to get around, did not affect the hologram, which was produced by red light]), and used white paper to ensure that the laser spread to the whole surface of the spot I would place the photosensitive glass. I used a black cardboard “shutter” to block the laser’s path to the object so that I could position the photo glass without exposure. After waiting one minute for the setup to settle (LitiHolo instructions recommend three minutes for a clearer hologram), I removed the shutter. After waiting approximately five minutes (as recommended by LitiHolo), I removed the object and made sure the hologram had been recorded. At this point it was safe to turn the light back on, as the hologram was finished and would not be exposed further. See image 3 for an example transmission hologram.
Reflection Hologram Procedure:
There were no instructions on creating a reflection hologram from the LitiHolo kit, but I attempted to create my own setup (see image 2) based on more detailed procedures for reflection holograms. Other sets of instructions recommended a greater distance between laser and recording glass, so I increased the spacing between the laser mount and object base provided by LitiHolo. I rotated the base so that the slot for the photo glass was between laser and object. From this point, I proceeded as I did with the transmission hologram. After getting some unremarkable results, I tried again, this time with an additional non-photo glass placed behind the object, with the rationale that this might increase the amount of light scattered from the object onto the photo glass. This did produce a more visible reflection hologram.
Though the above procedures did result in visible holograms, several factors might have improved their quality:
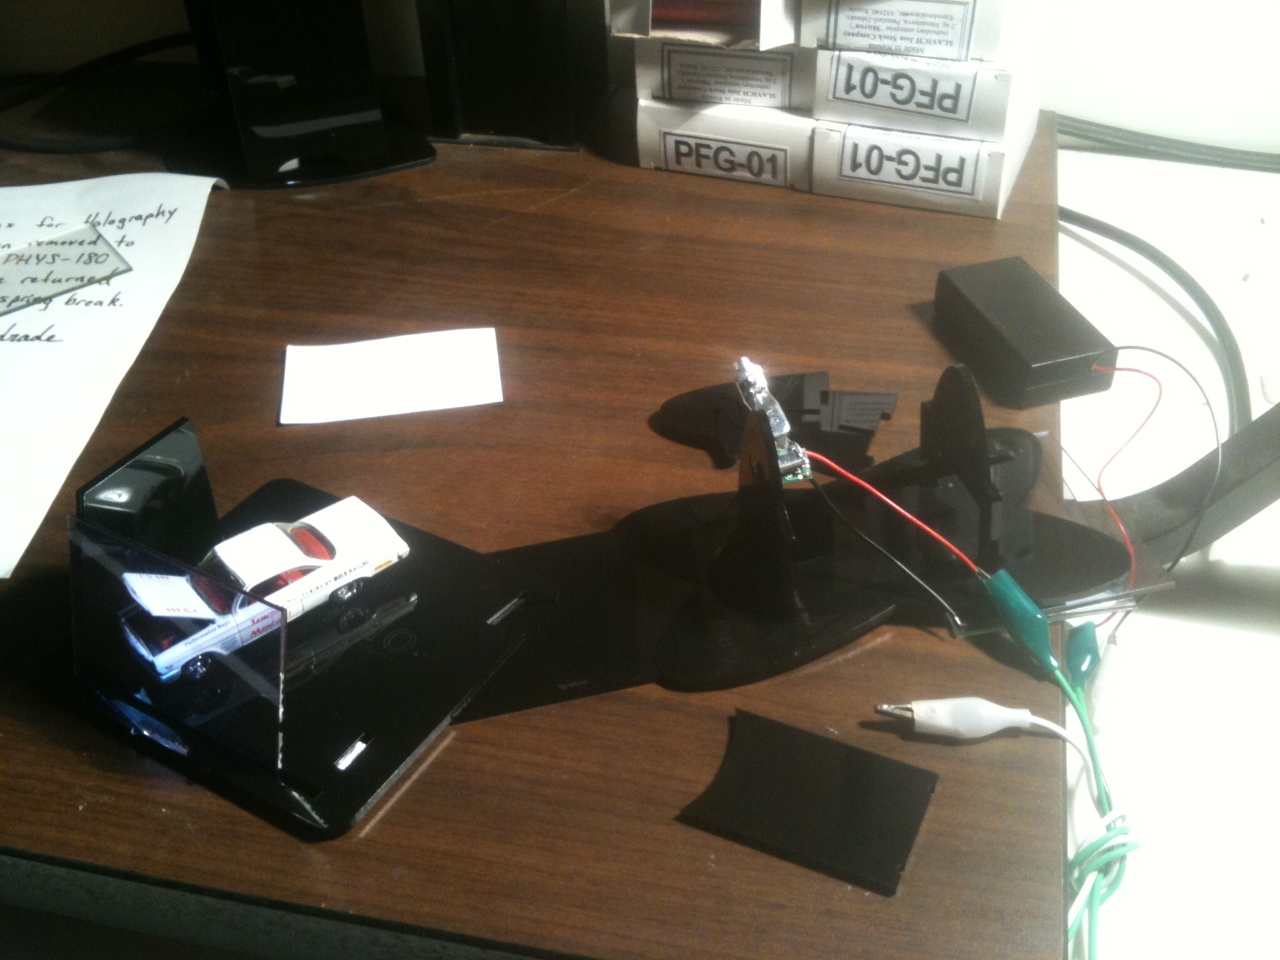
Image 1: Transmission Hologram Setup
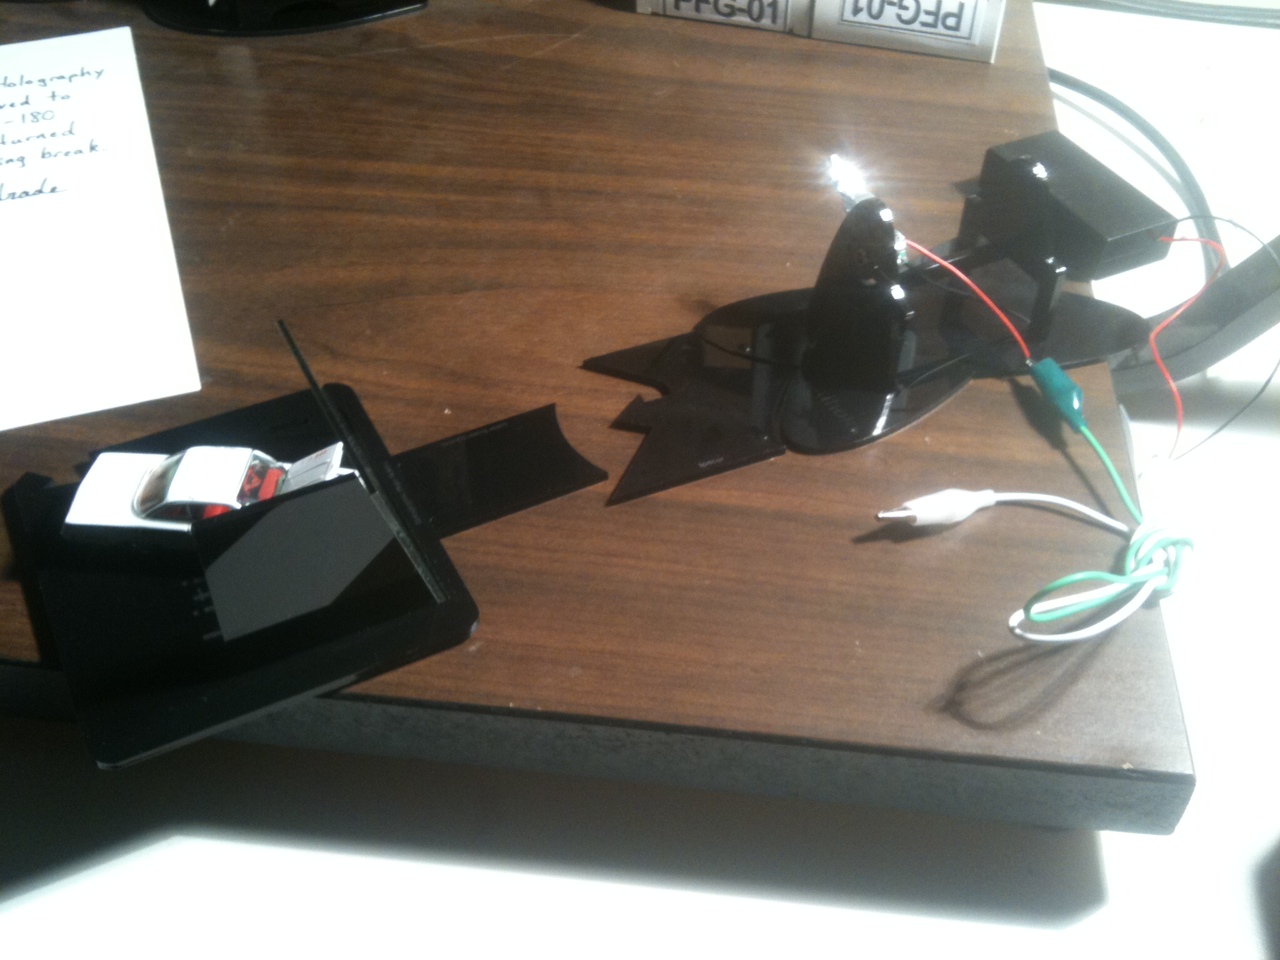
Image 2: Reflection Hologram Setup
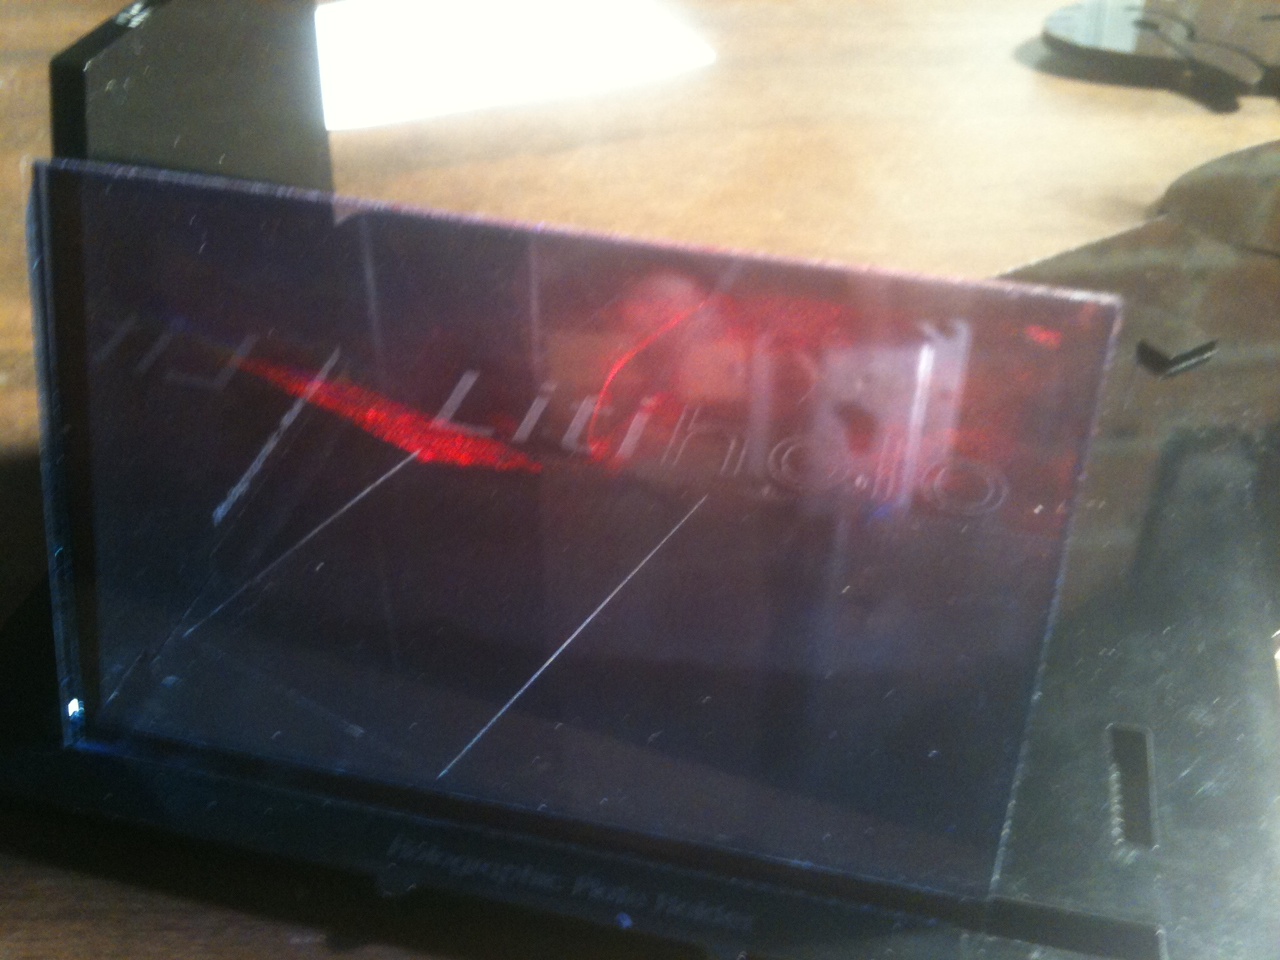
Image 3: Example Transmission Hologram of Car Figurine With Hood Open
Results and Discussion:
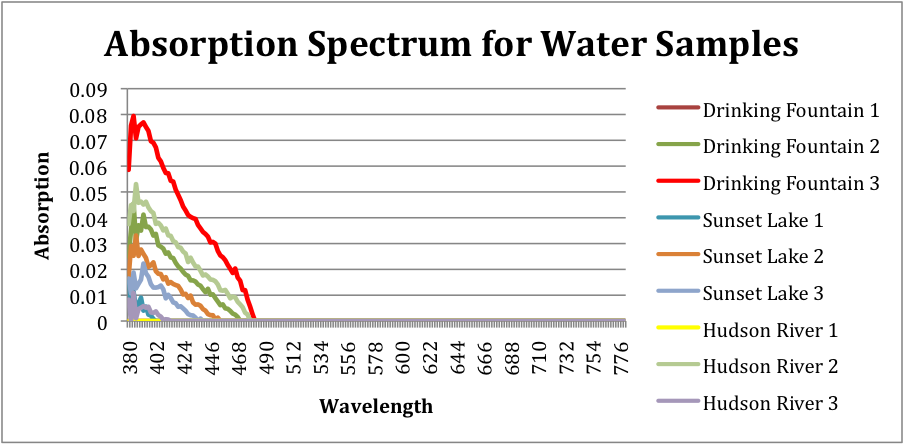
Water Contaminant Concentration Tests
| Hudson River | Sunset Lake | Drinking Fountain | |
| Copper (Mg/L) | 0 | 0 | 0 |
| Nitrate (Mg/L) | 5 | 0 | 0 |
Unfortunately, we were unable to deduce anything about the water chemistry from our analysis of the water samples using a spectrometer –much less the concentration of contaminants! The tests using the aquarium water sampling kits failed to demonstrate that either the Hudson River or Sunset Lake was not potable. The EPA water quality standard for nitrates is 10 mg/L, well below what we saw in the Hudson River. We were surprised to see that the Sunset Lake sample registered no nitrates. The New York government website states that a level of 3 mg/L is expected in any body of water where there is a significant human presence. We suspect this is due to the quality of our testing kit, which is only accurate to 5mg/L. So, does this mean the water in Sunset Lake and the Hudson River is potable? Absolutely not! Though our data does not allow us to conclude our water samples were not potable, we were able to test for only two of the over eighty contaminants listed on the EPA website.
Though we did not find any evidence in our results, our group performed further research to confirm our initial hypothesis that the Hudson River near Poughkeepsie was not potable. We found a USGS report on water quality in the Hudson River Basin that showed lead, chromium, and zinc were found in higher concentrations than deemed safe for drinking water in Hudson River water samples taken from a site near Poughkeepsie. Furthermore, we found a report published by the environmental organization Riverkeeper that showed that over 10% of water samples taken from the Hudson River near Poughkeepsie contained an unacceptable concentration of Enterococcus bacteria.
We were unable to find similar studies about the water quality of Sunset Lake. As stated above, our results do not confirm that the water from Sunset Lake is safe for human consumption. Further testing is needed to determine whether or not the water is potable. It is our opinion that future tests should focus on the presence of microorganisms, as they are much easier to detect than small concentrations of chemical contaminants.
For our project, we will be examining a possible relationship between the energy used by a cellular phone and the radiation that it emits while in use. To gather our data, we will be using Watts Up Pro and an RF meter to measure the microwave radiation generated by electric currents within the phone. In order to obtain a statistically significant sample, we will be testing roughly ten to fifteen phones of different models. This will also allow us to see if a phone’s make and model are related to the amount of radiation it emits. The testing will take place in the Retreat on Tuesday, November 15, at 3 pm. This data will be gathered as a group, and we will then split up the remaining work amongst ourselves. For example, I will be responsible to creating the chart and graph to display our findings, while Ali will handle a visual graphic comparing types of phones, and Sam will present our results and conclusions. Our expected outcome is that the more energy that a phone uses, the more radiation it will emit.
| Neutral (Nothing Open) | Web Site Open | 2 Programs + Web | |
| 48.6 W | 49.0 W | 51.0 W | |
| 47.9 W | 50.2 W | 51.6 W | |
| 48.9 W | 49.9 W | 52.0 W | |
| AVG = 48.46 W | AVG= 49.7 W | AVG = 51.53 W | AVG = 49.89 W |
| Central Hudson Costs | Cost (AVG)/ Work Day | ||
| Off-Peak= $.04370/ KwHr | $ .021 / Work Day | ||
| Peak = $.06086/KwHr | |||
| AVG = $ .05228/ KwHr | |||
| DATA | |||
| Department | #of Computers | Cost/ Work Day | |
| Anthropology | 8 | $0.17 | |
| Art | 19 | $0.40 | |
| Biology | 25 | $0.53 | |
| Chemistry | 23 | $0.48 | |
| Chinese/Japanese | 8 | $0.17 | |
| Computer Science | 9 | $0.19 | |
| Dance | 10 | $0.21 | |
| Drama | 12 | $0.25 | |
| Earth Science/Geography | 9 | $0.19 | |
| Economics | 13 | $0.27 | |
| Education | 9 | $0.19 | |
| English | 31 | $0.65 | |
| Film | 10 | $0.21 | |
| French | 8 | $0.17 | |
| German | 4 | $0.08 | |
| Hispanic Studies | 8 | $0.17 | |
| History | 17 | $0.36 | |
| Italian | 7 | $0.15 | |
| Mathematics | 9 | $0.19 | |
| Music | 40 | $0.84 | |
| Philosophy | 9 | $0.19 | |
| Athletics | 27 | $0.57 | |
| Physics/Astronomy | 11 | $0.23 | |
| Political Science | 13 | $0.27 | |
| Psychology | 21 | $0.44 | |
| Religion | 9 | $0.19 | |
| Russian | 4 | $0.08 | |
| Sociology | 10 | $0.21 | |
Background:
Compact discs have permanently changed the way people listen to, store and record music. Though the uses for them have expanded since their initial release in the late 1970’s and their popularity has declined considerably since the invention of the mp3 and related music players, they are solely responsible for the digital music revolution. Analogue music recorded on vinyl records had its own advantages and disadvantages. Of the most concern here is a portability and shock resistance issue that simply could not be overcome due to the method of encoding and reading used to store the audio information on records. Compact disks overcame both of these issues, though the differences in data storing allowed for new approaches to mixing and mastering recordings. These mixing and mastering trends in turn have changed people’s preferences for recording style. People have come to expect certain qualities from the audio they listen to, qualities which often were not present on recordings made decades ago. Thus, when songs are rereleased, they are often remastered to cater to more current acoustic preferences.
Due to the physical limitations of needle vibration within the grooves of the record, an inherent volume limit to recordings was imposed on records. However, even during the days of turntables, louder recordings tended to attract more attention in situations where sound quality was not as apparent (radio/ jukeboxes). Thus, recording studios would make their recordings as loud as possible in much the same way that television stations tend to make the commercials louder than the actual program. People have a tendency to equate louder music with higher quality recordings (a tendency supported by our testing. Many of our subjects stated that one side sounded better simply because it was “louder”). Upon the introduction of the compact disk, this physical limitation was removed allowing for much louder music. The change wasn’t immediate. It took many years.
Rather than merely upping the volume of the entire track, a practice called compression is often used. Compression takes the quietest sounds and makes them louder while softening the louder sounds. Because it is easier to more clearly discern louder sounds, people will often equate better sound quality with a song that has less dynamic range. You can more easily hear softer sections of music in a more compressed track. Ironically, compact disks were marketed for their potential for greater dynamic range (complete silence could be achieved as no needle noise is involved). However, such changes to audio after it is recorded can cause distortions or clipping. The most drastic changes to audio compression trends occurred between 1990 and 2000.
We set out to test whether the volume itself was the source of perceived increase in musical recording quality over the years, or if the clipping and distortion caused a significant decrease in perceived quality when volume was adjusted for.
Results and Conclusions:
After calculating the average power consumption of the necessary devices (lamp, fan, space heater, water heater) in Watts, our next step was to assess the prevalence of these devices in the dormitories in question. We surveyed 10 random rooms in each building, attempting to identify a distribution of rooms of varying sizes (both singles and doubles) in each building. We attempted to survey a distribution of rooms of equivalent sizes in each building. Our survey asked students to assess their average daily usage for each device over the month of November.
After our survey, we compiled the aggregate device usage hours for each device. Additionally, we multiplied those usage hours by the average power consumption rate (based on our findings from the WattsUpPro) for that device. We compiled all of that data to find the total power consumption for the pertinent devices of those students. These are our results:
Lathrop:
Lamp power consumption: 114hours x 14.4W = 1641.6Wh
Fan power consumption: 27hours x 39.2W = 1058.2Wh
Space heater power consumption: 55hours x 1460W = 80,300Wh
Water heater power consumption: 1hour x 669.6W = 669.6Wh
Total power consumption: 83,669.4Wh/day
Davison:
Lamp power consumption: 65hous x 14.4W = 936Wh
Fan power consumption: 90hours x 39.2W = 3528Wh
Space heater power consumption: 0hours
Water heater power consumption: .92hours x 669.6W = 613.8Wh
Total power consumption: 5,077.8Wh/day
As we can easily see, the power consumption of climate regulating devices in Lathrop House is far greater than that of Davison House. In fact, it was roughly 16.5 times greater. This confirms our initial expectation that power consumption in Lathrop House (the older dormitory) would be greater than that of Davison house.
We should note that the vast majority of the difference in power consumption derived from the use of space heaters in Lathrop. We might assume that this number derives from the older, and probably inferior, insulation in that building compared to that of Davison. We believe that a more exhaustive survey of the buildings would provide support for the significance of this trend.
It is also notable, however, that the usage of fans was more prevalent in Davison than it was in Lathrop. Perhaps we can surmise that the same insulation that necessitates so few space heaters in Davison also relates to a lack of ventilation in that building.
In summary, the average power consumption rates of climate controlling devices were far greater in Lathrop House than in Davison House. We believe that it is likely that the older nature of the Lathrop House was at least partly responsible for this phenomenon. The recent renovation of Davison will likely necessitate far less climate controlling device usage in that dorm in the recent future.
Social Widgets powered by AB-WebLog.com.