What were our results, and what do they mean?
|
Instrument |
RMS Error |
|
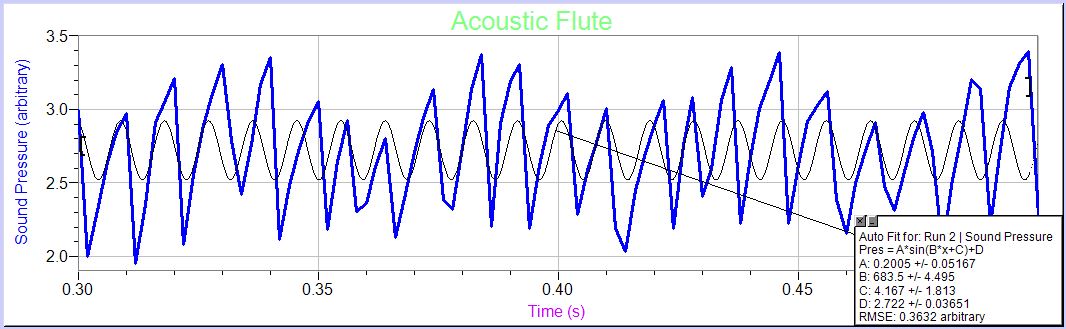
Acoustic Flute |
0.3632 |
|
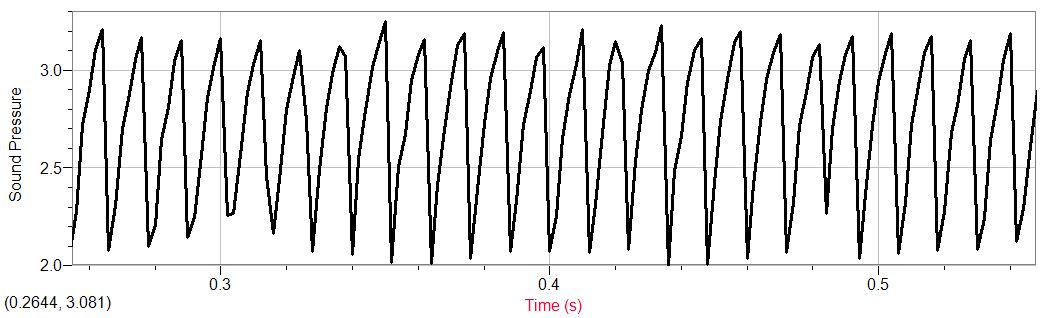
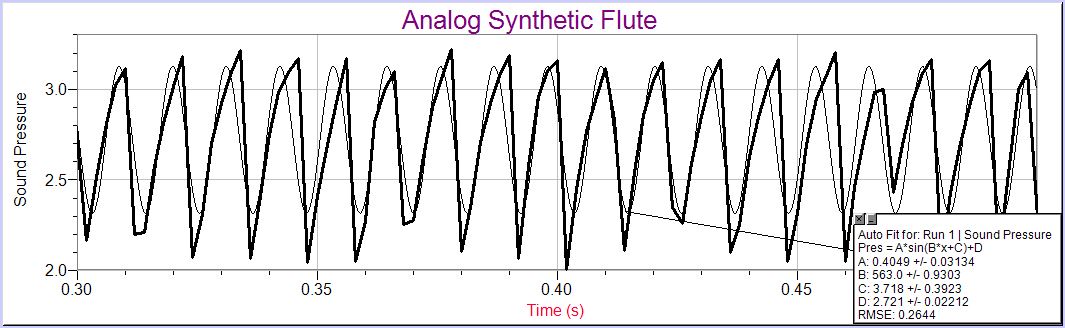
Analog Synthetic Flute |
0.2644 |
|
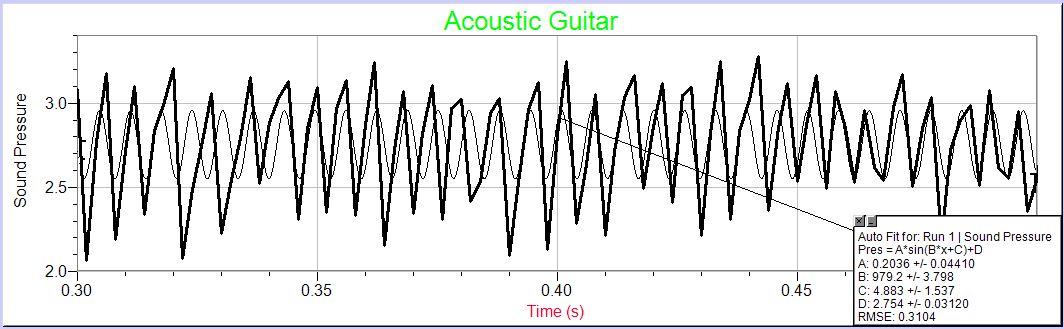
Acoustic Guitar |
0.3104 |
|
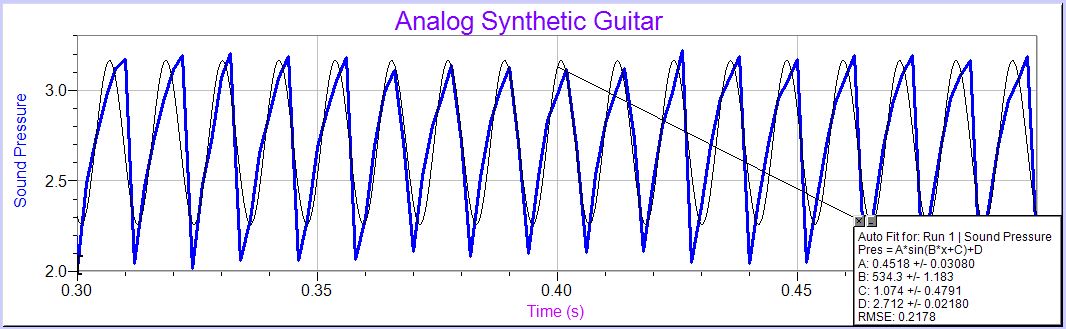
Analog Synthetic Guitar |
0.2178 |
|
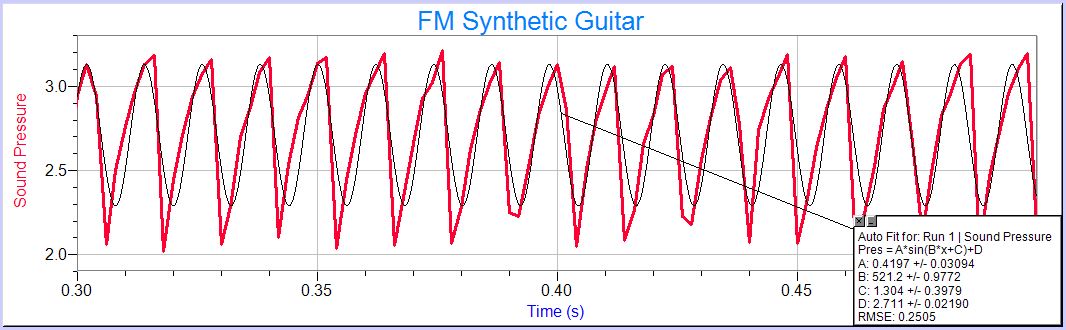
FM Synthetic Guitar |
0.2505 |
|
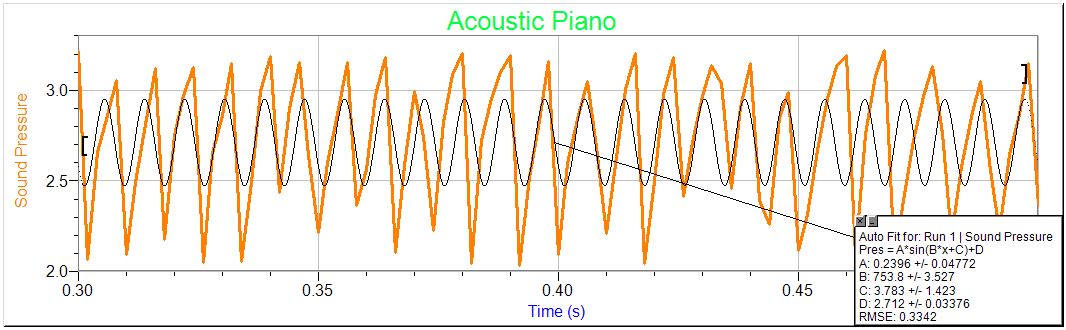
Acoustic Piano |
0.3342 |
|
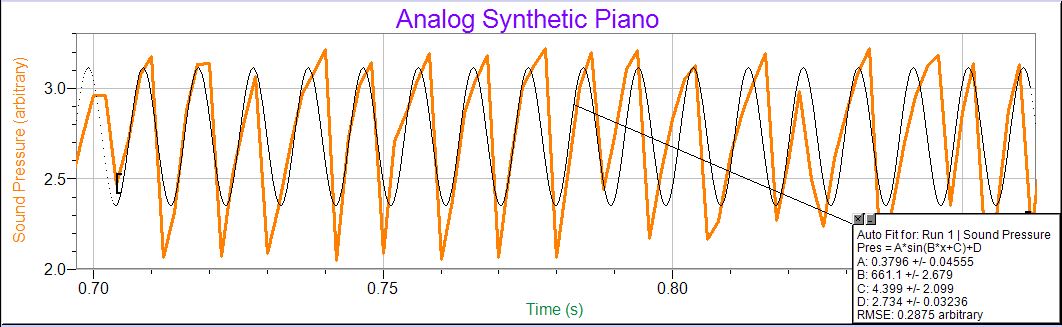
Analog Synthetic Piano |
0.2875 |
|
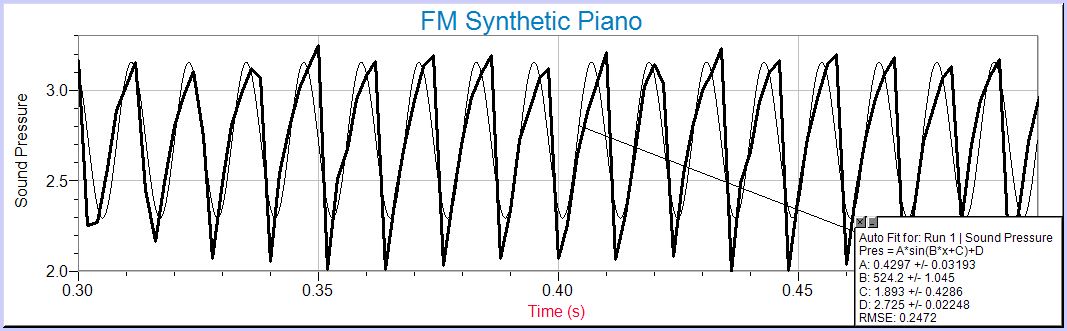
FM Synthetic Piano |
0.2272 |
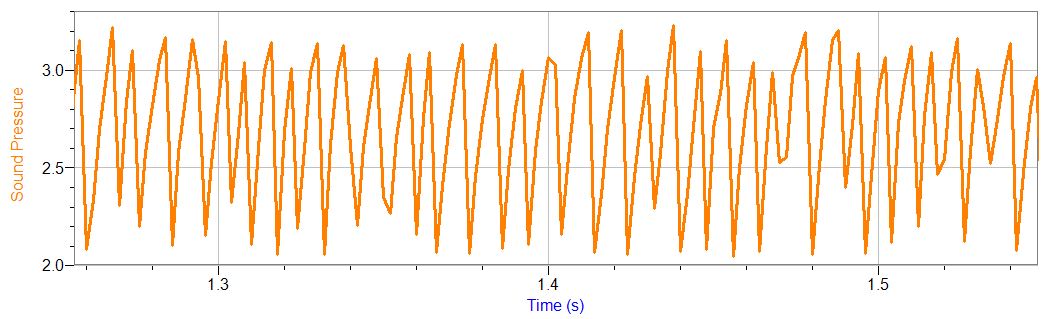
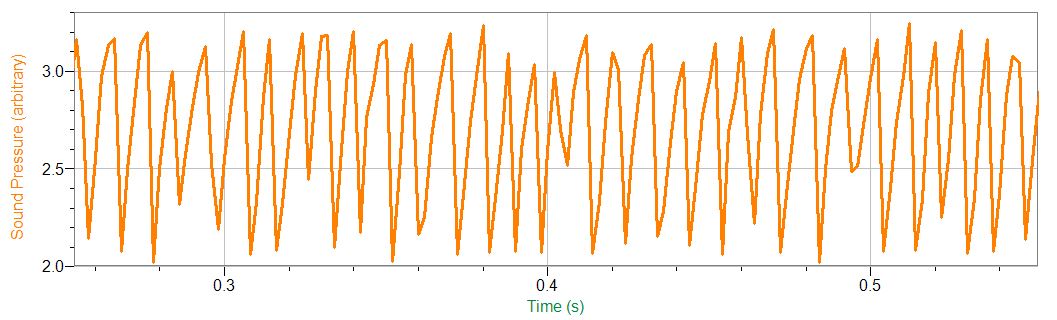
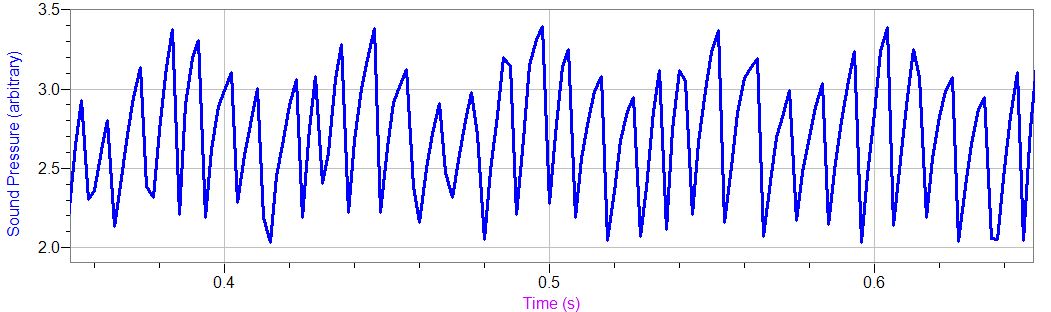
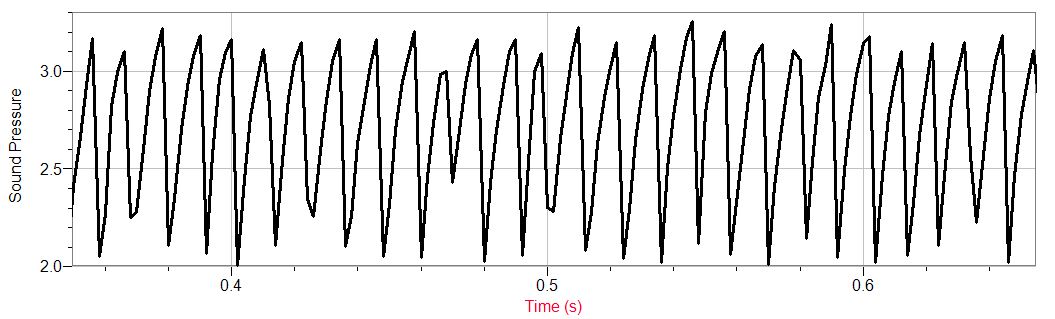
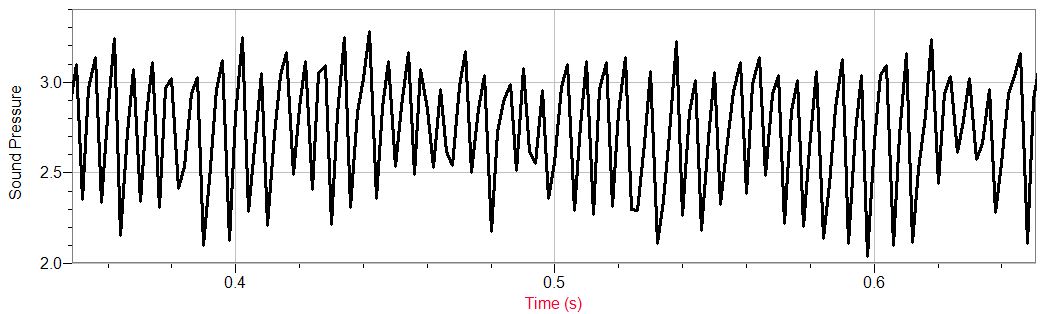
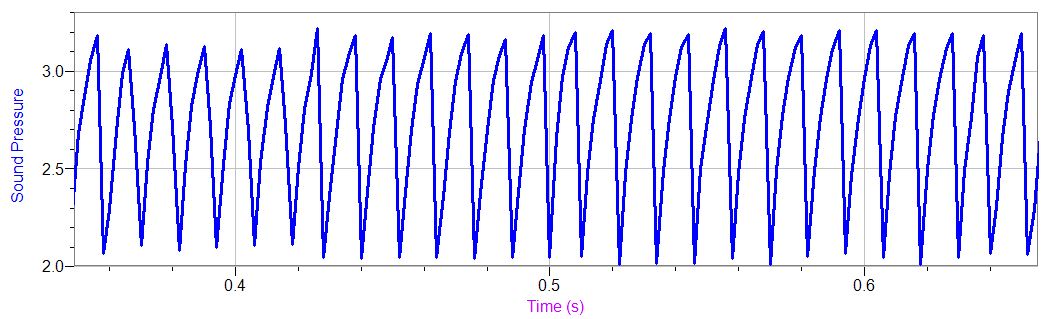
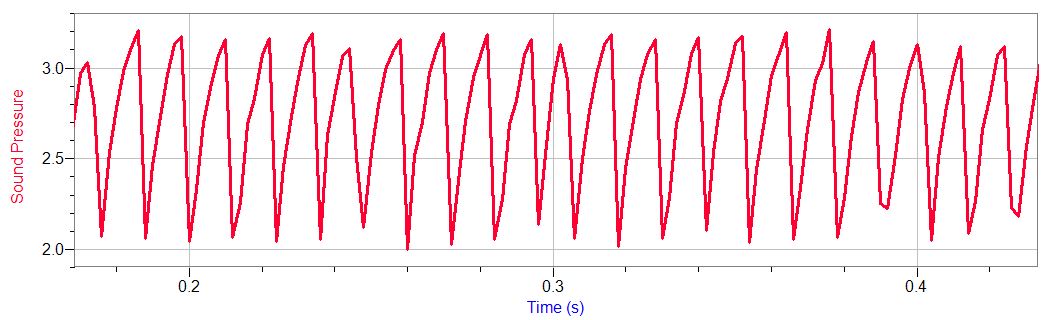
The Root Mean Square Error method shows the difference between data points and a mathematical model. In this case, the RMS is showing the different between the synthetic and acoustic waves and a sine curve. As can be seen in the table above, our data clearly shows that acoustic waves do not fit a mathematical model as well as synthetic waves. The average of all synthetic waves’ RMS errors (including FM waves) was .2495, while the average of acoustic waves’ RMS errors was 0.3359. This means that the synthetic waves were more regular; this is understandable because there is no natural pitch and volume variation in a computer-generated wave.
Were our results as predicted? Why or why not?
Our earlier post about expected outcomes reveals that we had some misconceptions about sound waves, especially synthetic sound waves. We were correct in predicting “more organic” waves for instruments. However, we misunderstood “more organic” to be a simple sine wave. We imagined a “natural” sine wave to have nice curve with a consistent frequency. On the other hand, we thought the synthetic wave would be more sharp and geometric looking. In reality, both acoustic and synthetic waves are sawtooth waves for the instruments that we were analyzing.
Synthesizers cannot reproduce the natural amplitude or pitch variation that occurs with acoustic instruments. When people play instruments they cannot sustain a note at the same volume with the precision that a computer program can. Especially in the case of a guitar or a flute, the pitch may also vary slightly based on how the person is playing. In the case of a guitar the pitch could change based on finger placement, with the flute based on lip shape. After researching how sound waves are produced by synthesizers and instruments we have realized these misconceptions. We are using the scientific information outline below to analyze our data.
What science did we learn during this project?
An Introduction to Overtones, Harmonics, and Additive Synthesis (from “Synth School,” CreativeCommons):
This project allowed us to learn about the way sound waveforms are produced naturally by acoustic instruments, and how synthesizers attempt to replicate these waveforms. We learned that waves produced by acoustic instruments are a result of the various overtones and harmonics unique to each instrument. These harmonics cause interference; the waveforms are distorted from the pure sine wave shape. We learned that different instruments naturally produce different sets of overtones as a result of their shape. For example, a clarinet is known to have a square waveform, which results from the instrument only producing the odd harmonics.The shape of an instrument determines its unique set of harmonics. Closed tube, cone-shaped, and string instruments (and the various instruments within each of those categories), will all have different sets of harmonics. The three instruments we worked with, though each having a unique series of harmonics, all naturally produce a sawtooth waveform.

A wave progresses from a sine wave to a sawtooth form as more harmonics are added.
(from TeachNet Resources, http://resources.teachnet.ie/amhiggins/squaresaw.html)
The biggest factor that affects the “natural” quality of an acoustic instrument is the variation in pitch and amplitude, which cannot be readily replicated by a synthesizer. Synthesizers tailor their replications of each sound by trying to use the same set of harmonics produced naturally by each instrument. For example, a synthesizer will try to replicate the sound of a clarinet by adding only the odd harmonics onto the fundamental tone, just as would happen with an actual acoustic clarinet. The synthesizer’s cold, unnatural sound is the a result of the lack of variation found in acoustic tones.
The set of harmonics produced will differ from instrument to instrument, and those unique sets of harmonics are the information used by synthesizers to try to replicate the unique sound of the individual instrument. Thus, the wave shape of a tone of an individual instrument will be the same whether synthetic OR acoustic. The differences between synthetic and acoustic tones, then, lie in the variations produced naturally in pitch (frequency) and volume (amplitude) of an acoustic instrument.
What would we differently if you had to do this project again?
If we had to do this project again, we would approach it very differently given the knowledge we have now. We would do more preliminary research before even starting our data collection. In addition, we would take our data in an environment with minimal ambient sound and controlled conditions (like temperature which might have affected the pitch, etc. of our acoustic instruments.) Another thing we would have to do before data collection is become more acquainted with our LabQuest! After taking our first set of data, our LabQuest would not transfer any data to a computer, and then deleted our data altogether. Testing our LabQuest before taking significant amounts of a data is a step we would take at the very beginning of our project if we had the opportunity to start from scratch.
What would we do next if we had to continue this project for another 6 weeks?
If we had to continue this project for another six weeks, we would test out other synthesizer programs (other online programs like AudioSauna, maybe iPhone applications, or look at more expensive programs) to see if the effect is consistent among all synthesizers. We would expand our project to include other instruments as well, apart from piano, guitar, and flute. In taking our data, we would try to take more data samples per second (although that might include using a more sophisticated device than a LabQuest), so as to hopefully obtain more accurate waveforms. On the AudioSauna program that we used for our project, there are certain features which allow for manual changes in wave shape and harmonics added to a tone. We would like to see if we adjust these features, if we might be able to more accurately replicate the natural waves of the acoustic instruments.
In addition to taking more data, we would consider expanding our project to have a more interdisciplinary approach. We would like to incorporate Media Studies into our project, and look at how prevalent purely synthetic tones are found in today’s recorded music. Also, we are interested in expanding our project in a psychological context as well, to see if humans are able to tell the difference between an acoustic and a synthetically produced tone.
Finally, if we had another six weeks to work on this project, we would devote much more time to research and learning about the process of sound synthesis and how more complicated and variable waveforms are created with acoustic instruments. More knowledge on the subject would help us analyze our data much more accurately, and see the differences and subtleties in all of our data.