Category Archives: Uncategorized

6 – Data Update

Our project started ambitiously with the goal of amplifying NFC signals, or reversing the nullification of NFC that occurs when a chip is backed with metal. Unfortunately we could not acquire thin enough materials (such as permalloy or ferrite foil/film) to properly test whether this was possible. We then pivoted and decided to test the range of data transfers when the NFC chip was backed with various materials of different electromagnetic permeability.

+-+-+-+-+-+-+-+-+-+-+-+-+-+-+-+-+-+-+-+-+-+-+-+-+-+-+-+-+-+-+

Establish an average distance of transfers from

Samsung NFC NFC on Li-ion battery
to
3.8cm Circular RapidNFC NTAG203
with
no backing


Trials

  1. 3.5cm
  2. 4.0cm
  3. 3.7cm
  4. 3.7cm
  5. 3.8cm
  6. 4.0cm
  7. 3.7cm
  8. 3.5cm
  9. 3.3cm
  10. 3.8cm
  11. 3.6cm
  12. 3.8cm
  13. 3.3cm
  14. 3.9cm
  15. 3.5cm
  16. 3.8cm
  17. 3.9cm
  18. 3.3cm
  19. 3.3cm
  20. 3.5cm

Avg. 3.645cm

+-+-+-+-+-+-+-+-+-+-+-+-+-+-+-+-+-+-+-+-+-+-+-+-+-+-+-+-+-+-+
Establish an average distance of transfers from
Samsung NFC NFC on Li-ion battery
to
3.8cm Circular RapidNFC NTAG203
with
.9mm stainless steel backing


Trials

  1. No Transfer
+-+-+-+-+-+-+-+-+-+-+-+-+-+-+-+-+-+-+-+-+-+-+-+-+-+-+-+-+-+-+
Establish an average distance of transfers from

Samsung NFC NFC on Li-ion battery
to
3.8cm Circular RapidNFC NTAG203
with
10cm iron backing

Trials

  1. 1.9
  2. 2
  3. 1.4
  4. 1.1
  5. 1.6
  6. 1.8
  7. 1.2
  8. 1.1
  9. 1.5
  10. 1.7
  11. 1.6
  12. 2.2
  13. 1.9
  14. 2.3
  15. 2.4
  16. 2.1
  17. 1.7
  18. 1.6
  19. 1.5
  20. 1.8

Avg. 1.72cm

+-+-+-+-+-+-+-+-+-+-+-+-+-+-+-+-+-+-+-+-+-+-+-+-+-+-+-+-+-+-+

Samsung NFC NFC on Li-ion battery
to
3.8cm Circular RapidNFC NTAG203
with
1.2 cm glass backing

Trials

  1. 4.1
  2. 3.5
  3. 3.7
  4. 4
  5. 4.5
  6. 3
  7. 4.2
  8. 4.3
  9. 4
  10. 4
  11. 4.1
  12. 4.7
  13. 4.5
  14. 4.1
  15. 4.2
  16. 4.2
  17. 3.8
  18. 4.3
  19. 4.5
  20. 4.6

Avg. 4.115cm

+-+-+-+-+-+-+-+-+-+-+-+-+-+-+-+-+-+-+-+-+-+-+-+-+-+-+-+-+-+-+

Samsung NFC NFC on Li-ion battery
to
3.8cm Circular RapidNFC NTAG203
with
16mm ferrite backing

Trials

  1. 2.1
  2. 2.4
  3. 2
  4. 1.8
  5. 2
  6. 1.9
  7. 2
  8. 2.2
  9. 2.4
  10. 1.7
  11. 2.1
  12. 1.9
  13. 1.7
  14. 2
  15. 1.5
  16. 1.9
  17. 2.1
  18. 2.0
  19. 1.8
  20. 2.1

Avg. 1.98cm

+-+-+-+-+-+-+-+-+-+-+-+-+-+-+-+-+-+-+-+-+-+-+-+-+-+-+-+-+-+-+

Samsung NFC NFC on Li-ion battery
to
3.8cm Circular RapidNFC NTAG203
with
Wood backing

Trials

  •      1.  3.2
  1. 3.2
  2. 3
  3. 2.8
  4. 2.9
  5. 2.7
  6. 2.4
  7. 3.6
  8. 3.8
  9. 3.4
  10. 3.6
  11. 3
  12. 3.9
  13. 3.7
  14. 3.9
  15. 3.3
  16. 3.5
  17. 3.9
  18. 3.5
  19. 3.2

Avg. 3.325cm

+-+-+-+-+-+-+-+-+-+-+-+-+-+-+-+-+-+-+-+-+-+-+-+-+-+-+-+-+-+-+


Group 3 Project Data

Model Power @ 25% Power @ 50% Power @75 % Power @ 100%
MacBook Pro (mid-2012, 15 inch w/ Retina Display
Volts 117 116.6 116.8 117.2
Amps 0.542 0.546 0.564 0.603
Watts 11.2 12.2 14.4 18.5
Apple MacBook Pro (13-inch, mid-2012) *Could this computer be affected by viruses?*
Volts 118.8 119 119.1 119.4
Amps 0.908 0.923 0.936 0.961
Watts 44.3 44.6 45.9 48.3
Apple MacBook Pro (13-inch, mid 2009)
Volts 119.3 119.1 119.2 119
Amps 0.54 0.544 0.555 0.582
Watts 10 10.9 11.9 14.4
MacBook Air (mid 2012, 13-inch)
Volts 117.3 117.3 117.1 116.9
Amps 0 0 0 0
Watts 0 0.1 0.1 0
MacBook Pro (mid 2012, 15-inch)
Volts 116.9 116.9 116.9 117.2
Amps 0 0 0 0
Watts 0.1 0 0 0
MacBook Pro (mid 2012, 15 inch)
Volts 117 117.1 117.2 0
Amps 0 0 0 0
Watts 0.1 0.1 0 0
MacBook Pro (2010, 13-inch)
Volts 115.8 115.9 116 116
Amps 0 0 0 0
Watts 0 0 0.1 0
MacBook Pro (mid-2012, 13-inch)
Volts 115 115 115.3 115.2
Amps 0 0 0 0
Watts  0  0  0 0
MacBook Pro w/retina (mid-2012, 13-inch)
Volts 115.3 115.4 115.4 115.4
Amps 0 0 0 0
Watts 0 0.1 0 0.1
MacBook Pro (late 2011, 13-inch)
Volts 115.4 115.4 115.3 115.4
Amps 0 0 0 0
Watts 0 0 0.1 0
MacBook Pro (13-inch, summer 2012)
Volts 115.4 116.6 116.2 115.6
Amps  0.556 0.578 0.582 0.587
Watts 8.8 9.8 9.4 12.5
MacBook (summer 2008, 13-inch) *Molly’s Computer Exhibits Very High Power Usage. She may want to check for viruses.*
Volts 115.6 115.5 115.6 115.7
Amps 0.641 0.655 0.668 0.685
Watts 44.4 46.6 47.1 55.3
MacBook Air (summer 2012,13-inch) *High Power Usage*
Volts 116 115.9 115.9 115.7
Amps 0.43 0.733 0.739 0.745
Watts 32 51.6 52.2 52.7
MacBook Air (summer 2012, 13-inch)
Volts 115.6 115.7 115.6 115.7
Amps 0.373 0.368 0.337 0.384
Watts 24.6 26.6 26.6 28.3
MacBook Air (mid 2011, 11-inch)
Volts 116.7 116.6 116.7 116.9
Amps 0.536 0.543 0.549 0.561
Watts 9.9 10.7 11.2 12.9
Every Laptop that we tested is some variation of Apple’s MacBook Pro or MacBook Air. Since Apple does not have specific “model numbers” for their laptops, we indicated the time that the laptop was released and the size of the screen. The data was taken using our Watt’s Up Pro’s supplied by Prof. Magnes. Electrical power is measured in wattage, which is equal to the voltage (volts) multiplied by the current (amperes). Amps are equal to the amount of electrical charge passing through a circuit per unit of time, with 6.241x 10^18 electrons per second being equal to one ampere.  We measured the watts, amperes, and volts of each laptop with screen brightness at 100%, 75%, 50%, and 25%. Each laptop had every application closed except for Safari’s homepage, which was what was on the display for every measurement. There are some glitches in the current data. Tori’s Watt’s Up Pro gave measurements of approximately 0 for both amps and watts for a reason that is still under investigation. It is possible that the device was not configured correctly for reading current, as power = voltage x current, and a zero value for current would cause a calculated wattage to be zero as well. Some laptops, including Molly’s 2008 MacBook and the 13-inch mid 2012 MacBook Pro gave very high readings for watts and amps. We are considering possibilities for this outlying data, including the chance that viruses are causing the computers to run less efficiently or dysfunctional batteries. We will graph the data for each type of laptop, but it is clear from our data tables that increasing brightness consistently increases power usage. This is consistent with our original hypothesis. Amps also increase consistently, but voltage does not vary directly according to screen brightness. This makes sense since voltage is only the electric potential difference between two points.References:

December 2010 – By Steven S. Zumdahl, Susan A. Zumdahl – Brooks/Cole, CENGAGE Learning – 2010.12.17 – Hardback – 1,038 pages – ISBN 0840065329

Group 1: Project Plan

Motivation:
The innovation of wireless technology has given us convenience in the form of mobility, speed, and efficiency. In addition it has enabled us to go outside our reach to form and keep connections made with people all around the world.

Problem Statement:
There is still a rather inconvenient and significant tether that keeps us from moving with the speed and flexibility that we are capable of, the need for electrical power to be transmitted through wire. The solution: Wireless Power Transmission (WPT).

Approach:
There are a handful of products, known as power mats, on the market that offer WPT for the use of charging cell phones and iPods. The purpose of our investigation is to collect data and analyze the commercial products and with that information build a WPT device of our own. Moreover, we wish to consider the limits, benefits, and further applications of such technology.

Results:
Our device will work by inducing a current with a changing magnetic field. By running current through a primary wire, a magnetic field is created, a secondary receiver coil will experience a change of magnetic flux and thus cause current to run through that coil.

Equipment:

  • Watts Up Pro to measure the needed power to run the power mat as well as to measure the power that is transmitted to the receiver coil in the external device.
  • Magnetic Field Sensor to measure the magnetic field around the coils.
  • Temperature Sensor to measure how the primary and secondary coils heat over time and with different power settings.

Roles:
Juan and Elijah will split up the work on collecting and analyzing data as well as the building of the device evenly. Juan will take care of most of the posts on this website.

Activity Plan:
9/23 – Use Watts Up Pro to measure electrical power and the magnetic field sensor for the magnetic fields present
9/24 – Analyze the data from the measurements
9/25 – Read research papers from Scopus covering WPT
9/26 & 27 – Prepare a plan for building the device and order needed materials
10/2 – Post data onto moodle
9/30-10/4 – Build the WPT device
10/5-8 – Collect data on our device
10/9 – Post data and project results onto moodle

Group 5 Work Plan

Equipment List:
x 1 High speed camera
x 1 Meter stick
x 1 Large metal ball
x 1 Small metal ball
x 1 Computer

Set-up of demonstration:

The basic idea is to have a bird’s eye view of the test model within a circular area with a specific radius where the smaller ball (the kinetic impactor) would be launched from a central launching point (assumed to be Earth) at a larger ball (the asteroid) to collide and deviate the larger ball off-course. There will be different speeds of the smaller ball to determine the optimal parameters necessary to deflect an asteroid coming towards Earth without catastrophic effects.

Week of September 23rd:

Monday

Diagram model for camera set-up.

Wednesday

Start filming deflector (kinetic impactor) model. Measure input data (how heavy are the objects and distance).

Friday

Continue filming. Extrapolate data from model to generate an asteroid of randomly generated dimensions for mathematical models.

Week of September 30

Monday

Model gravity and nuclear blast impact through mathematical equations.

Tuesday

Enter LaTex + data

Wednesday

Post.

Week of October 7

Monday

Write conclusion and compile results.

Tuesday

Post.

Group 4 – Wi-Fi Penetration through a Medium – Project Plan

Roles:

Charlie – Collect/manage data, location scouting, manage materials, research information

Richard – Collect/manage data, presentation editing work, file management, research information

Equipment/Supplies:

  • TES-593 electrosmog meter

  • Cell phone (with application for displaying dBm reading)

  • Wood blocks

  • Router

  • Laptop computers (used for documentation and data organization/presentation)


Science/Technology involved:

We will be examining the nature of a specific wireless communication technology known as Wi-Fi. Wi-Fi is a technology used in every almost personal device that accesses the Internet. It uses radio technologies called 802.11, and occupies specific bands of the radio spectrum: 2.4gHz and 5gHz. (Reference)

Radio power levels are measured in decibels (dB), which Cisco Systems defines as “the power of a signal as a function of its ratio to another standardized value.” Our consumer devices often give a reading of the signal strength as (dBm), which is a value compared with milliwatts. (Reference)

Activity Plan

We will be utilizing a TES-593 electrosmog meter. The meter is capable of measuring radio frequency (mV/m,V/m), magnetic fields (µA/m, mA/m), and power density (µW/m², mW/m², W/m², µW/cm², or mW/cm²). The frequency range for the ElectroSmog Meter is 10MHz to 8GHz. With the electrosmog meter, we will be measuring power field density.

To measure electrical power, we will be using a cell phone or laptop, which will provide readings in dBm

First, we will find a location where there is minimal outside interference.

Before we record our data, we will take a control value that accounts for ambient RF activity, since there will most likely be some sort of RF activity present in any locations on campus, due to the high concentrations of RF-emitting devices on campus (wireless networks, cell phones, radio towers, etc…).

When a test location is found, we can set up our experiment.

The router will be placed on one side of the room and powered on to broadcast a network that we will be connecting to in order to gauge its strength.

On the opposite side of the room, we will set up our receiving/measuring devices, which we will use to record data. Our laptops and our cell phones will be used along with a program that will allow us to measure the dBm readings. We will increase the volume of the wood blocks in front of the router and in front of the device, and record the changes in data.

Project Dates:

9/23, 2-4PM; 9/26, 4-6PM; 9/27, 5-7PM; 10/1, 4-6PM

Outcomes:

We believe the general trend will be a decrease in power field density (mW/m2) and a decrease in power level (dBm) that is related to an increase in the volume of the wood— a variable we will be altering and observing.

Exploring Near Field Communications

Abstract

“Near Field Communication” (NFC) is a set of wireless standards designed to establish communication between devices at a range of 0-5cm. NFC-enabled chips, known as tags, do not require batteries and are instead powered by induction of magnetic fields. When the magnetic field of one device passes close to another, the contactless energy transfer allows small amounts of data to be transferred between the tags. NFC chips are most frequently included in smartphones, enabling a plethora of use cases. Prominent utilizations include NFC-enabled boarding passes, event tickets, contact information sharing, and social media (i.e. tweeting, Foursquare checkins).

One significant limitation of NFC is its inability to function in close proximity to a metallic surface or other ground plane, which disrupts the magnetic signal. We will attempt to counteract this disruption by using different permeable materials to separate the NFC tag from a metallic surface. We hope to amplify or intensify the magnetic field utilized by NFC devices and potentially increase the range at which data transfers are possible by testing different casings and structures of permeable metals.

Materials

NFC tags of varied sizes, embedded in stickers
Thin metal sheeting (iron, steel, electrical steel, permalloy, cobalt-iron, mu-metal)

Schedule

9/19 – Inquire about materials from physics department
9/23 – Trip to the hardware store to find materials / testing
9/25 – Testing / data collection
9/30 – Testing / data collection
10/2 – Final data collection, collect and summarize results
10/7 – Write conclusion
10/9 – Any leftover work

Methodology

An average range of transfers between NFC tags without any metal backing will be established. Inoperability of data transfers when on a metallic surface will be tested and verified. Permeable materials to separate the NFC tag from a metal backing will then be introduced one at a time, and the average range of successful transfers will be recorded. Next, attempts to amplify or direct unadulterated (normal) transmissions with a housing or casing of highly permeable material will be made; the effectiveness of such housing, measured in range, will be noted.

Hypothesis

A surface of highly permeable metal placed between a grounding metallic surface and an NFC chip will increase the effectiveness (range) of data transfers. Metals more permeable by electromagnetic waves will allow for greater effectiveness.

Roles

We plan to share responsibilities other than the provision of a car, which falls to Toby.

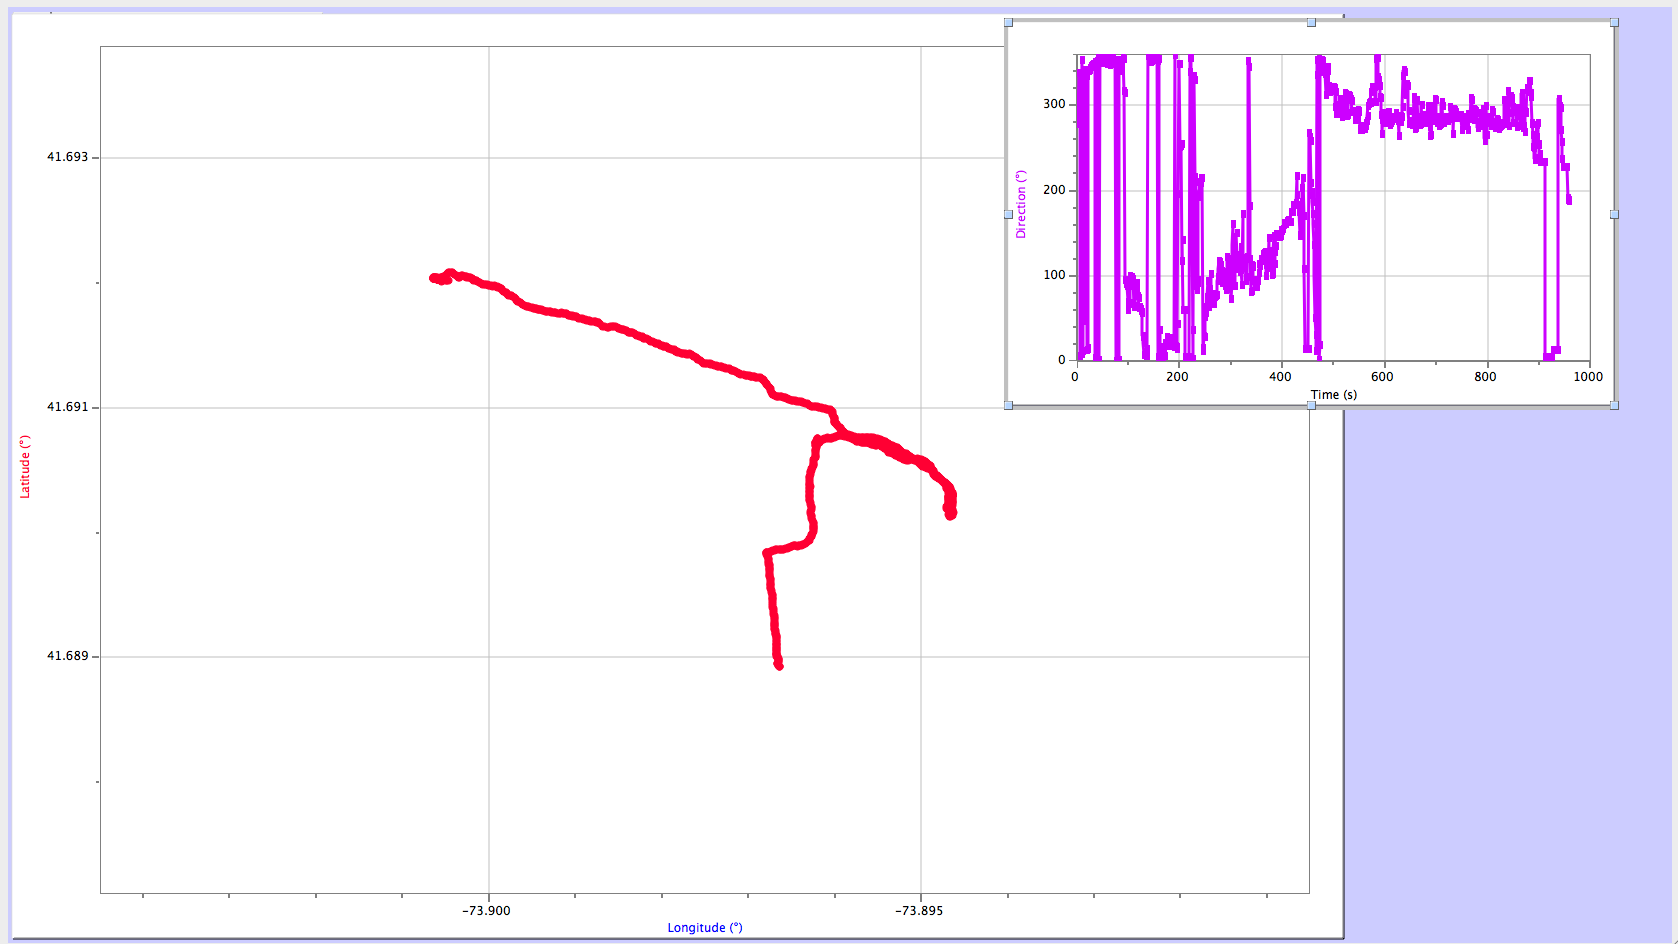
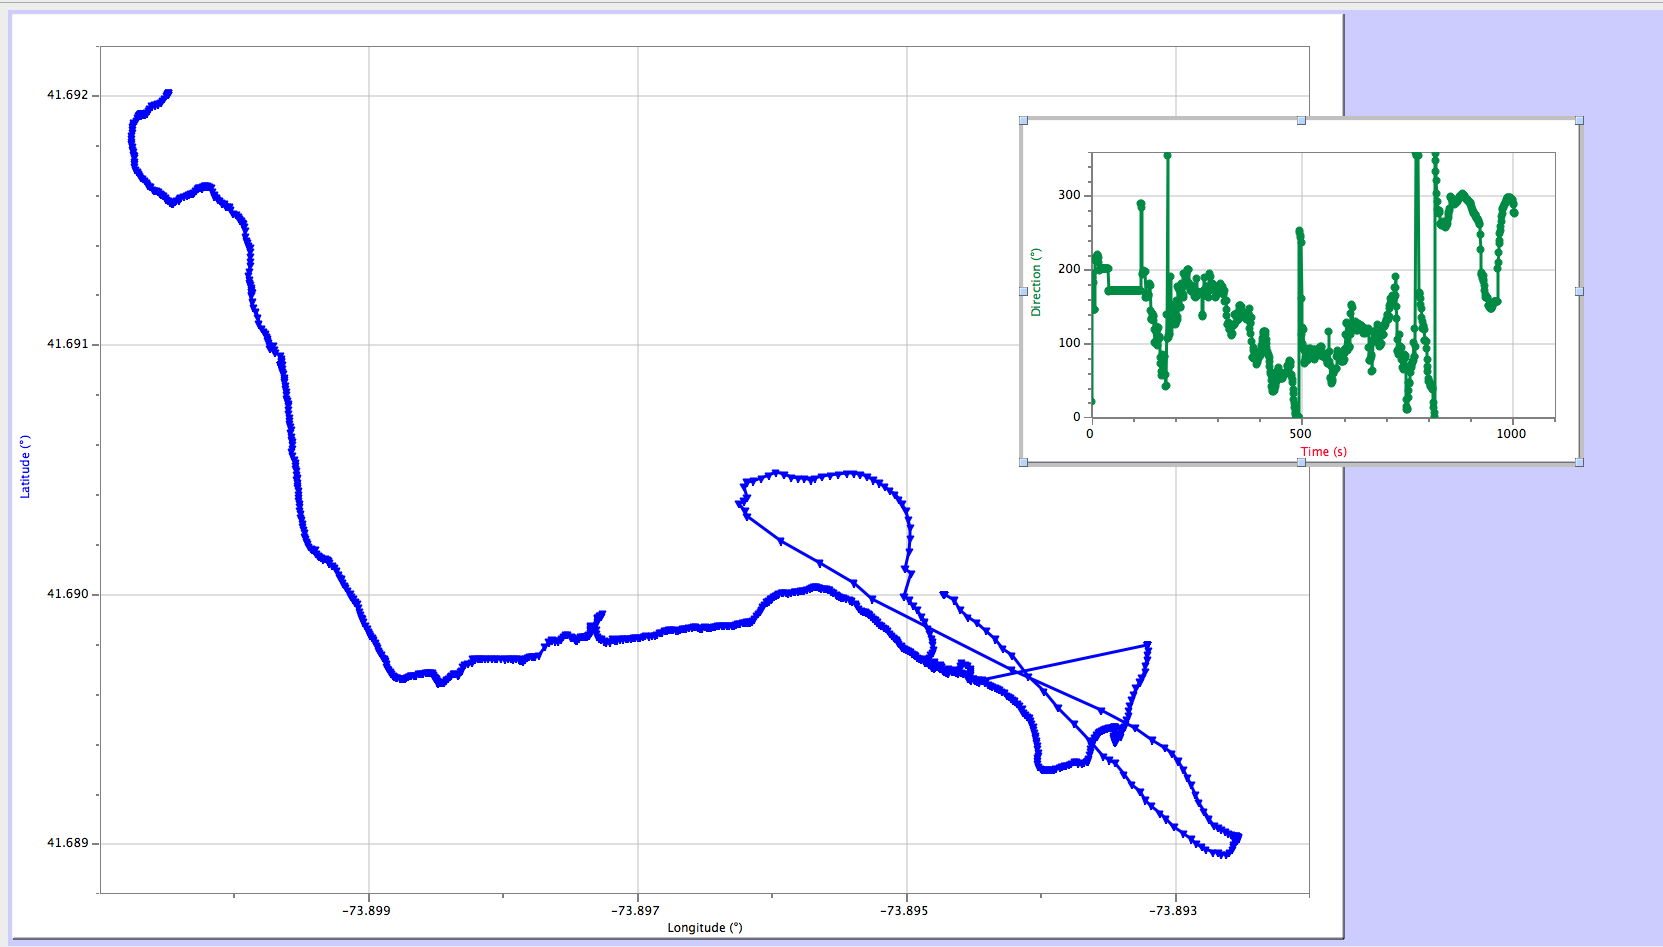
Group 10 Abstract/Plan..

I plan on using a GPS around campus going on a specific path first walking, and then bicycling. I will do this to measure altitude, speed, and distance throughout the campus. After collecting data, I plan to make some kind of artistic representation of the information. I would do this to make some kind of graph on top of a map using different colors to indicate various things. I would also want to include walking around various buildings, so i will most likely sketch those buildings as well and make  a graph over that as well.