What were your results?
-
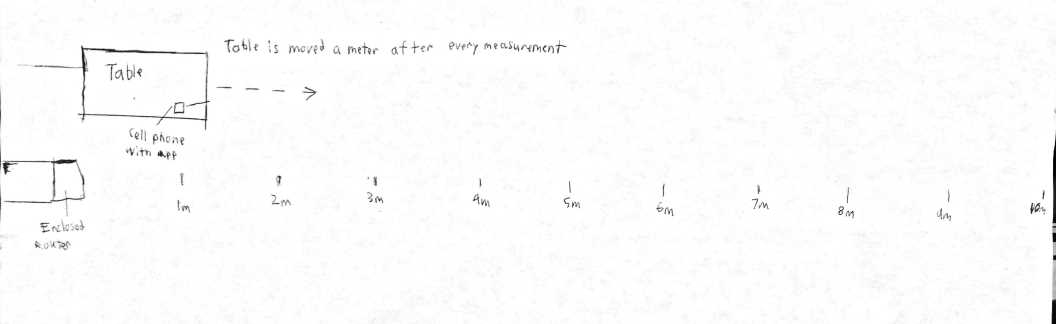
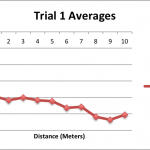
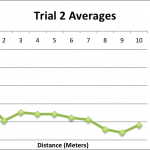
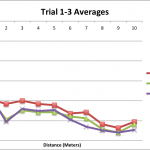
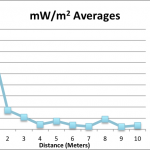
All the trials-including the RF meter trial-demonstrate the highest amount of readings 1 meter away from the wireless access point (WAP), and as expected, all three trials show a negative association between distance and dBm. As previously mentioned, these are the circumstances for each of the trials:
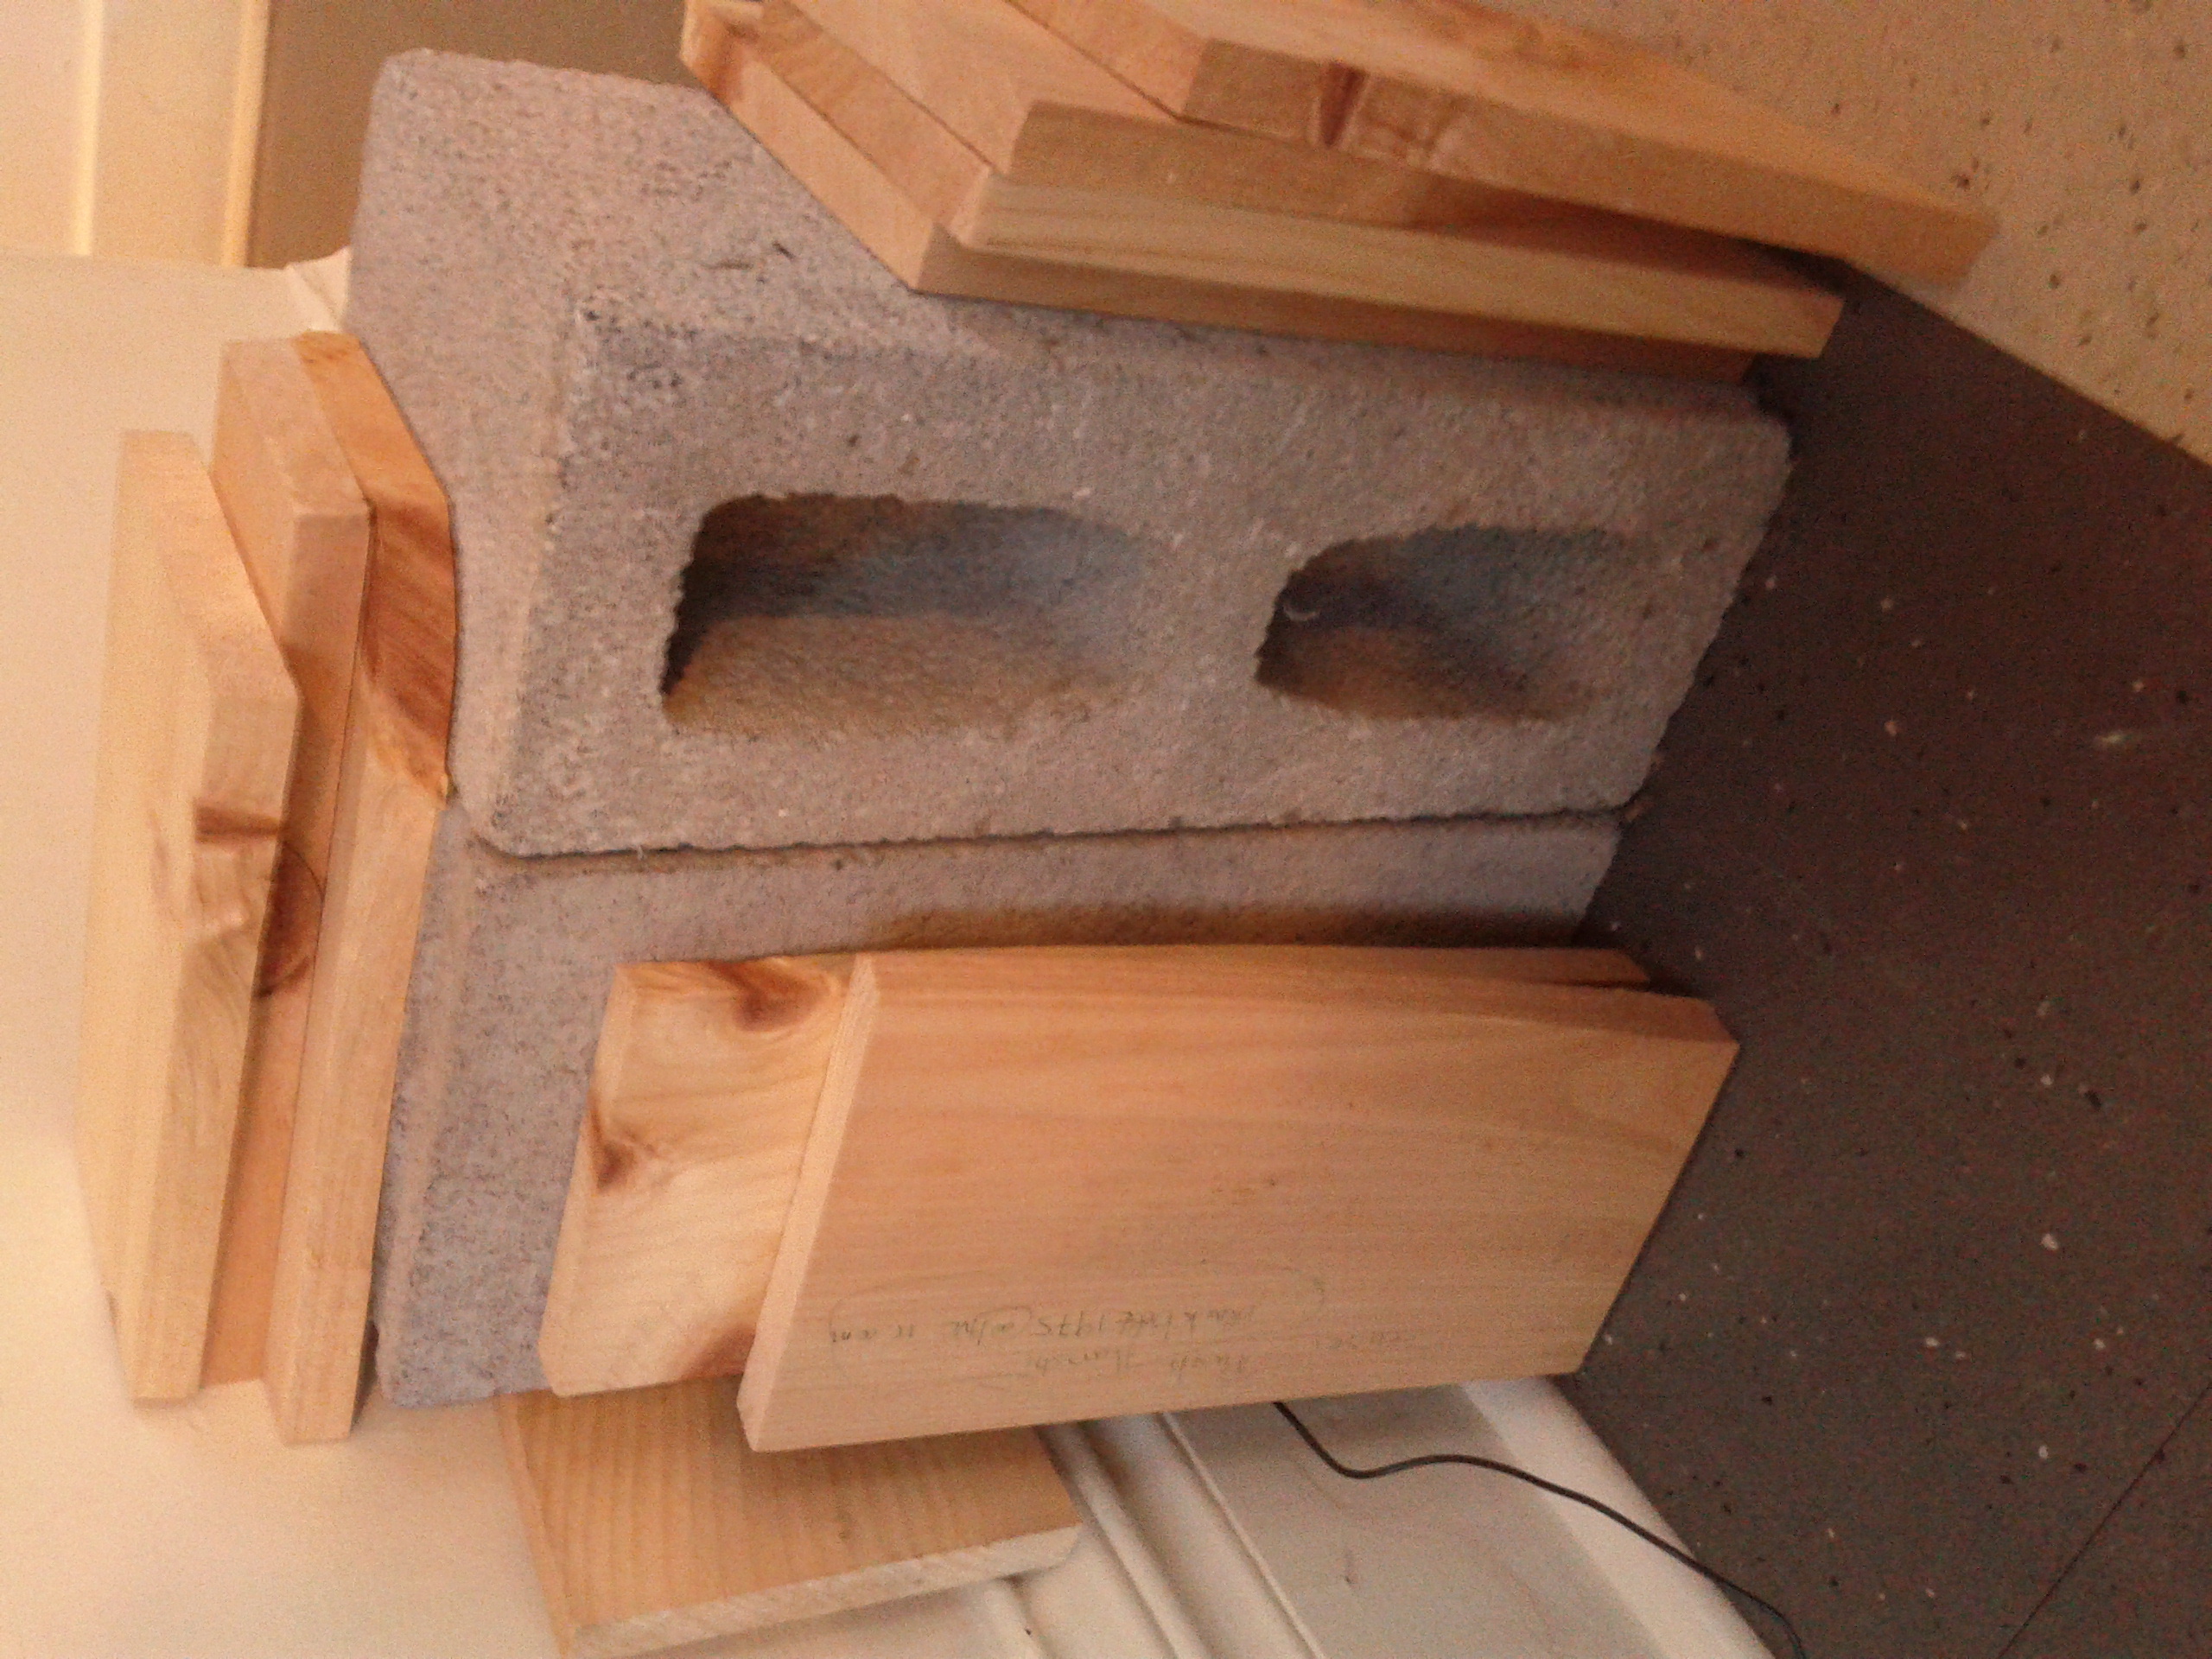
- Trial 1: WAP uncovered.
- Trial 2: WAP covered with cinder block.
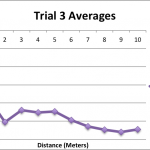
- Trial 3: WAP covered with cinder block and surrounded by 12 wood planks.
- Trial 4: RF electrosmog meter used, WAP uncovered.
Descending Values
-
We expected the signal strength to descend from Trial 1 to Trial 3, but instead, Trials 2 and 3 alternated in dominant strength between distances. There was an even split in averages, with 5 distance points of Trial 2 dBm readings being greater than Trial 3 dBm, and with 5 distance points of Trial 3 dBm readings being greater than Trial 2 dBm readings. Because of this even split, we are hesitant in reporting that increasing the volume of medium to an already-covered WAP decreases the signal strength.
-
A peculiar observation to note is that from 2 meters, trials 2 and 3 gave dBm readings that were significantly lower than the data of trial 1. Trial 1 at 2m yielded an average of -41.6dBm, while Trial 2 yielded -49.4dBm and Trial 3 yielded -50.6 dBm. The 2m was the distance that showed the largest gap in signal strength between Trial 1 and 2-3. Continue reading