Category Archives: Computer Power Consumption

Group 3 – Conclusion

After careful examination of our data, it can be concluded that increasing screen brightness does increase the power consumption of a laptop. However, while we hypothesized that changing the brightness would increase power consumption by a consistent ratio, we found no such consistency. In our data, we calculated that increasing brightness from 25%-100% increased wattage consumption by an average of 26%, but there were great deviations within this percentage. This was calculated by subtracting the wattage consumption at 25% brightness from the wattage consumption at 100% brightness, and dividing that number by the max wattage consumption.


Example Calculation for MacBook Pro (mid-2012, 15 inch w/ Retina Display):

18.5W-11.2W = 7.3W/18.5W= 39% decrease in power usage.

All the calculations were averaged together to receive a value of 26%.


This inconsistency may be due to several possible sources of error, including the running of background programs that we were unaware of, which could create a second variable affecting the recorded power values. Another possible source of error is equipment failure (as observed in Tori’s data but to a lesser, less noticeable degree). Our results show that, while decreasing the screen brightness of a laptop may decrease the power output of the computer, the decrease is slight and inconsistent.

The science we learned during our experiment included a fuller understanding of the scientific method, data collection methods, and data analysis through graphs. We also gained a better understanding of the relationships between voltage, current, and power, including V=IR (Ohm’s law) and P=IV.

If we conducted this project again, we would try to take more data points from many more laptops to create a broader relationship between screen brightness and power output. We would make more of an effort to control for accidental variables, like background programs. We would also start our research earlier, to give ourselves more time to collect more data and analyze it more thoroughly using LoggerPro.

If we were to conduct our research for 6 more weeks we would take data from many, many more laptops and we would expand our research to include laptops of other brands, like Toshiba and Sony, instead of limiting ourselves to only Apple laptops. We could also expand our data collection techniques to include other screen brightness levels, instead of only taking data at 4 different brightness levels. If we had more time, we would also closely examine the laptops with high power output to see if they were infected with viruses. This would provide a bigger picture of the relationship between screen brightness and power output.
 

Group 3 Graphs

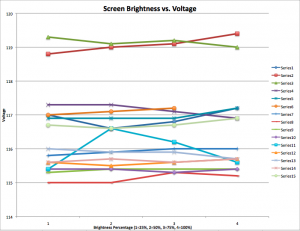
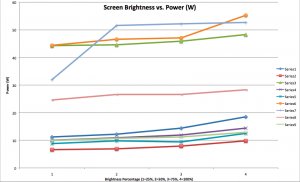
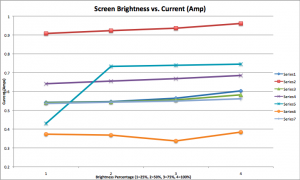
We graphed the output of power, current, and voltage for each laptop computer we received data from. We excluded all zero values, as we attribute those recorded values to a malfunction in the Watts Up Pro or human error while recording data. We can see from our graphs that power and current increase, if only slightly, when the screen brightness is increased. The voltage, however, does not seem to change much and does not have an overall trend of increasing or decreasing when the screen brightness was changed.

Picture 6 Picture 8 Picture 10

Group 3 Project Data

Model Power @ 25% Power @ 50% Power @75 % Power @ 100%
MacBook Pro (mid-2012, 15 inch w/ Retina Display
Volts 117 116.6 116.8 117.2
Amps 0.542 0.546 0.564 0.603
Watts 11.2 12.2 14.4 18.5
Apple MacBook Pro (13-inch, mid-2012) *Could this computer be affected by viruses?*
Volts 118.8 119 119.1 119.4
Amps 0.908 0.923 0.936 0.961
Watts 44.3 44.6 45.9 48.3
Apple MacBook Pro (13-inch, mid 2009)
Volts 119.3 119.1 119.2 119
Amps 0.54 0.544 0.555 0.582
Watts 10 10.9 11.9 14.4
MacBook Air (mid 2012, 13-inch)
Volts 117.3 117.3 117.1 116.9
Amps 0 0 0 0
Watts 0 0.1 0.1 0
MacBook Pro (mid 2012, 15-inch)
Volts 116.9 116.9 116.9 117.2
Amps 0 0 0 0
Watts 0.1 0 0 0
MacBook Pro (mid 2012, 15 inch)
Volts 117 117.1 117.2 0
Amps 0 0 0 0
Watts 0.1 0.1 0 0
MacBook Pro (2010, 13-inch)
Volts 115.8 115.9 116 116
Amps 0 0 0 0
Watts 0 0 0.1 0
MacBook Pro (mid-2012, 13-inch)
Volts 115 115 115.3 115.2
Amps 0 0 0 0
Watts  0  0  0 0
MacBook Pro w/retina (mid-2012, 13-inch)
Volts 115.3 115.4 115.4 115.4
Amps 0 0 0 0
Watts 0 0.1 0 0.1
MacBook Pro (late 2011, 13-inch)
Volts 115.4 115.4 115.3 115.4
Amps 0 0 0 0
Watts 0 0 0.1 0
MacBook Pro (13-inch, summer 2012)
Volts 115.4 116.6 116.2 115.6
Amps  0.556 0.578 0.582 0.587
Watts 8.8 9.8 9.4 12.5
MacBook (summer 2008, 13-inch) *Molly’s Computer Exhibits Very High Power Usage. She may want to check for viruses.*
Volts 115.6 115.5 115.6 115.7
Amps 0.641 0.655 0.668 0.685
Watts 44.4 46.6 47.1 55.3
MacBook Air (summer 2012,13-inch) *High Power Usage*
Volts 116 115.9 115.9 115.7
Amps 0.43 0.733 0.739 0.745
Watts 32 51.6 52.2 52.7
MacBook Air (summer 2012, 13-inch)
Volts 115.6 115.7 115.6 115.7
Amps 0.373 0.368 0.337 0.384
Watts 24.6 26.6 26.6 28.3
MacBook Air (mid 2011, 11-inch)
Volts 116.7 116.6 116.7 116.9
Amps 0.536 0.543 0.549 0.561
Watts 9.9 10.7 11.2 12.9
Every Laptop that we tested is some variation of Apple’s MacBook Pro or MacBook Air. Since Apple does not have specific “model numbers” for their laptops, we indicated the time that the laptop was released and the size of the screen. The data was taken using our Watt’s Up Pro’s supplied by Prof. Magnes. Electrical power is measured in wattage, which is equal to the voltage (volts) multiplied by the current (amperes). Amps are equal to the amount of electrical charge passing through a circuit per unit of time, with 6.241x 10^18 electrons per second being equal to one ampere.  We measured the watts, amperes, and volts of each laptop with screen brightness at 100%, 75%, 50%, and 25%. Each laptop had every application closed except for Safari’s homepage, which was what was on the display for every measurement. There are some glitches in the current data. Tori’s Watt’s Up Pro gave measurements of approximately 0 for both amps and watts for a reason that is still under investigation. It is possible that the device was not configured correctly for reading current, as power = voltage x current, and a zero value for current would cause a calculated wattage to be zero as well. Some laptops, including Molly’s 2008 MacBook and the 13-inch mid 2012 MacBook Pro gave very high readings for watts and amps. We are considering possibilities for this outlying data, including the chance that viruses are causing the computers to run less efficiently or dysfunctional batteries. We will graph the data for each type of laptop, but it is clear from our data tables that increasing brightness consistently increases power usage. This is consistent with our original hypothesis. Amps also increase consistently, but voltage does not vary directly according to screen brightness. This makes sense since voltage is only the electric potential difference between two points.References:

December 2010 – By Steven S. Zumdahl, Susan A. Zumdahl – Brooks/Cole, CENGAGE Learning – 2010.12.17 – Hardback – 1,038 pages – ISBN 0840065329

Group 3 Project Plan


Roles:

Each member of the group will collect the same amount of data. We will each analyze 7 Apple Brand laptops. The laptops we examine will be MacBooks, MacBook Pros and MacBook Airs from 2008 onward. We will then all work together to analyze the collected data through the use of graphs. From our analysis we will collectively write a conclusion explaining our results.


List of Equipment and Supplies:

  • WattsUp? Pro (3)

  • Apple Laptops (21)


Science and Technology:

Through the use of the WattsUp? Pro, we will determine the the power usage of different laptops using different brightness configurations. Since power=energy/time, we will determine how much energy the laptops use of a period of one hour by using the WattsUp? Pro’s energy measuring capabilities. This information is extremely applicable to daily life because it can be used to calculate how much it will cost to run a laptop on different brightness levels, as well as how rapidly the laptop’s battery will be exhausted based on its brightness. This can help users decide how much battery they can actually save by lowering brightness and adjust the brightness levels to their needs.


Activity Plan:

The first part of our project will be to collect the data about the laptops’ screen brightness. Each member of the group will collect the same amount of data using the WattsUp? Pro. We will each record the power usage of Apple Laptops, including MacBook Pros and Airs of different models, at approximately 25%, 50%, 75%, and 100% brightness and then combine our data into one aggregate. We will collect our data during the week of 9/23-9/28, and then meet the following week (9/30-10/5) to combine and analyze our data. We will finalize our project and draw conclusions from our analysis during the week of 10/7.


Expected Outcomes:

We expect that lowering the brightness of the screen will significantly decrease the battery consumption on every laptop that we test. We anticipate that lowering the brightness will decrease battery consumption at a consistent ratio.


Group 3 Abstract

Our group will perform data collection using the WattsUpPro device to determine the battery usage of different laptops at different screen brightness levels. We will use the laptops of our peers to get a sampling of a variety of different models of MacBook laptops, since this is the most widely used laptop on campus. Our goal is to determine how much changing the brightness level actually effects battery consumption and if it is worth it to lower brightness and cause unwanted eye strain.We expect that lowering the brightness will decrease battery consumption at a consistent ratio. We want to determine how much different screen brightness levels actually affect how quickly a laptop battery will die.