The results of our research of current radiation levels around Japan’s Fukushimadaiichi nuclear plant leads us to several conclusions about the effects on people who receive contact with nuclear radiation.
We posted the analysis earlier along with your data. Below, are the conclusions we came to based on the data we collected from TEPCO and other sources that recorded radiation levels near Fukushima as well as Tokyo:
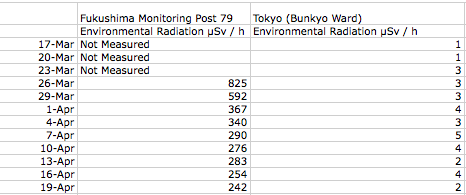
How does this compare to average radiation levels? Looking at the most current statistics (April 19):

mircoSv/ day = Reading of the integrated dose (as seen above)
1. Fukushima Monitoring Post
10.8 microSv/hour (242 microSv/day = same as round-trip flight from New York to Los Angeles)
à 242 microSv/day = 88330 microSv/year = 88.3 times annual average dose limit)
2. Tokyo
0.075 microSv/hour (1.8 microSv/day = 657 microSv/year = 65.7% annual dose limit)
As you can see, the levels reported near fukushima are still dangerously high and prove to be very harmful for people who are exposed to it daily. As David posted earlier, we used a Geiger counter to compare it to levels that we, as Vassar students, experience around campus and with daily technology:
David’s data conclusions:
To give you an idea of just how small these amounts are, here are some facts about radiation exposure (taken from Reuters):
People are exposed to natural radiation of 2-3 mSv a year.
In a CT scan, the organ being studied typically receives a radiation dose of 15 mSv in an adult to 30 mSv in a newborn infant.
A typical chest X-ray involves exposure of about 0.02 mSv, while a dental one can be 0.01 mSv.
Exposure to 100 mSv a year is the lowest level at which any increase in cancer risk is clearly evident. A cumulative 1,000 mSv (1 sievert) would probably cause a fatal cancer many years later in five out of every 100 persons exposed to it.
1 mSv (millisievert) is equal to 100 mR, so we are exposed to 200 – 300 mR/year. A chest X-ray exposes us to 0.02 mSv, or 2 mR. It would take roughly four days of nonstop exposure to a device that emits radiation at 0.02 mR/hr to receive as much radiation as is emitted by an X-ray in one sitting. Even so, this amount is 1/50 of the lowest level at which there is an increase in cancer risk.
On March 26, at Fukushima Monitoring Post 79, radiation was being emitted at a rate of 825 μSv (microsievert)/hr, or 82.5 mR/hr; that’s 0.83 mSv/hr, which means that if you were exposed for four or five days, you would approach the lowest level of radiation for cancer risk.
In conclusion, the distance away from the radiation epicenter and the wind direction relative to your location can prove to be crucial for determining the amount of radiation one is exposed to. However, it seems that residents in Tokyo, the most populated city in Japan, seem relatively safe from such exposure. We hope that this data and our conclusions have given our readers a comprehensive analysis of the often overwhelming nuclear data that is available on the internet from established sources. Thank you.
 ,
,  , and
, and  radiation levels in buildings around Vassar College’s campus, although the possible type of radiation detection depends on the availability of appropriate sensors. In particular, we plan to focus on the comparison of radiation levels to the age of the building in question. We know that Sanders Physics has historically had
  Using a handheld Geiger counter, I tested 15 items/appliances for radiation. The results were somewhat unvaried, ranging from 0.01 to 0.03 mR(millirem)/hr .