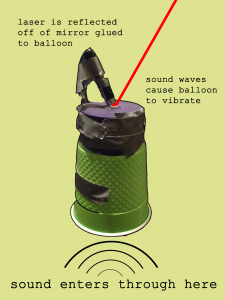
For our project, we build a device to convert sound waves into patterns of laser light:
We recorded each member of the team saying a standard sentence into the device, and then took a video of the resulting pattern. We also took data regarding the volume (dB) and frequency (Hz) of each speaker.
Displayed here are three different voice recordings of one sentence, “the quick brown fox jumps over the lazy dog.” This sentence was chosen because it contains all the letters of the alphabet and would hopefully provide variation in the laser patterns produced. The patterns of one boy’s voice and two girls’ voices were measured. As seen in the video clips, deeper/lower voices/frequencies created a larger, circular laser pattern; higher pitched voices created a smaller ring-shaped pattern and also figure 8 shapes, as well.
Elizabeth’s Sentence:
https://www.youtube.com/watch?v=m9ENLdIsWEE
Tim’s Sentence:
https://www.youtube.com/watch?v=xmMI7v_tTAY
Becca’s Sentence:
https://www.youtube.com/watch?v=e32lND-hDtc
The length of the sentence was about four seconds. The data recorded includes the video of the laser patterns, the audio recording, and the decibel recording, as well.
While further playing around with the device, we found that “P” noises (like the word “pop”) elicit a large circle, whistling into the cup and also playing music through an iPhone (classical and also bass/drum heavy) do not vibrate the balloon enough for much of a visible laser response.
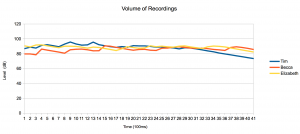
Decibel levels of each speaker’s sentence:
Frequency plot of Elizabeth’s voice:

Frequency plot of Tim’s voice:

Frequency plot of Becca’s voice:
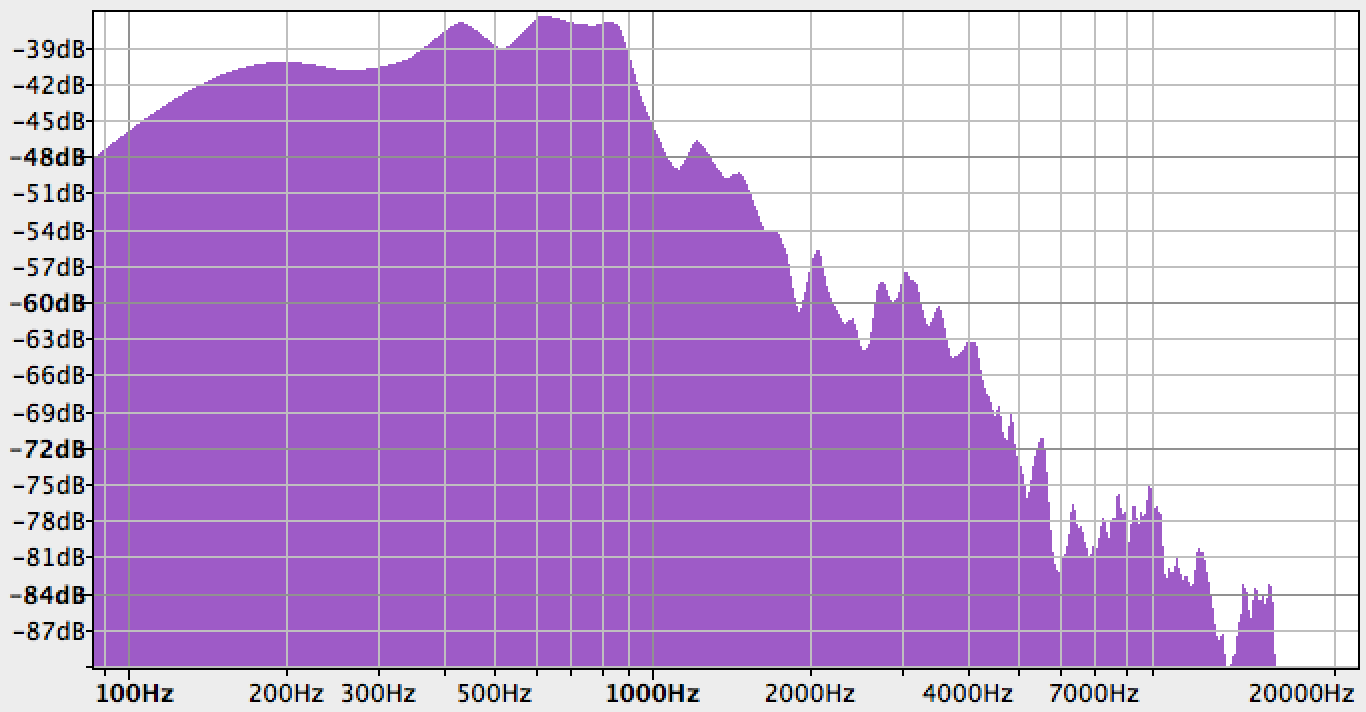
Looking at Tim’s frequency plot, there is a steep drop-off after 500Hz. This lines up with our observation that lower frequencies had more of an impact on the laser pattern, as his was much larger than the other two.
Decibel level did not have a discernible effect on the results. Much more important was the low frequencies.
We also recorded each member singing a set of three notes:
Elizabeth Singing:
https://www.youtube.com/watch?v=uid7DxSwILI
Tim Singing:
https://www.youtube.com/watch?v=PmNV-3TheHo
Becca Singing:
https://www.youtube.com/watch?v=TrzbCNEhFUcProblems Encountered:
-The correct assembly of the device. For instance, less stretched balloon drum on top of the cup responded better to sounds. The application of the piece of mirror to the balloon drum was best executed using glue instead of tape, which buffered and absorbed some of the vibrations of the balloon, desensitizing the mirror and laser’s responses. The size of the mirror was also important–the heavier and larger the mirror piece, the less it would respond to vibrations. The material for the cup was also important and plastic works best (over paper). Mounting the laser onto the cup using a paperclip was best done by unfolding the clip to have two legs to tape to the cup, rather than one.
-The distance of the device and input source from the observation point, a black board. A distance of about 12.5 feet worked well for us; a longer distance increases the amount of the pattern seen.
-Playing music from a phone didn’t have enough low frequencies to move the laser a discernible amount.
This is a very interesting experiment, which could be taken into many directions. A lot of your observations are qualitative with a lot of potential for further measurements. Of course, your limited time for this project does not allow for more measurements; however, here are some considerations for writing your conclusion. You had three human voices, one of which was a male voice. While you saw a trend, it would be good to consider if a larger sample size; i.e. more males and females would confirm your assertions. Even though you didn’t name the phenomenon directly, it seems that the male voice tends to be more in resonance with the stretched balloon; or the female voices consist of fewer frequencies. You might want to read up on resonance modes. I can’t wait until next week to read your conclusions.