Below are the approximate integrated doses of radiation detected at the Fukushima Monitoring Post 79 and in Tokyo (the Bunkyo Ward where levels were measured by Tokyo University)
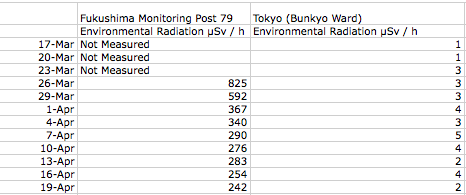
Why did we choose to use Fukushima Monitoring Post 79?
Fukushima Monitoring Post 79 is Located 30 KM NW away from the Fukushima Daiichi Power Plant. Because most of the wind moved northwest in the days and weeks after the initial incident, this was the most reliable place to test the radiation levels for the immediate area.
We also decided to compare these numbers to Tokyo, as a way to see the effective difference between the area surrounding Fukushima and Japan’s capital city (located approx 1,000KM away)
How does this compare to average radiation levels? Looking at the most current statistics (April 19):

mircoSv/ day = Reading of the integrated dose (as seen above)
1. Fukushima Monitoring Post
10.8 microSv/hour (242 microSv/day = same as round-trip flight from New York to Los Angeles)
à 242 microSv/day = 88330 microSv/year = 88.3 times annual average dose limit)
2. Tokyo
0.075 microSv/hour (1.8 microSv/day = 657 microSv/year = 65.7% annual dose limit)
Data Sources:
http://www.tepco.co.jp/en/nu/fukushima-np/index-e.html#anchor01
http://www.mext.go.jp/english/radioactivity_level/detail/1304082.htm
http://www.mext.go.jp/english/radioactivity_level/detail/1304080.htm