(1) 
The Original Question
Inspired by the the NEOShield project, we wanted to find out: when a near-Earth object (NEO) is about to impact, what do we do? There are a few choices for mitigation measures available to us in the modern age:
1) Kinetic impactor
2) Gravity tractor
3) Blast deflection
So given these three choices, our group wanted to determine which one is simply the most cost-effective. To this end, we randomly generated two asteroids and their dimensions (using diameters 40m and 4.1km and mean known densities of asteroids, which was 4.95g/cc). It is highly unlikely to have an asteroid of 4.1 km, but we had the two asteroids on opposite ends of the spectrum in terms of size and mass so that the goal was to have the range in order to estimate what to do for any asteroids that lie in between the two extremes.
The Methods
Cost-Effectiveness
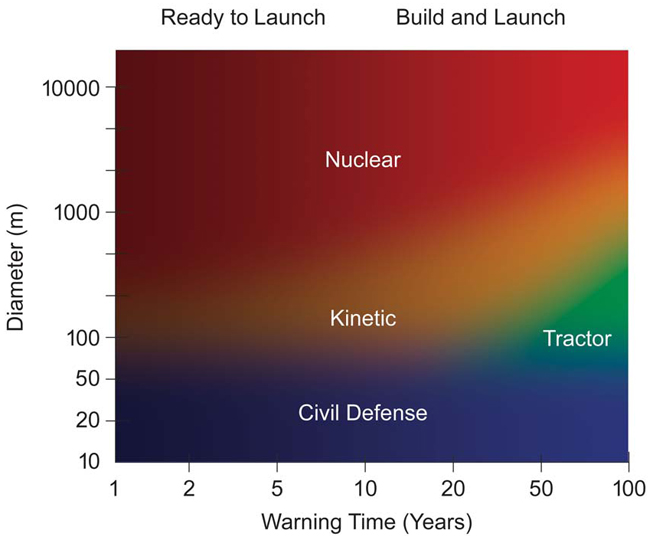
Source: the NEOShield Project
The figure above shows the amount of time that we need to know ahead given an asteroid’s size and the most likely way to prevent collision. For the fastest deployment, as suggests by the graph, the fastest would be a nuclear warhead, followed by a kinetic impactor and lastly the gravity tractor. From a cost point of view, the cost of sending each object into space would be around the same, but the cost of building each one ranks (from most expensive to cheapest): nuclear bomb, gravity tractor (which is just a satellite), and kinetic impactor (an object with a propeller). Under these criteria, the kinetic impactor is the most cost-effective with moderate time-constraints and moderate asteroid sizes. The major drawback for gravity tractors is that it takes too long for the effect to take place, and it requires an extremely accurate location of the asteroid and maneuvering of the satellite to put it in an optimal position for using gravitational force to redirect the asteroid. However, to be able to obtain the location information is far beyond any form of accurate sensor range in our current state of technology and can only yield estimates, which do not provide adequate intelligence for effective gravitation. For nuclear warheads, there is the problem of safety and post-blast repercussions. If the asteroid just happens to have a fault running through the middle (as dramatized in the film Armageddon), the blast and shockwave that comes from the bomb would cause the asteroid to split into two large pieces and create even larger destruction. For a kinetic impactor, as supported by the calculations we made in the data section, as long as the impactor is moving at a sufficient velocity (which can be achieved with ease due to the lack of friction in space), it can successfully cause an asteroid of any size to miss Earth, given enough distance and time between the Earth and the rock.
The Answer
After evaluating the three methods of preventing collision, kinetic impact is certainly the most cost-effective. It must be said that in terms of pure effectiveness, a nuclear detonation would have the most impact on the asteroid, but there are too many political implications and destructive consequences that come with nuclear explosions. For the cleanest and safest method, gravity traction is most preferable, but due to the lack of technology and accurate information, it is no doubt the least effective, not to mention the amount of time and effort needed to ensure the most effectiveness (already insignificant compared to kinetic impact and blast deflection) that it will have upon the asteroid.
What Did We Learn?
Even though preventing a world-wide catastrophe caused by an asteroid sounds like a big deal (which it really is), the science behind the idea of pushing an asteroid away is really based on simple classical physics principles (mostly Newton’s Second Law). Through this project, we were able to learn what people on Earth would have to do to avoid asteroid collisions and the amount of efforts needed in order to achieve safety. Through calculations, we learned just what magnitudes that we will be dealing with when it comes to asteroids and potential elimination of the human race. By doing this project, we also acquired skills of modeling and applying what we have learned before in physics to novel situations such as the one we wanted to investigate.
If We Were to Do This Once Again:
For the demonstration that we filmed, we would definitely change the components. The surface we used had a lot of friction (pool table) even though it gave a lot of control in terms of the direction the ball rolled in. Additionally, we would like to try to have a moving kinetic impactor representation to create a demonstration closer to the actual situation of kinetic impact on an asteroid. It would be nice to be able to use metal ball bearings on a slippery surface to represent the asteroid and impactor and minimize friction.
Plan
Our goal in pursuing a project with NFC devices was to further understand the technology and to see if we could amplify the signal of NFC devices to boost the range of data transfers. We planned to do this by inserting thin sheets of metal with high magnetic permeability between the NFC device and a regular metal object, which under normal circumstances grounds the magnetic field and makes data transfers impossible. When we were unable to acquire the appropriate materials to do this testing, we pivoted our focus to testing how placing an NFC chip (tag) on materials of varying electromagnetic permeability affected the range of NFC transfers. We predicted that when placed on an object with high permeability like ferrite, an NFC tag would be capable of transferring data at greater distances than when placed on objects of lower permeability.
Testing
To test the effect of a material’s permeability on the range of the transfer, we first looked at the range at which data transfer was possible without backing. Using a ruler, we measured the distance between the NFC tag and the NFC reader device. The NFC reader reader device was a NFC tag powered by the battery of a smart phone. We did several trials to establish an average distance for data transfers when the standalone NFC tag had no backing. In each test, we moved the NFC reader from out of transfer range towar the NFC tag until the rader device registerd the NFC tag, signifying a data transfer was successful. We then measured the distance between the reader device and the NFC tag when transfer was established. This operation was then repeated with different backing materials.
Results
We found an average of 3.645 cm for data transfer to be possible when the NFC tag had no backing. Data transfer between the NFC tag and the reader was impossible when the tag had a stainless steel backing. Trials with a 10 cm iron backing showed a smaller range of data transfer with an average of 1.72 cm. We then found an average of 4.115 cm for a 1.2 cm glass backing, 1.98 cm for a 16 mm ferrite backing and 3.325 cm for wood backing. Interpretation We hoped that our testing would show a positive correlation between permeability and range of data transfer. These hopes were burned to the ground after several rounds of testing with different materials, when it became clear that our data was inconsistent with average permeabilities of our materials.
| Materials | Avg. Permeability | Avg. Range for data transfer |
| Vacuum | π4E-7 (1) | Untested |
| Air | 1.2566375E-6 (2) | 3.645cm |
| Wood | 1.25663760E-6 (3) | 3.325cm |
| Iron | 6.28E-3 | 1.72cm |
| Ferrite | >2.0E-5 (varied depending on composition) | 1.98cm |
| Glass | 4.86E-15 | 4.115cm |
| Austenitic Stainless steel | 1.05-1.1 | No transfer |
We hypothesized that greater permeability would ad to greater transfer distance, but as the test results show, our data was completely unpredictable. For example, when testing with the permeable metals iron and ferrite, we expected to see a greater transfer distance when the NFC tag was placed on ferrite, the permeability of which is on average far higher than most iron. Additionally, though non-magnetic materials like wood, glass, and air would normally be expected to achieve similar averages, tests with glass produced a surprisingly higher average of data transfers than the other nonmetal materials. Austenitic stainless steel backing didn’t allow data transfer because it is non-magnetic.
Analysis
What can account for these inconsistencies in our results? Unfortunately, there were too many uncontrolled and unknown variables that could have affected our tests to provide any one specific explanation. The quality and composition of metals used in the tests are unknown; ferrite, for example, has a wide range of permeability depending on the ratio of its components. Purity of iron affects its permeability as well, and there are a variety of stainless steels with variable permeability. Permeability is also affected by temperature, and our inability to control the temperature of the test area could have accounted for statistical discrepancies. Human error in the form of misreading a taken value or changes in how the NFC tag was held are also possible sources of confusing data.
Science
We were able to learn about the technology that powers NFC transfers in our research and experimentation, as well as the differences between NFC and similar wireless transfer technology like RFID. We also learned about electromagnetic permeability. Unfortunately, we did not find that in specific cases permeability affected the electromagnetic field of the NFC chips in a meaningful way.
Next Time
If we were to conduct this experiment again, we would acquire materials from sources that provided details on the composition of said materials in order to properly ascertain their actual permeabilities. Ideally we would be able to acquire thin foils of permeable metal so we could follow up on our original plan of adding a thin layer between the NFC tag and a grounding metal object. If we had another 6 weeks, we could attempt to build a rudimentary signal amplifier by altering a ham radio (suggestion courtesy of Larry Doe).
References
All the trials-including the RF meter trial-demonstrate the highest amount of readings 1 meter away from the wireless access point (WAP), and as expected, all three trials show a negative association between distance and dBm. As previously mentioned, these are the circumstances for each of the trials:
We expected the signal strength to descend from Trial 1 to Trial 3, but instead, Trials 2 and 3 alternated in dominant strength between distances. There was an even split in averages, with 5 distance points of Trial 2 dBm readings being greater than Trial 3 dBm, and with 5 distance points of Trial 3 dBm readings being greater than Trial 2 dBm readings. Because of this even split, we are hesitant in reporting that increasing the volume of medium to an already-covered WAP decreases the signal strength.
A peculiar observation to note is that from 2 meters, trials 2 and 3 gave dBm readings that were significantly lower than the data of trial 1. Trial 1 at 2m yielded an average of -41.6dBm, while Trial 2 yielded -49.4dBm and Trial 3 yielded -50.6 dBm. The 2m was the distance that showed the largest gap in signal strength between Trial 1 and 2-3. Continue reading
How did we take our data?
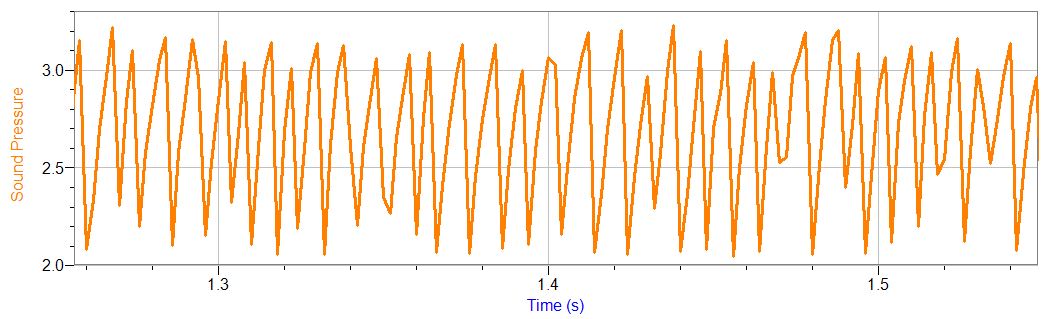
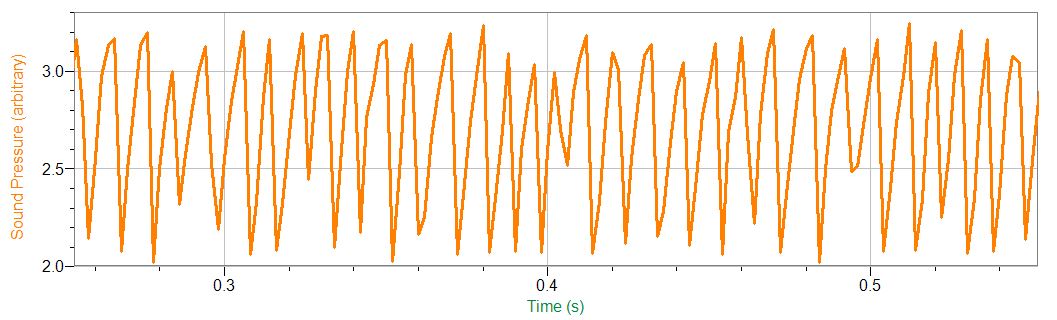
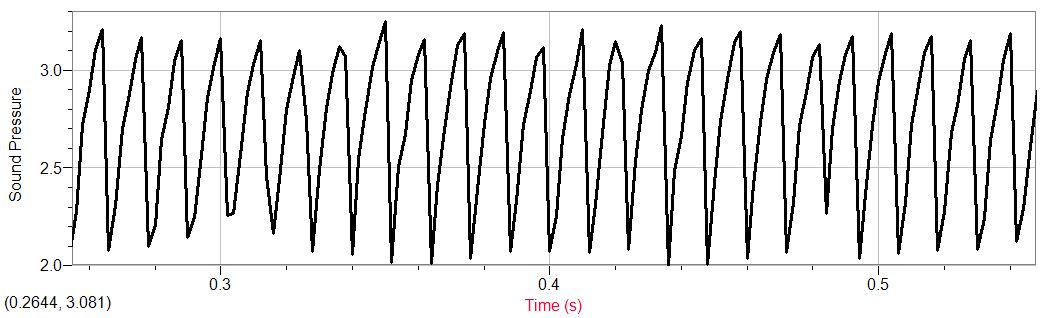
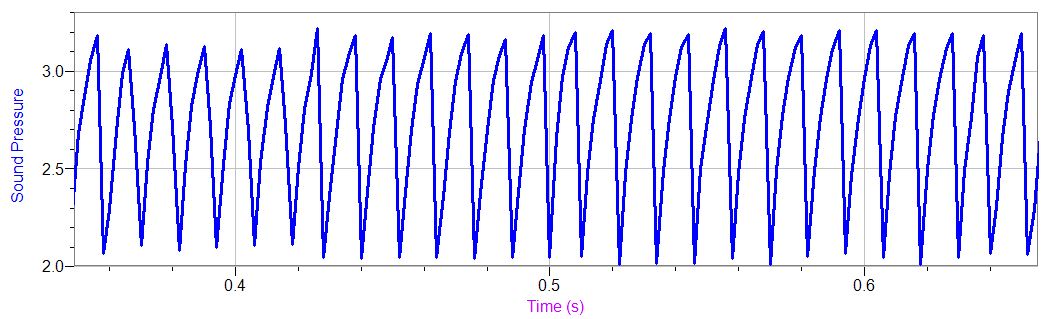
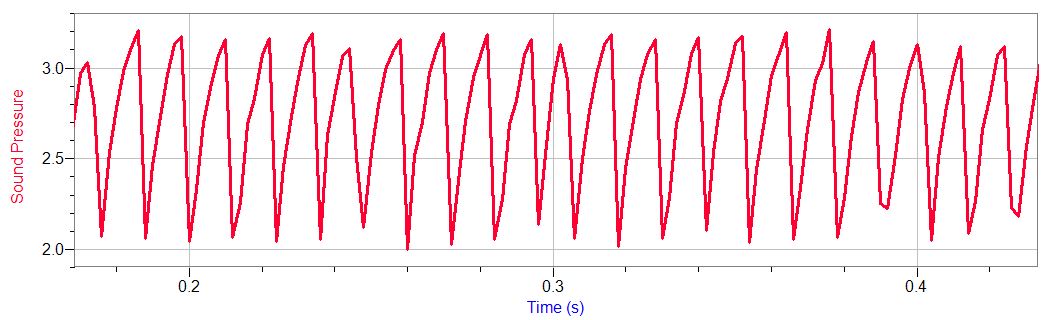
Using a LabQuest, with microphone and sound level meter sensors, we recorded a single tone (of the musical note C), played by each instrument: piano, flute, and guitar. We also recorded tones (again, the note C) created by two different synthesizer programs: one an FM synthesizer, and one an Analog synthesizer. Our data tables are not posted here on the blog, as each table would have around 500 points of data. Instead, below is our data represented in graphical form created by LoggerPro.
All of our data was taken in the same, quiet environment with the hopes of minimizing ambient noise. We used a Steinway piano, a Yamaha flute, and a Taylor guitar. We used a free online program, called AudioSauna, which provided us with the synthetic tones we needed for each instrument, both FM and Analog.
Given that the known frequency of the note C is around 261.6 Hz, we took our recordings at a rate of 500 samples per second. We first attempted to record at a rate of 1000 samples per second, but we were limited by the capabilities of our LabQuest. Therefore, the graphed waveforms from our recordings may not represent the subtleties in the differences between acoustic and synthetic (both analog and FM) waveforms.
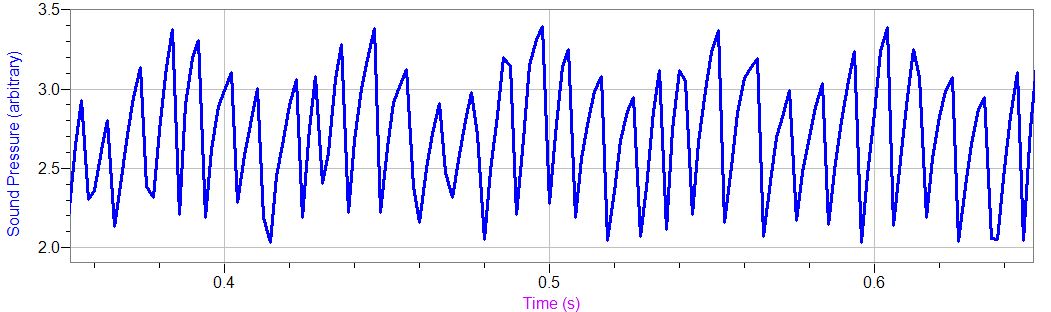
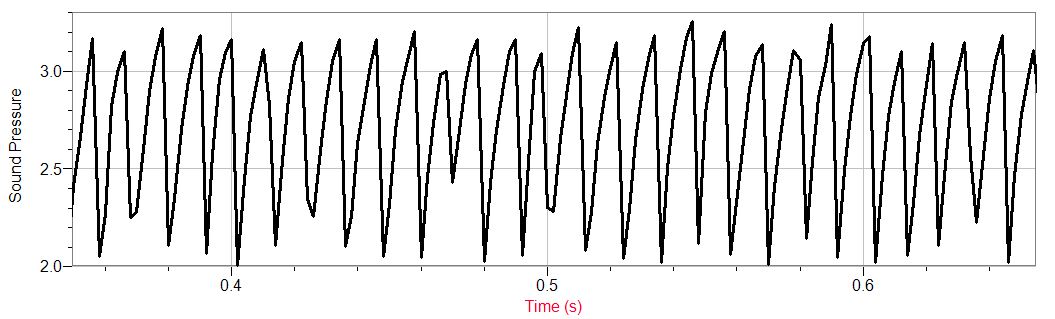
In general, the graphs of the synthetic tones– but especially the FM synthetic tones– showed more uniform waves relative to those of the acoustic tones. The acoustic tones seemed to form a sort of pattern over time, with more variance in the sound pressure. These patterns and variance may be caused by interference of the different harmonics that constitute the tones of acoustic instruments. The LabQuest and LoggerPro did not give default units for Sound Pressure, but deemed them as “arbitrary.”
More details and analysis to come on Friday!
PIANO
Acoustic Piano
Analog Synth Piano
FM Synth Piano
FLUTE
Acoustic Flute
Analog Synth Flute
GUITAR
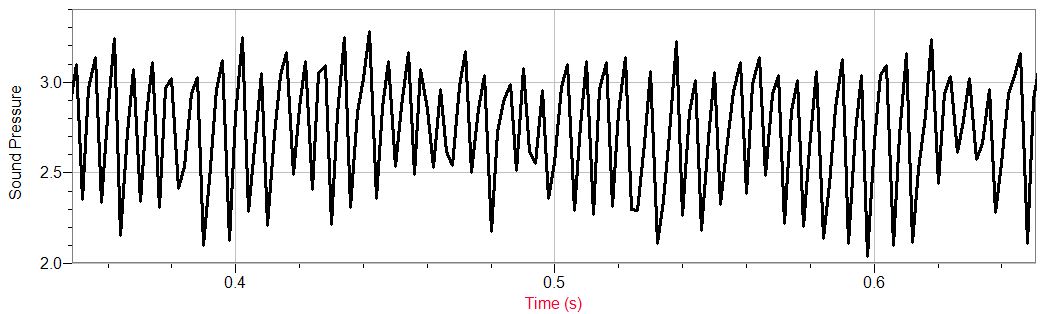
Acoustic Guitar
Analog Synth Guitar
FM Synth Guitar
Social Widgets powered by AB-WebLog.com.