Data Collection Methods:
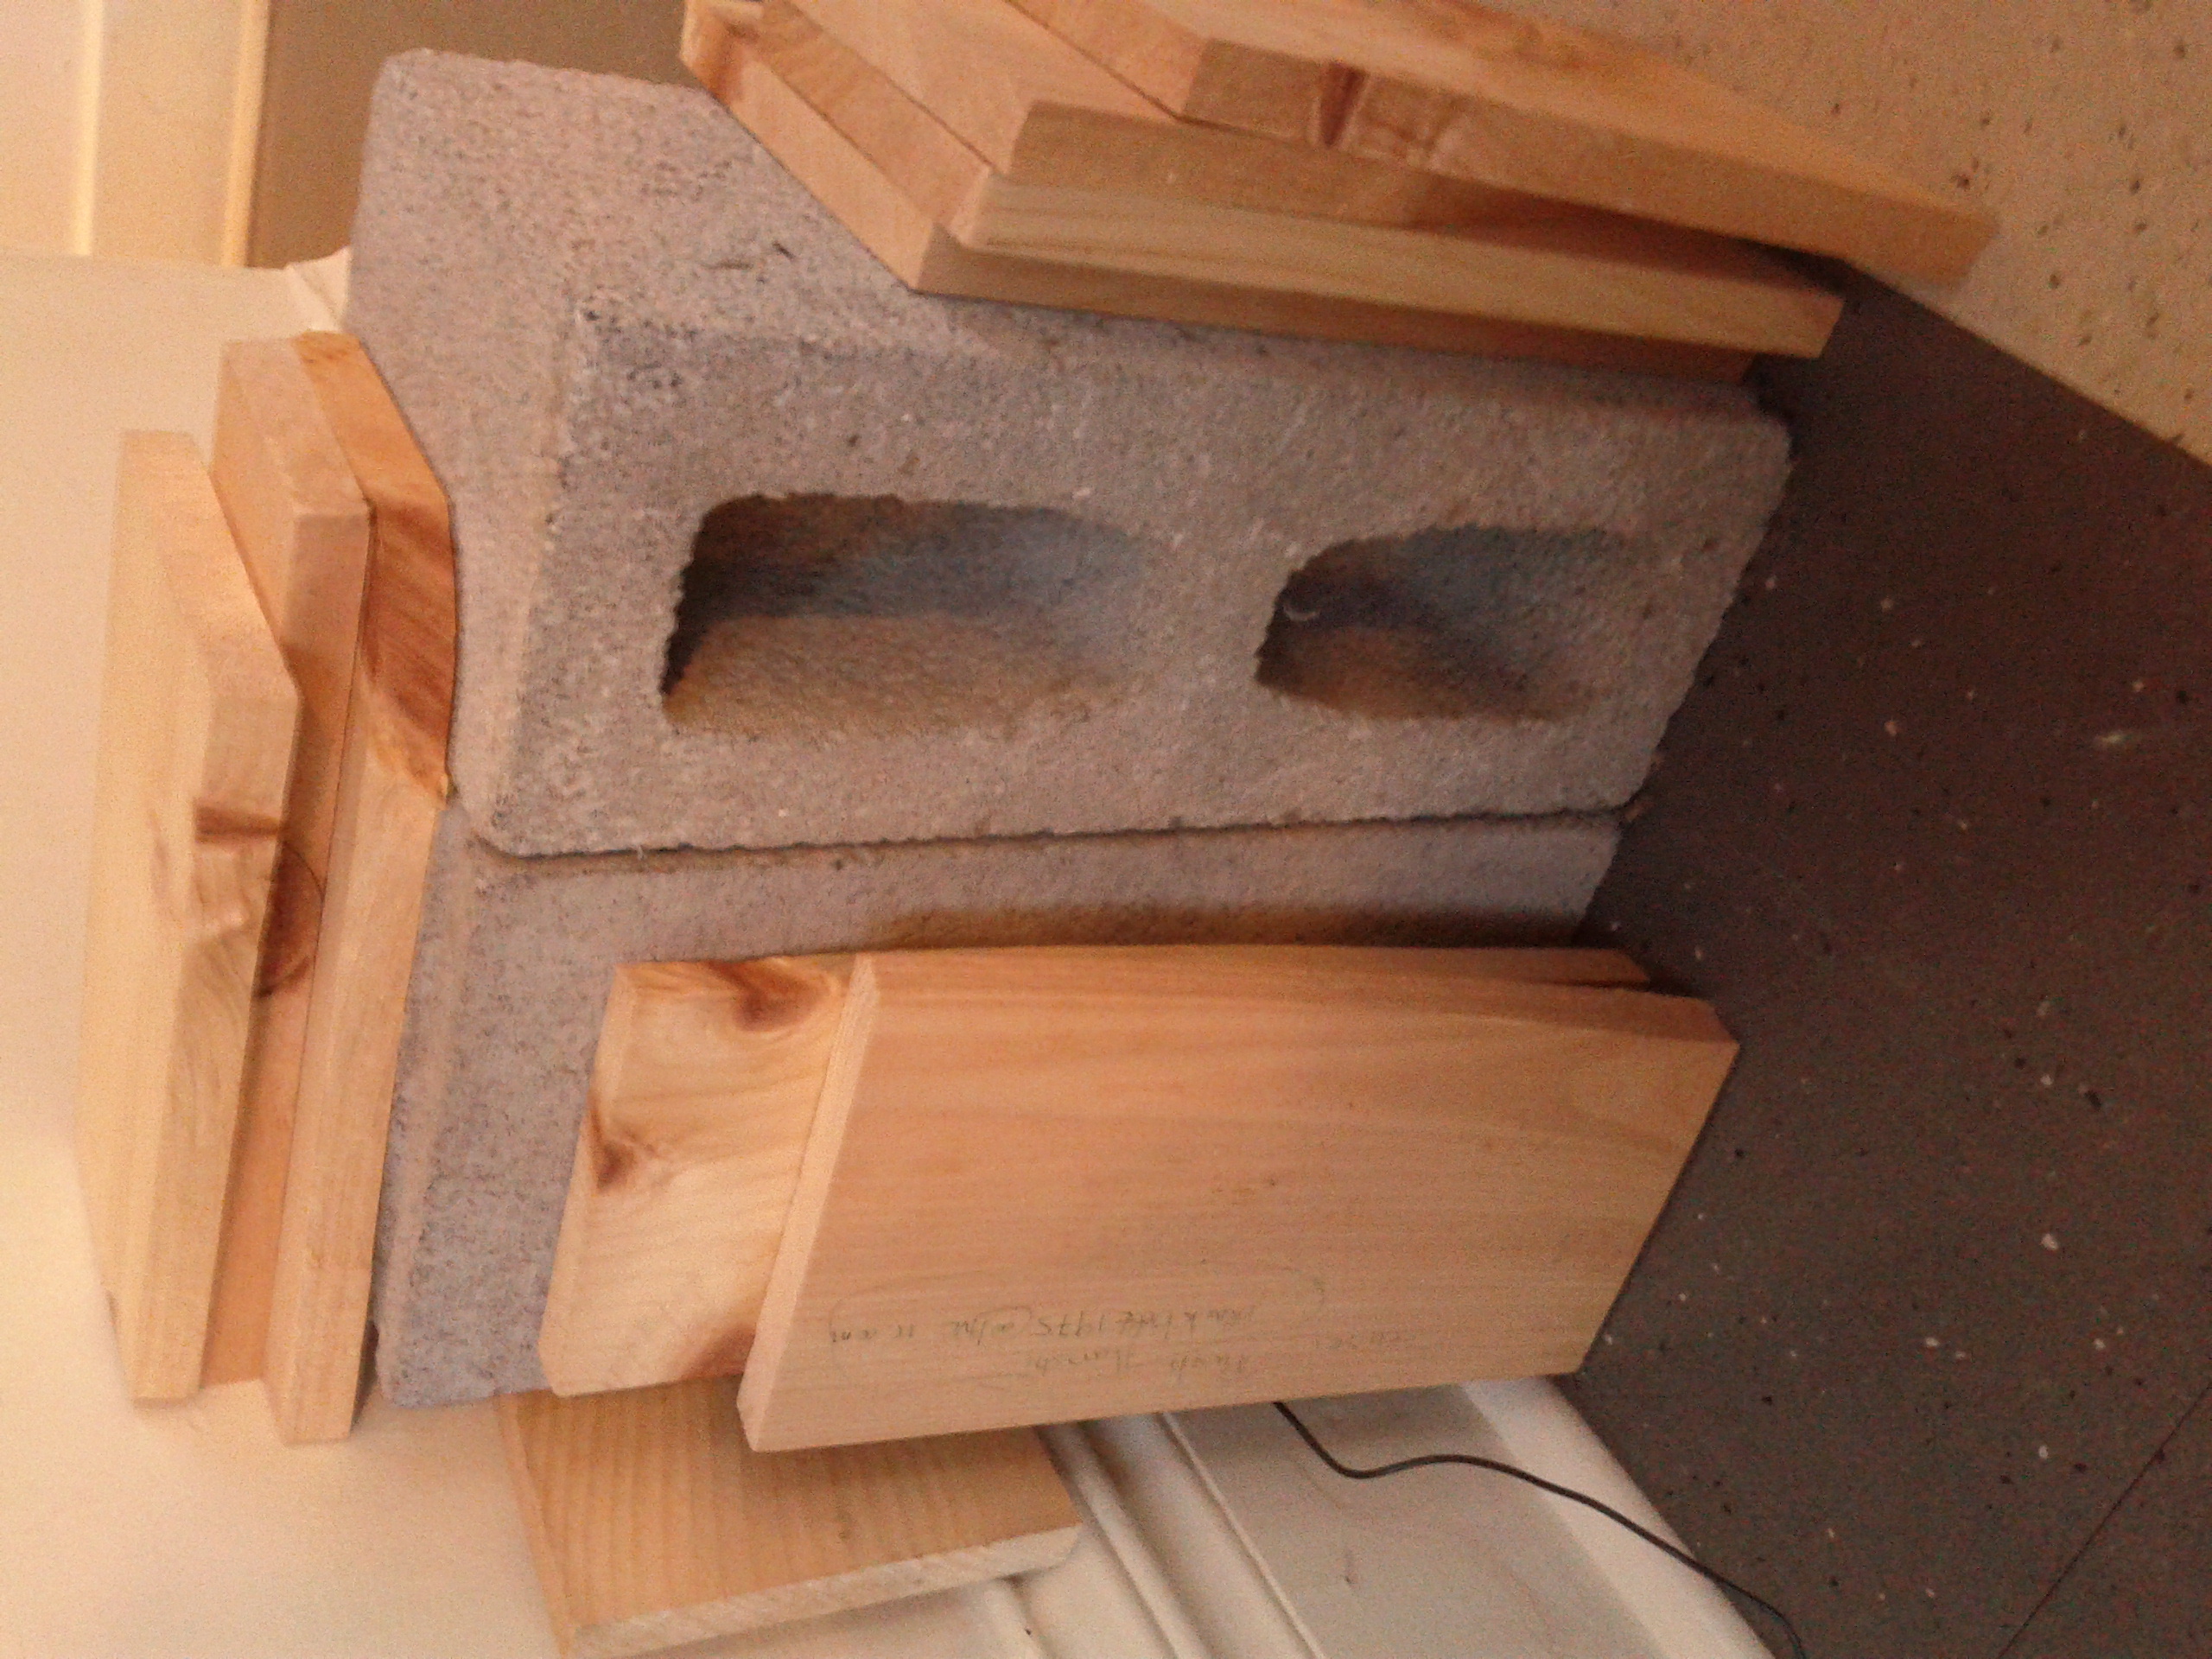
Our router in trial 3, with full enclosure
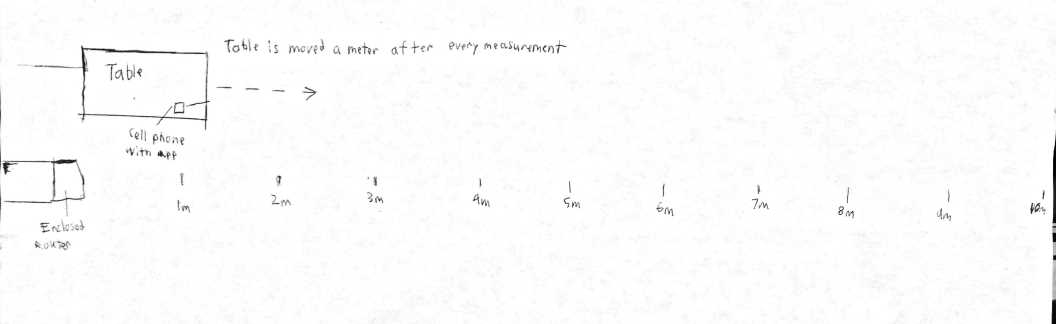
We set up our experiment in the Raymond MPR, laying out tape in 1m intervals, and placing the router on the floor. We placed the measuring instruments on a table and moved the table 1m back when we had taken enough data at each distance.
Trials 1-3: Using an Android cell phone with the app Wi-Fi Analyzer, we recorded the signal strength of the wireless access point (WAP) from 1-10 meters. The app scans for networks and reports the signal strength, every 5 seconds. Data was taken at 5 second intervals, in which the cell phone app refreshes its readings.
A diagram of our experiment.
Router Conditions for Trials 1-3
In order to modulate our variable, we increased the volume of the medium being passed through by the wireless radio signals during each trial.
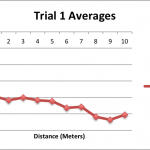
Trial 1: WAP uncovered.
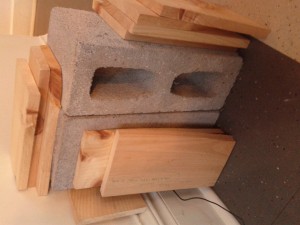
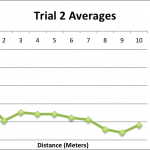
Trial 2: WAP covered with cinder block.
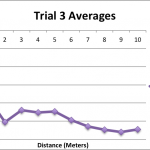
Trial 3: WAP covered with cinder block and surrounded by 12 wood planks.
Trial 4: WAP uncovered.
Trial 4: RF Meter used to record mW/m² values. The meter was used on its instantaneous value setting and records values rapidly, so table data was taken in 5 second intervals.
Explanation of Data
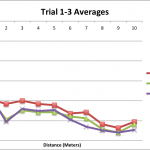
In order to make it easier to recognize trends, we took the averages of the 5 data values taken at each distance for trials 1-4 and used those for graphing. We believe that graphing average values is the most logically sound and clear way to represent our data, as the readings for both power density and power tended to fluctuate greatly, making instantaneous values unreliable to graph.
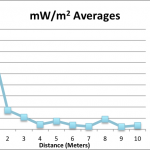
The general trend in our data measurements is that the average power density and power tends to decrease as we increased the amount of obstacles, as we would intuitively guessed. However, it is interesting to note that the trend of the averages in fig 4 has an interesting behavior. At around 9 meters, the readings dip to their lowest values before returning to a higher value at 10m. We suspect that this may relate to the wave reinforcement and/or cancellation— the reflective/absorbent properties of Raymond MPR’s various materials and geometric shape is probably to blame for this peculiar anomaly.
Trial 4 data was not averaged with the other trial data on fig. 4 because the units being compared are not effectively comparable (dBm vs. mW/m²). We found the data for trial 4 to be problematic and unreliable because of the extremeness in fluctuation of the data given by the RF meter. However, the sharp cutoff from 1m to 2m may reveal that radio signals have an unexpectedly steep cutoff. Because of this, smaller increases in distance at this specific cutoff distance (found to be somewhere between 2-3m) may result in great loss of power density. However, this is only a conjecture, as we are wary of giving legitimacy to this data set because the volatile behavior of the RF meter.
Units
mW/m² – Power density (milliwatts per meters squared)
dBm – Power, expressed in a logarithmic ratio (decibel-milliwatt)
m – Distance, standard SI base unit (meters)
Data Tables
| Trial 1, without block. |
|
|
|
|
|
|
| Distance |
A |
B |
C |
D |
E |
Average |
| 1 |
-42 |
-39 |
-36 |
-38 |
-41 |
-39.2 |
| 2 |
-44 |
-41 |
-41 |
-41 |
-41 |
-41.6 |
| 3 |
-42 |
-38 |
-41 |
-41 |
-38 |
-40 |
| 4 |
-41 |
-41 |
-41 |
-44 |
-41 |
-41.6 |
| 5 |
-41 |
-41 |
-41 |
-47 |
-41 |
-42.2 |
| 6 |
-41 |
-44 |
-50 |
-47 |
-50 |
-46.4 |
| 7 |
-44 |
-47 |
-47 |
-44 |
-47 |
-45.8 |
| 8 |
-53 |
-50 |
-47 |
-50 |
-59 |
-51.8 |
| 9 |
-56 |
-53 |
-50 |
-56 |
-53 |
-53.6 |
| 10 |
-53 |
-47 |
-53 |
-47 |
-53 |
-50.6 |
| Trial 2, with cinder block only |
|
|
|
|
|
|
| Distance |
A |
B |
C |
D |
E |
Average |
| 1 |
-42 |
-35 |
-41 |
-35 |
-41 |
-38.8 |
| 2 |
-47 |
-50 |
-53 |
-50 |
-47 |
-49.4 |
| 3 |
-48 |
-41 |
-44 |
-50 |
-41 |
-44.8 |
| 4 |
-44 |
-47 |
-50 |
-47 |
-41 |
-45.8 |
| 5 |
-44 |
-50 |
-47 |
-47 |
-41 |
-45.8 |
| 6 |
-48 |
-47 |
-44 |
-50 |
-50 |
-47.8 |
| 7 |
-47 |
-50 |
-47 |
-53 |
-47 |
-48.8 |
| 8 |
-50 |
-56 |
-50 |
-56 |
-59 |
-54.2 |
| 9 |
-59 |
-53 |
-56 |
-59 |
-53 |
-56 |
| 10 |
-47 |
-56 |
-50 |
-53 |
-53 |
-51.8 |
| |
|
|
|
|
|
|
| Trial 3, with cinder block + 12 wood surrounding |
|
|
|
|
|
|
| Distance |
A |
B |
C |
D |
E |
Average |
| 1 |
-41 |
-35 |
-35 |
-41 |
-35 |
-37.4 |
| 2 |
-50 |
-53 |
-50 |
-47 |
-53 |
-50.6 |
| 3 |
-44 |
-50 |
-41 |
-44 |
-41 |
-44 |
| 4 |
-44 |
-41 |
-44 |
-47 |
-50 |
-45.2 |
| 5 |
-41 |
-44 |
-50 |
-44 |
-44 |
-44.6 |
| 6 |
-53 |
-44 |
-50 |
-47 |
-53 |
-49.4 |
| 7 |
-53 |
-56 |
-56 |
-50 |
-50 |
-53 |
| 8 |
-56 |
-53 |
-56 |
-56 |
-53 |
-54.8 |
| 9 |
-59 |
-53 |
-56 |
-59 |
-53 |
-56 |
| 10 |
-57 |
-54 |
-51 |
-60 |
-51 |
-54.6 |
| |
|
|
|
|
|
|
| Trial 4 RF Meter |
|
|
|
|
|
|
| Distance |
mW/m2 |
|
|
|
|
Average |
| 1 |
1168 |
1356 |
1701 |
1397 |
2136 |
1551.6 |
| 2 |
401.3 |
300.8 |
345.2 |
291.4 |
380.5 |
343.84 |
| 3 |
211.7 |
229.6 |
205.8 |
190.7 |
246.6 |
216.88 |
| 4 |
69.4 |
105.6 |
87.4 |
70 |
116.4 |
89.76 |
| 5 |
132.5 |
88.6 |
105.4 |
176.4 |
235.8 |
147.74 |
| 6 |
32.4 |
71.6 |
43.5 |
39.2 |
180.5 |
73.44 |
| 7 |
44.6 |
51.1 |
67.4 |
57.7 |
33.8 |
50.92 |
| 8 |
96.8 |
328.8 |
76.3 |
141.6 |
274.8 |
183.66 |
| 9 |
31.1 |
41.6 |
89.6 |
35.7 |
27.2 |
45.04 |
| 10 |
59.9 |
74.9 |
5.8 |
131.4 |
60.2 |
66.44 |
Data Graphs/Visualizations
-
-
Figure 1
-
-
Figure 2
-
-
Figure 3
-
-
Figure 4
-
-
Figure 5