How did we take our data?
Using a LabQuest, with microphone and sound level meter sensors, we recorded a single tone (of the musical note C), played by each instrument: piano, flute, and guitar. We also recorded tones (again, the note C) created by two different synthesizer programs: one an FM synthesizer, and one an Analog synthesizer. Our data tables are not posted here on the blog, as each table would have around 500 points of data. Instead, below is our data represented in graphical form created by LoggerPro.
All of our data was taken in the same, quiet environment with the hopes of minimizing ambient noise. We used a Steinway piano, a Yamaha flute, and a Taylor guitar. We used a free online program, called AudioSauna, which provided us with the synthetic tones we needed for each instrument, both FM and Analog.
Given that the known frequency of the note C is around 261.6 Hz, we took our recordings at a rate of 500 samples per second. We first attempted to record at a rate of 1000 samples per second, but we were limited by the capabilities of our LabQuest. Therefore, the graphed waveforms from our recordings may not represent the subtleties in the differences between acoustic and synthetic (both analog and FM) waveforms.
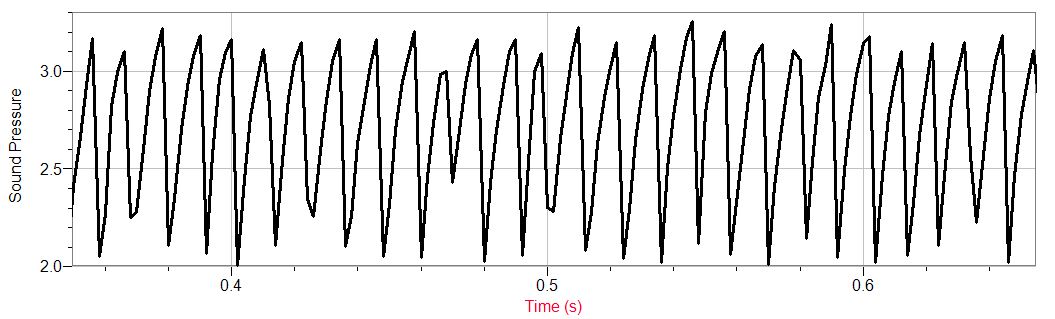
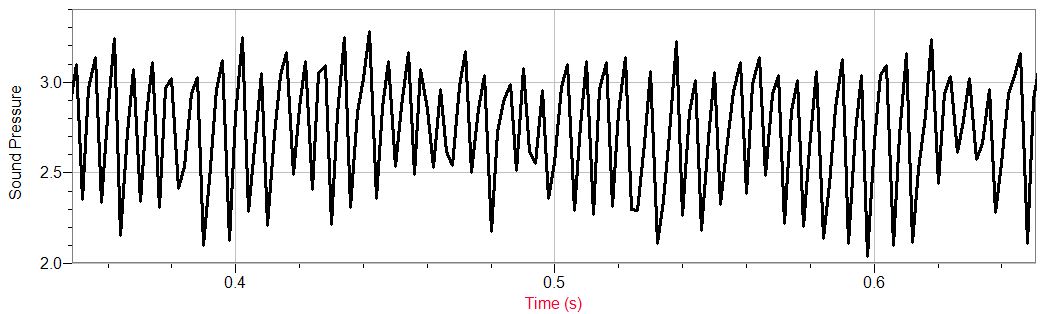
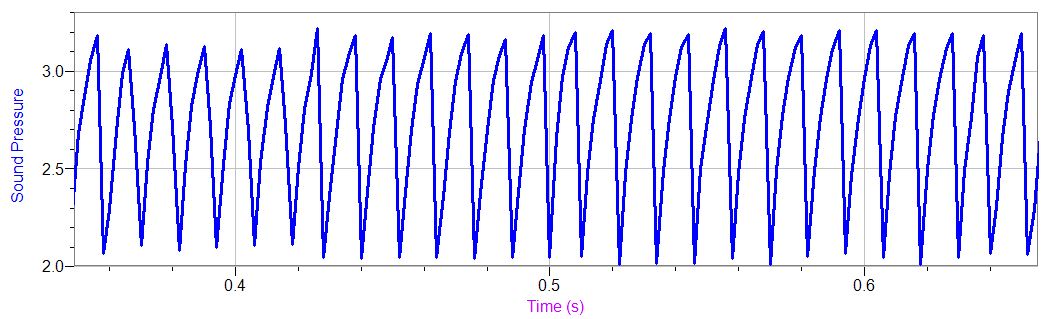
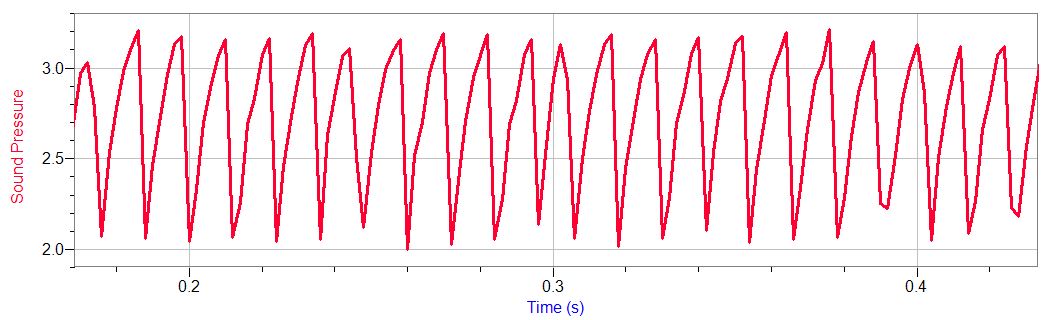
In general, the graphs of the synthetic tones– but especially the FM synthetic tones– showed more uniform waves relative to those of the acoustic tones. The acoustic tones seemed to form a sort of pattern over time, with more variance in the sound pressure. These patterns and variance may be caused by interference of the different harmonics that constitute the tones of acoustic instruments. The LabQuest and LoggerPro did not give default units for Sound Pressure, but deemed them as “arbitrary.”
More details and analysis to come on Friday!
PIANO
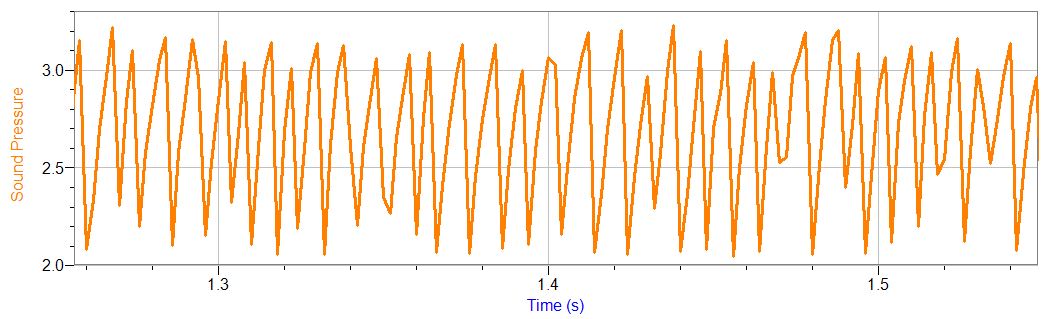
Acoustic Piano
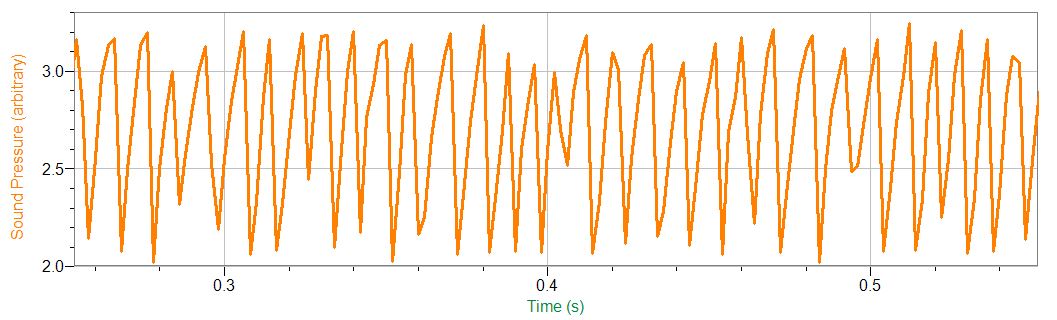
Analog Synth Piano
FM Synth Piano
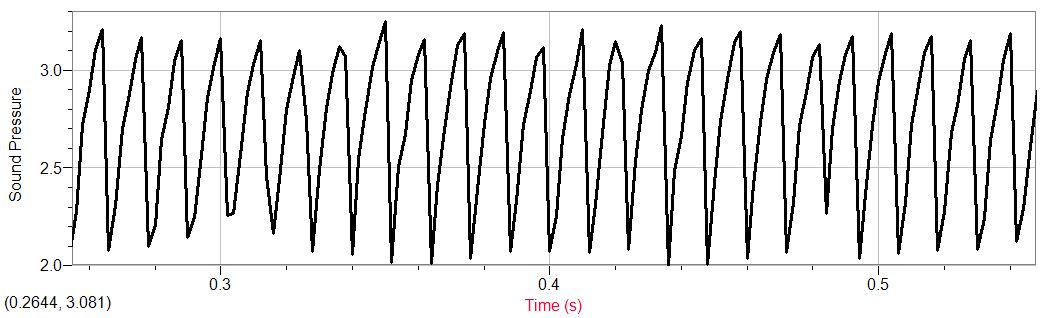
FLUTE
Acoustic Flute
Analog Synth Flute
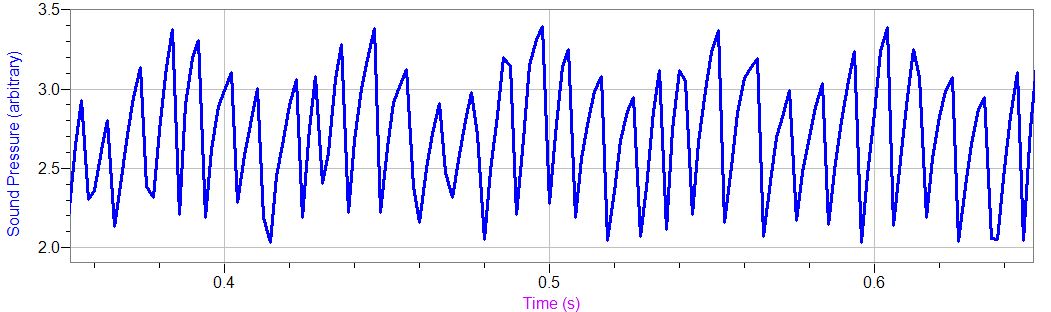
GUITAR
Acoustic Guitar
Analog Synth Guitar
FM Synth Guitar
It is nice that one can tell the difference between the various sound sources by looking at the sound waves. I am wondering if there is any way to quantify these differences. What is the unit for sound pressure?