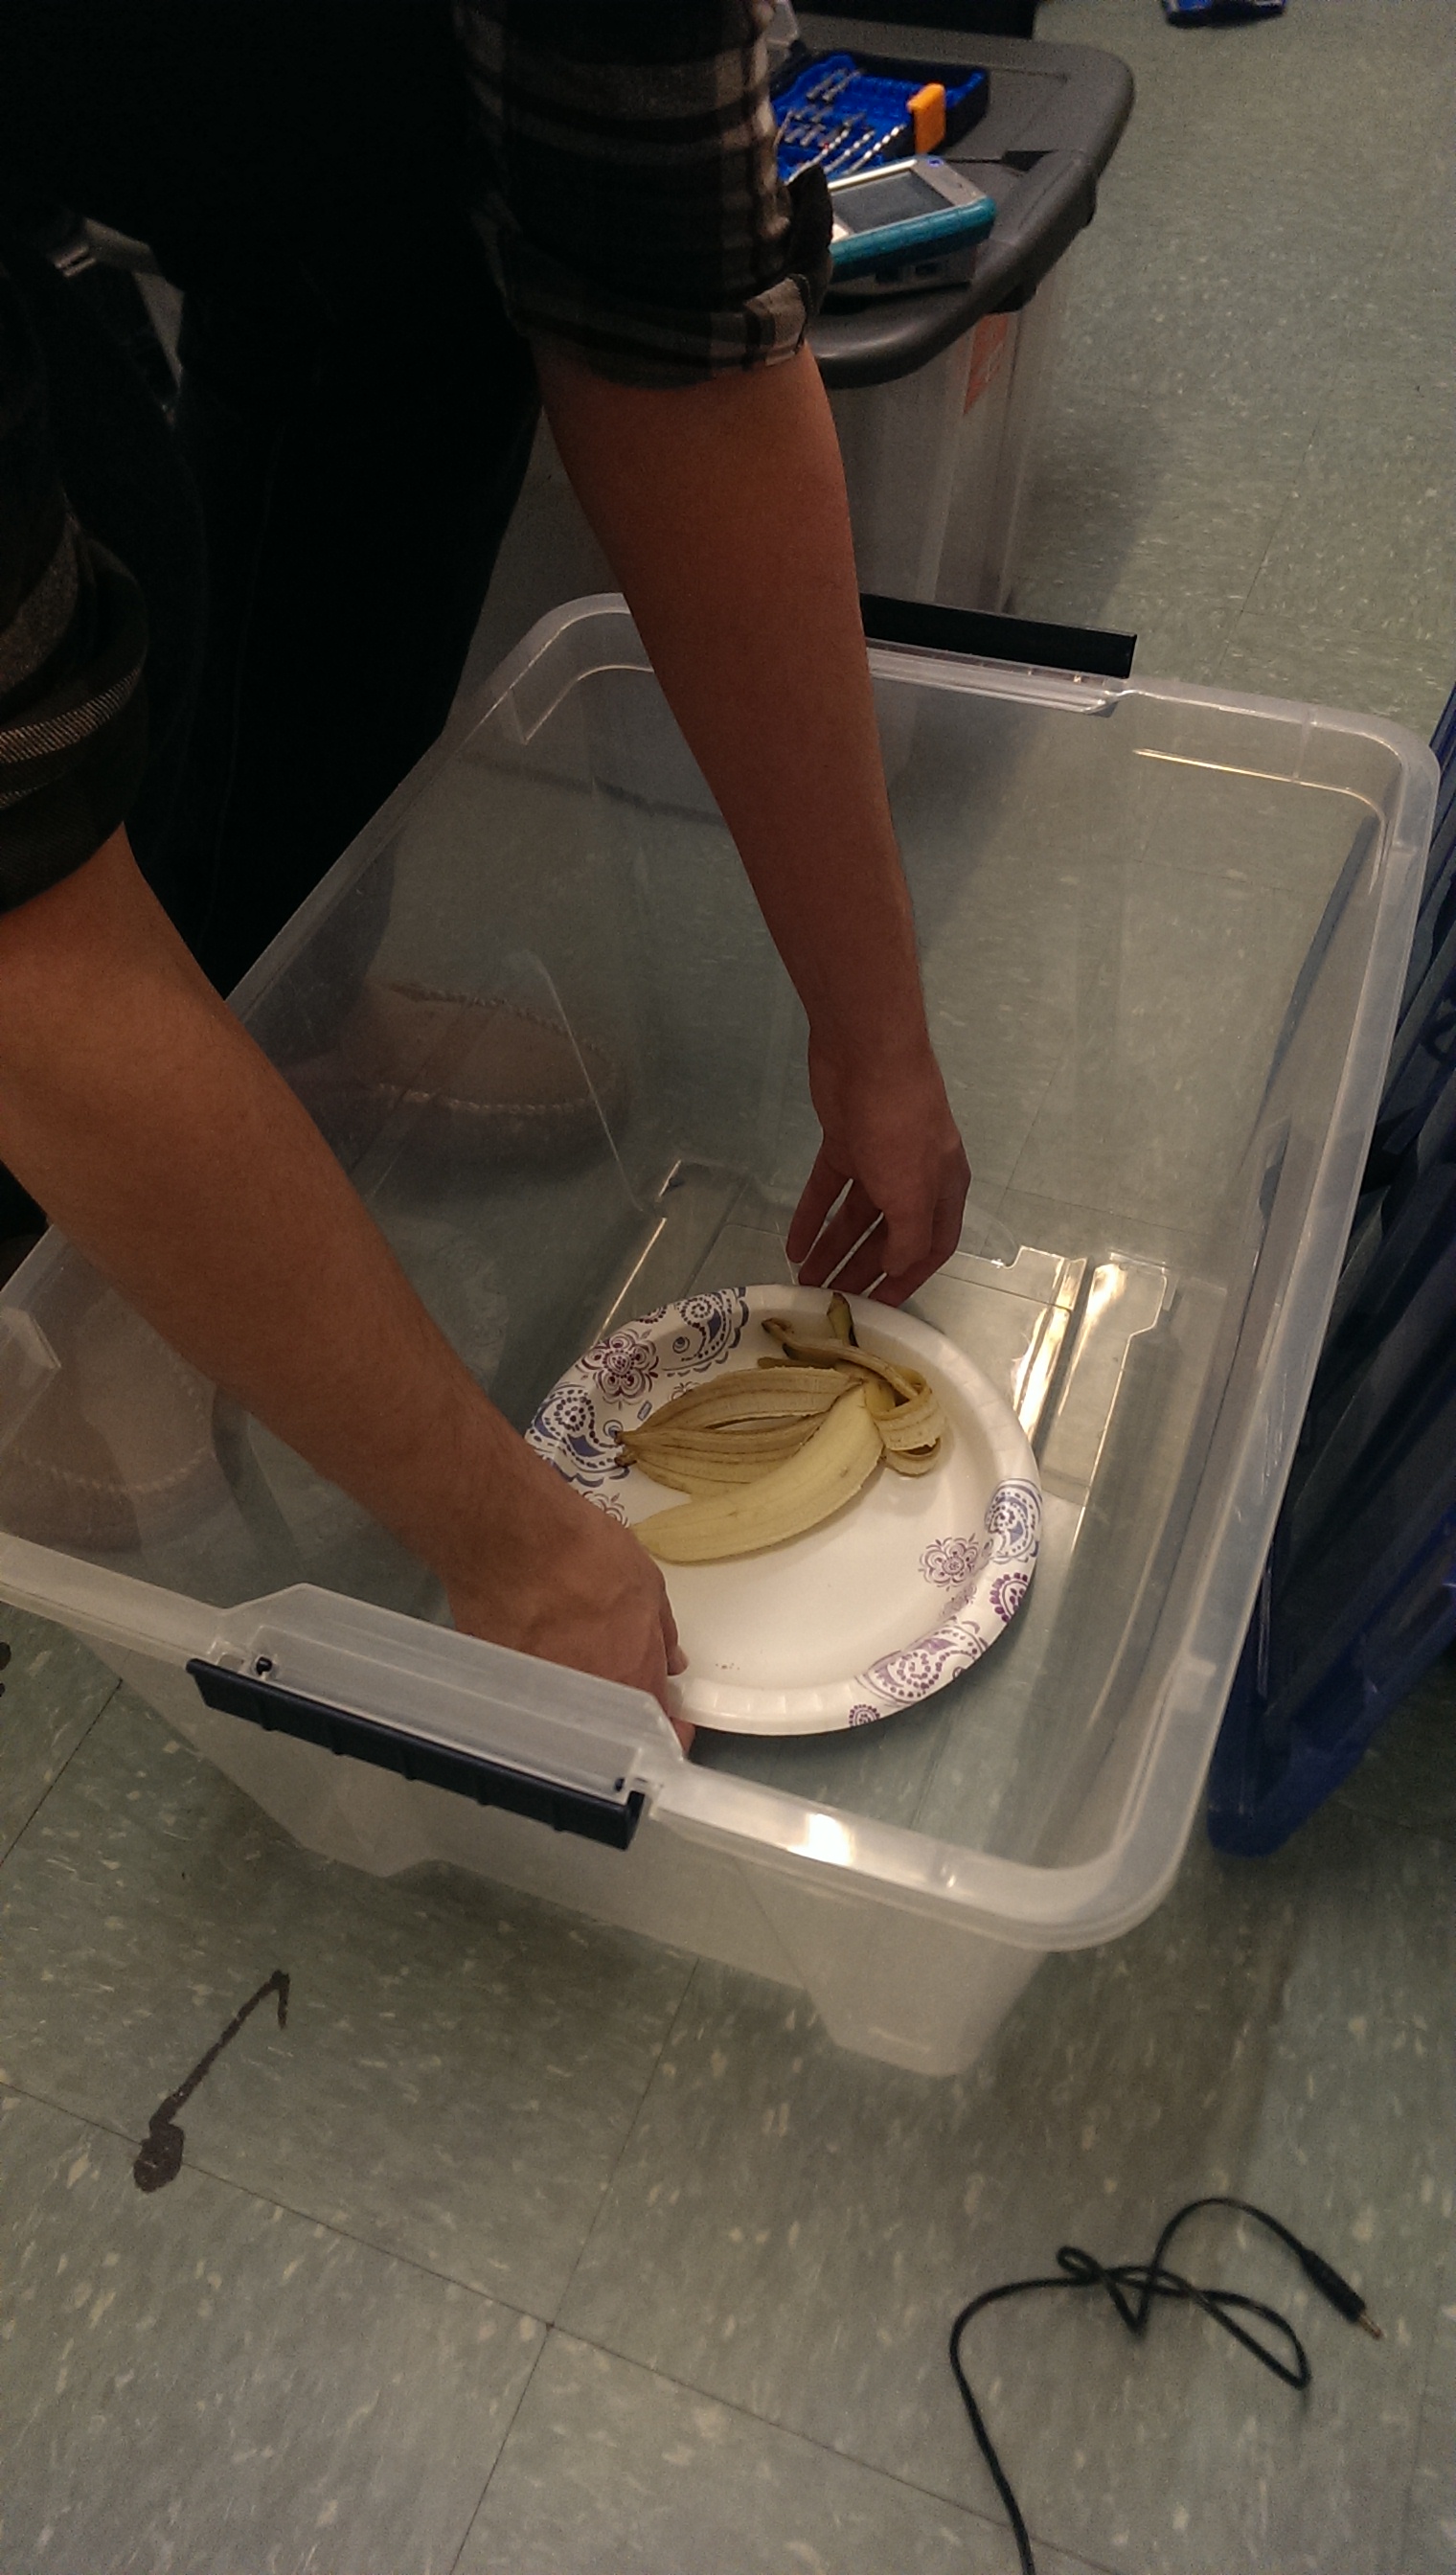
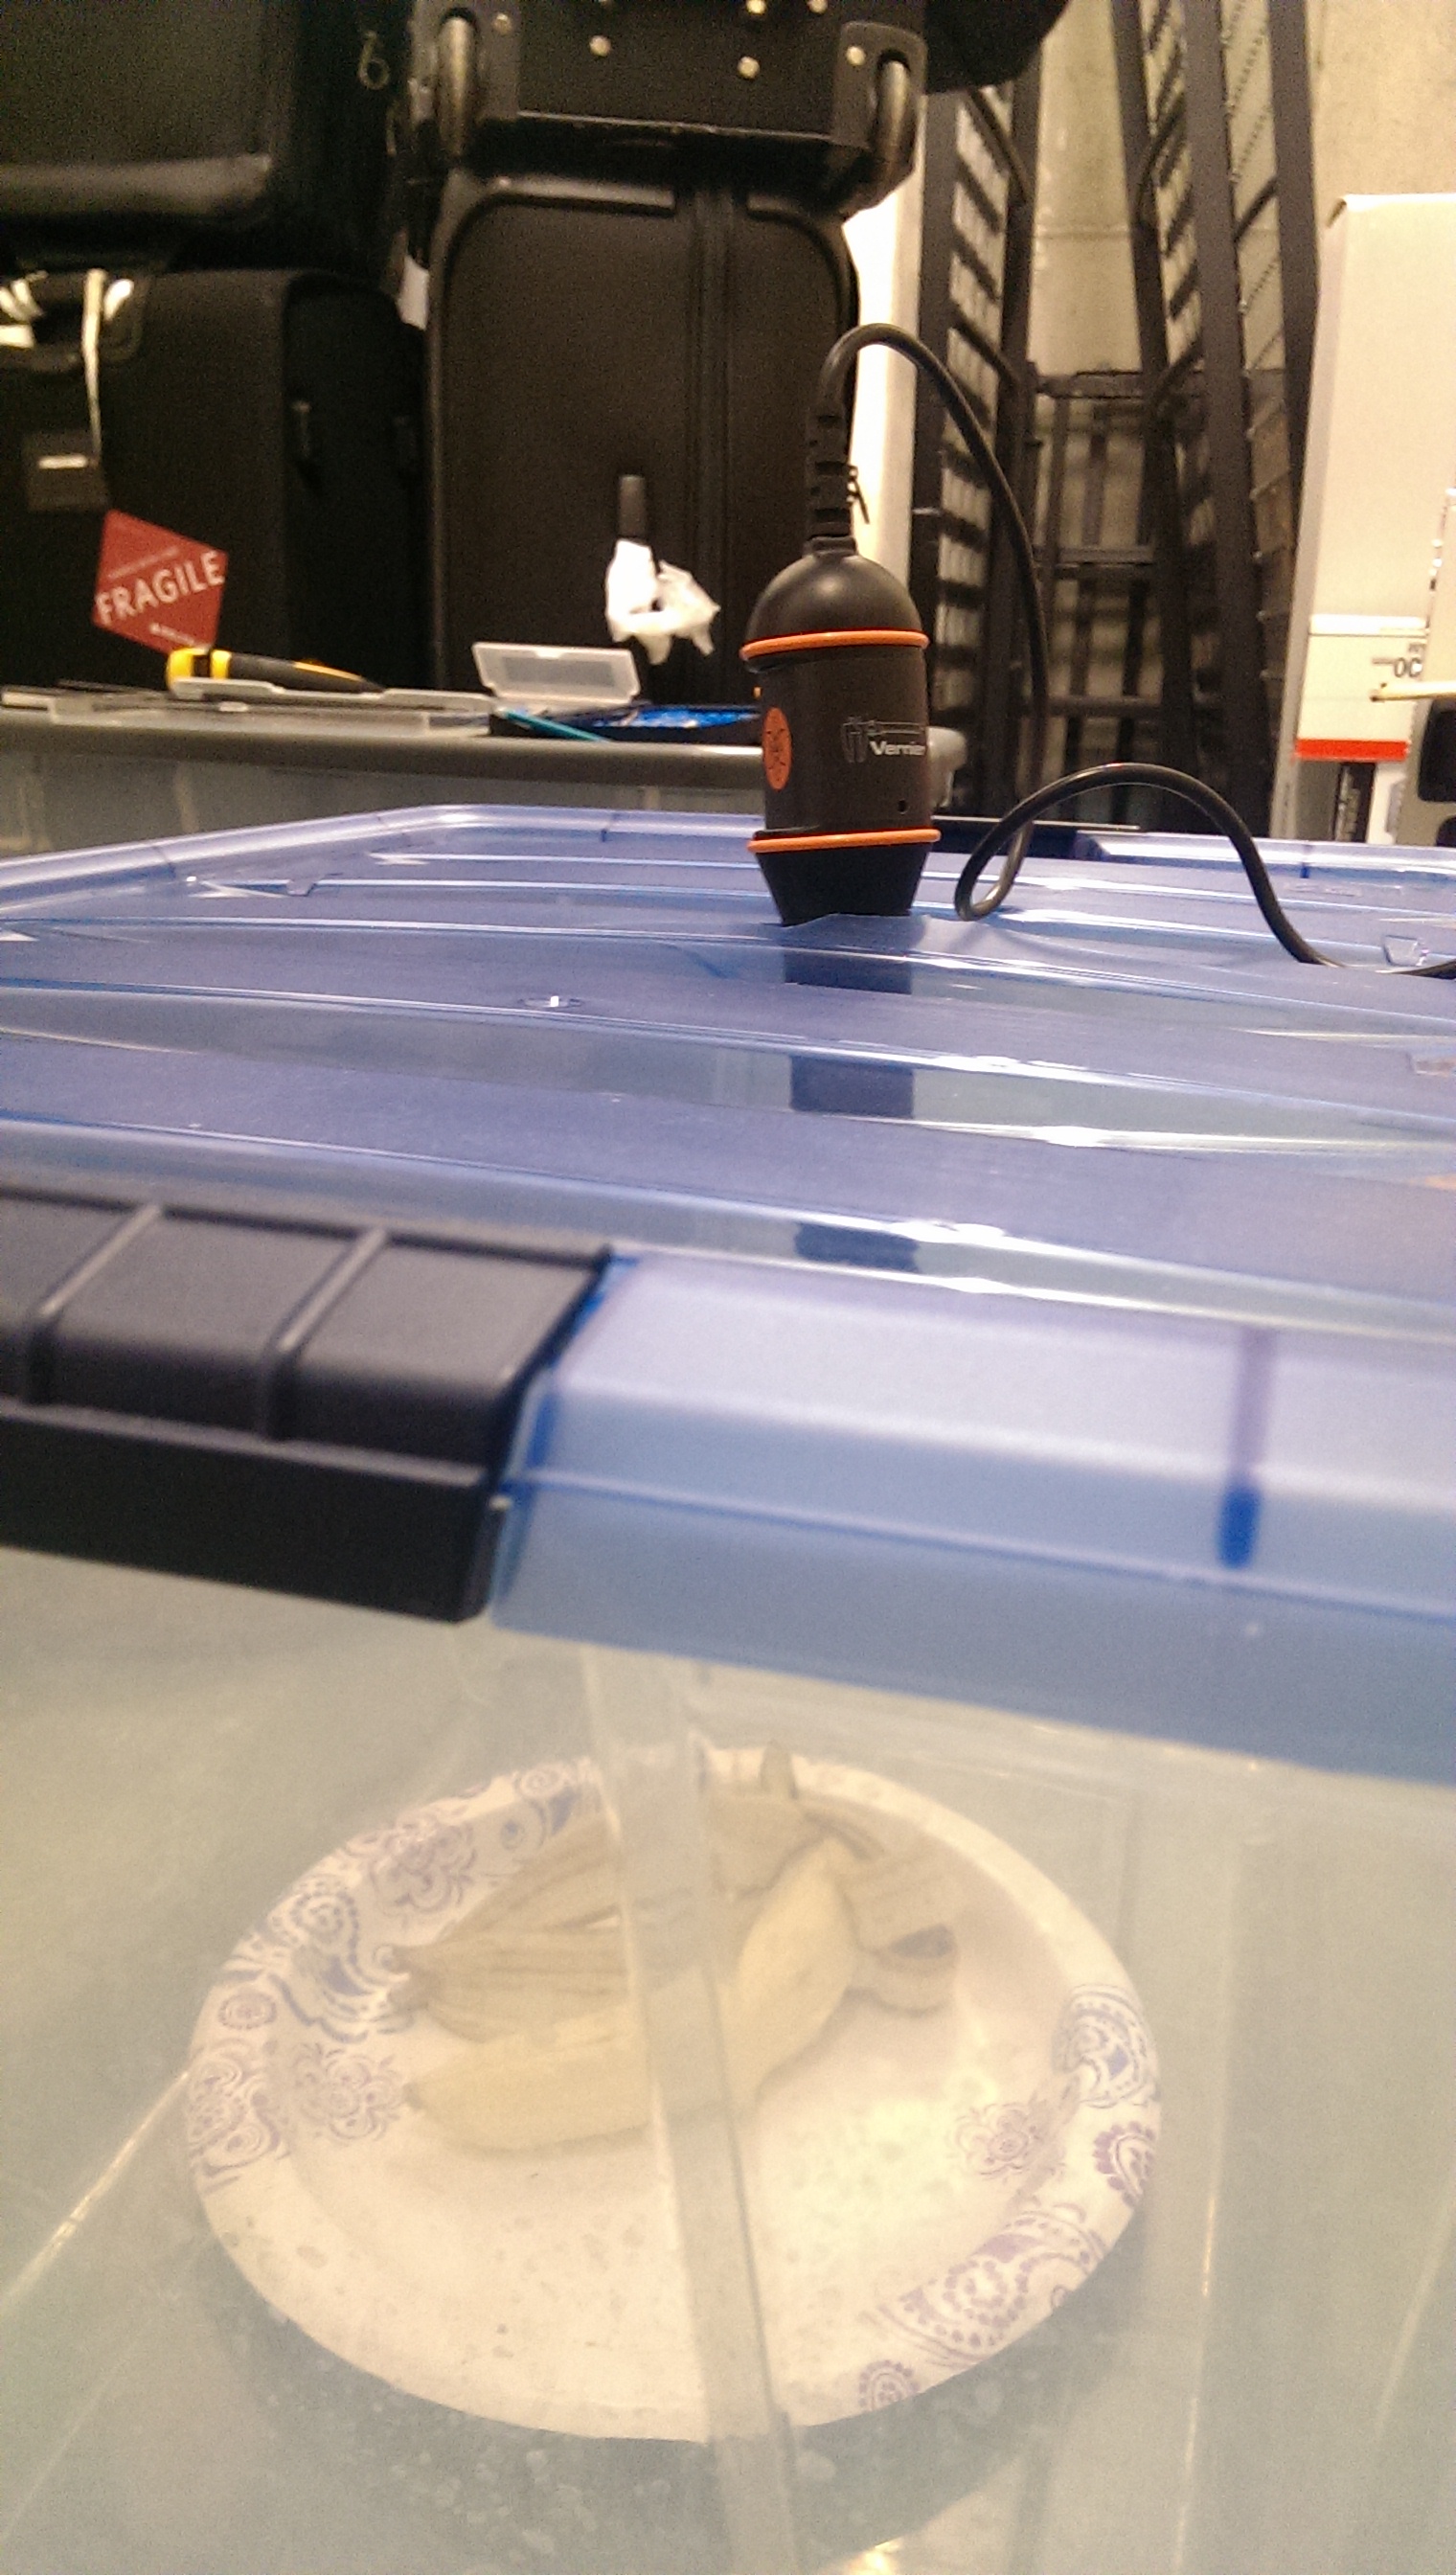
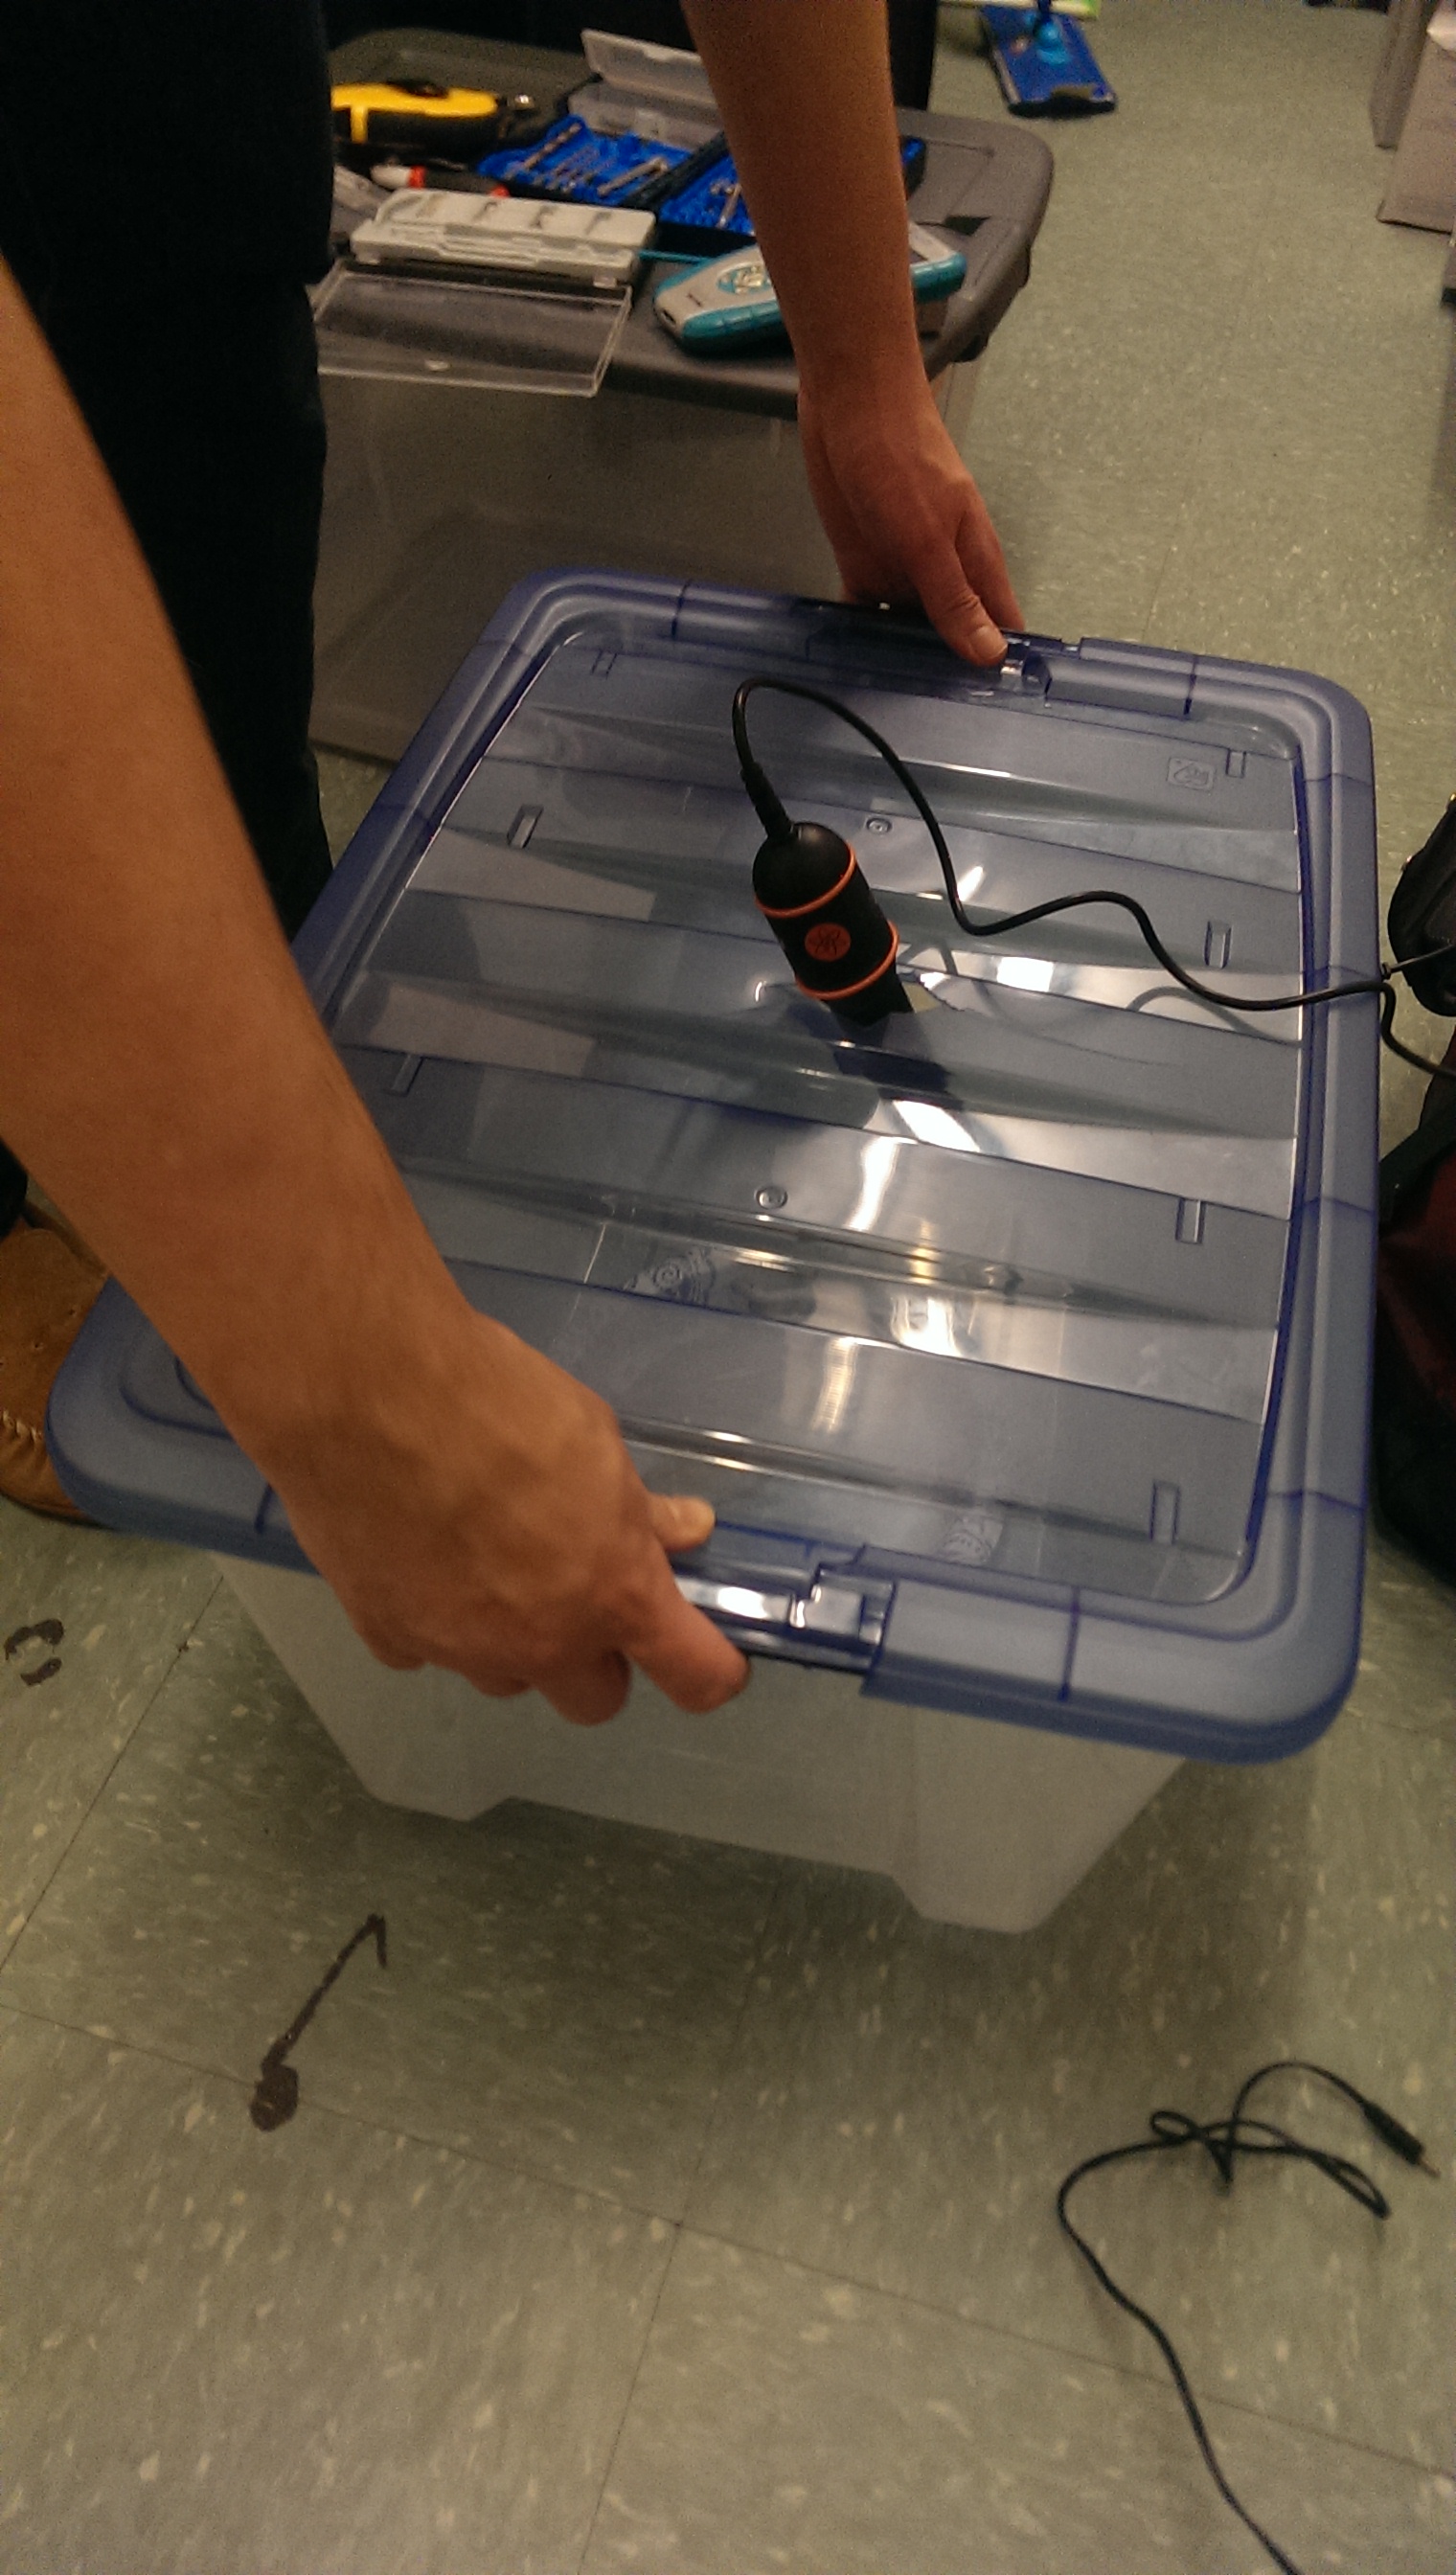
For collecting our data, the sample was placed into a 20 gallon plastic container with the Geiger counter pointing downwards at the sample, and the Vernier LabQuest was placed away from the container to minimize any additional environmental variables. The samples were placed 6 inches away from each sample. The container was covered before testing began, and all testing was conducted in a dry room at 75°F. Pictures are shown below.
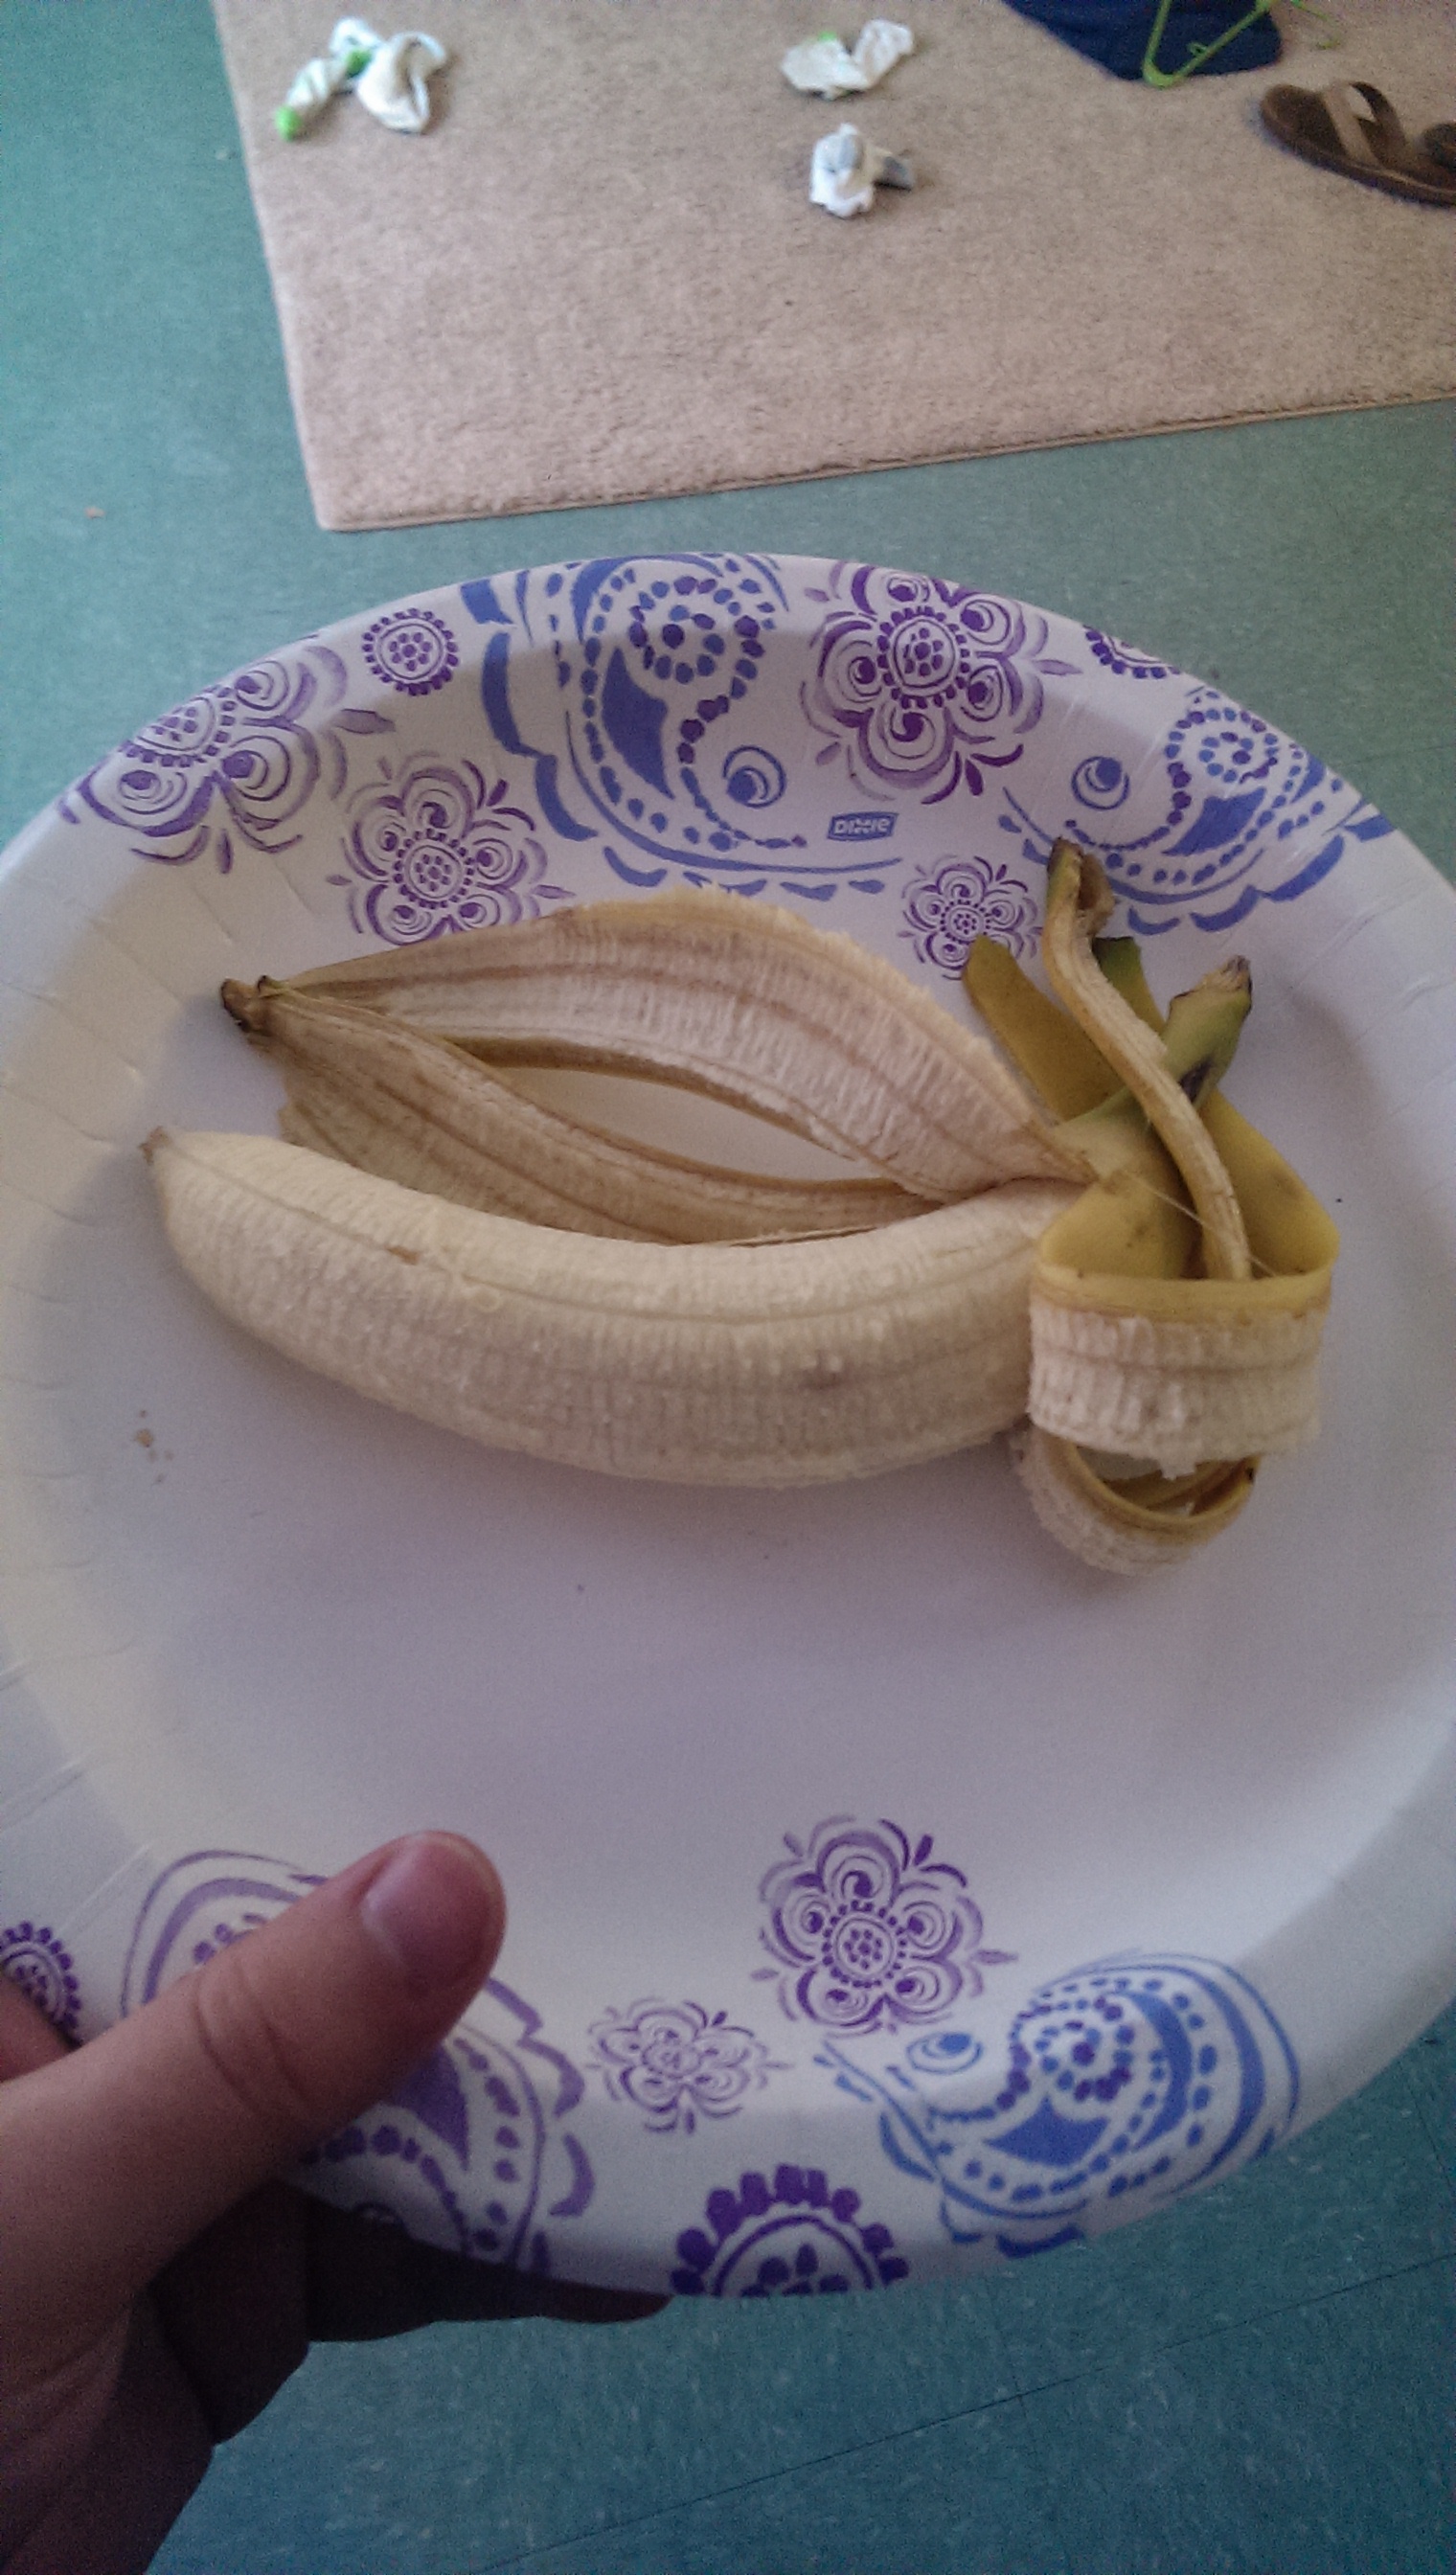

The data was collected for a period of 10 minutes at intervals of 10 second through the Vernier LabQuest and was compiled into a data chart on the devices. The samples that were tested were as follows: a banana, peanut butter, Beck’s beer, and a blank. The data was then transferred to Microsoft Excel where various calculation were conducted. A total summation of all the radioactive counts are shown in Figure 1, and a line graph of the variation of counts per 10 second interval are shown in Figure 2.
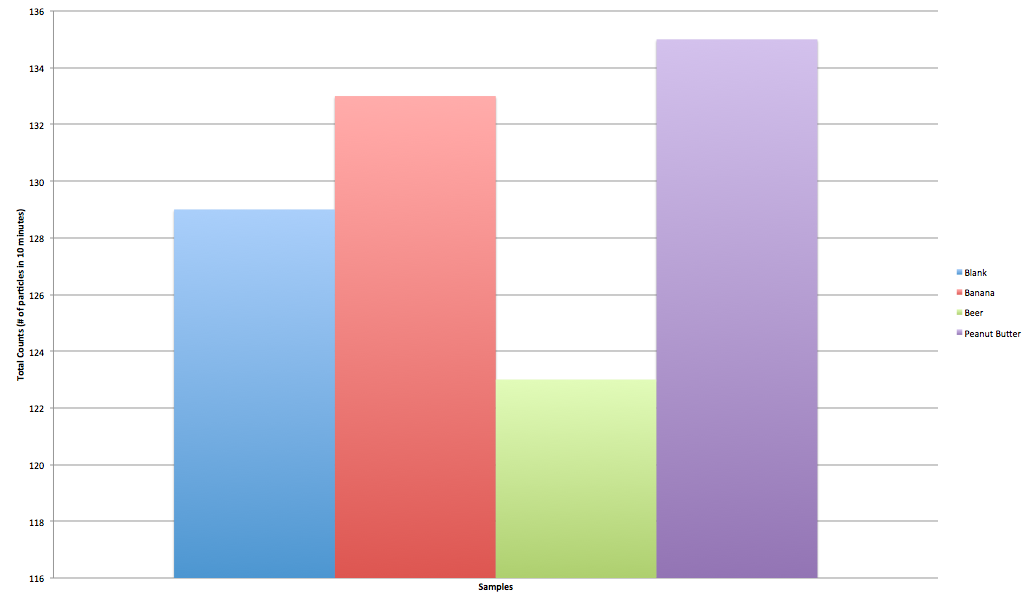
Figure 1 – Summation of Counts
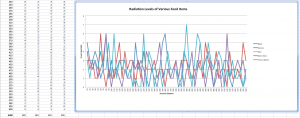
Figure 2 – Counts over Time
The data overall showed that radiation was indeed being emitted from each of the samples, however, the type of radiation has yet to be determined.
Your experiment is of great interest, especially since radiation is also used to preserve food freshness. Especially for your conclusion there may be a few things to think about: Did you just use one sample of each or several samples of each type? Why is the blank showing higher radiation than beer? What was the statistical spread? Was your experiment repeatable? Did you get the food from the same source?