Graph of Data
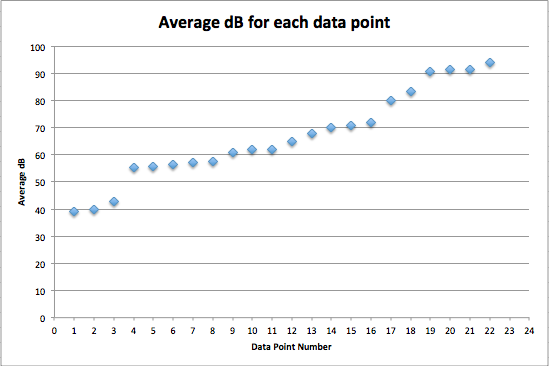
Table of data
| Data Point | Location, date, and time | Description | Average dB | dB Range | d(dB)/dt in dB/s | Settings | Inputter | Graph |
|
1 |
Jewett. 9:23pm on 2/13/14 | Noise level during night time in my dorm (wellness and quiet). |
38.98 |
38.00 – 48.86 |
-0.002022 |
S/Reset/A/Lo | Christopher | Graph |
|
2 |
Library. 3:15pm on 2/12/14 | Studying in library. No conversations. |
39.82 |
37.70 – 53.74 |
-0.006618 |
S/Reset/A/Lo | Christopher | Graph |
|
3 |
Jewett. 12:40pm on 2/14/14 | Noise level during day time in my dorm (wellness and quiet). |
42.65 |
41.91 – 48.52 |
-0.002447 |
S/Reset/A/Lo | Christopher | Graph |
|
4 |
Raymond. 9:45pm on 2/18/14 | Listening to “Arabella” by Arctic Monkeys on computer. Microphone 72.5cm from computer (comfortable ear distance when computer on lap) at 50% volume. |
55.12 |
10.82-70.22 |
0.0118 |
S/Reset/A/Lo | Phe | Graph |
|
5 |
ACDC. 3:30pm on 2/12/14 | Closing time for ACDC (big side). |
55.75 |
49.75-67.47 |
-0.003545 |
S/Reset/A/Lo | Hannah | Graph |
|
6 |
OLB 205. 12:00pm on 2/17/14 | Physics 152 lecture. |
56.45 |
43.40 – 67.35 |
0.03432 |
S/Reset/A/Lo | Christopher | Graph |
|
7 |
Jewett. 7:50pm on 2/13/14 | Conversation with a friend in my dorm. |
57.3 |
42.40 – 80.32 |
-0.002987 |
S/Reset/A/Lo | Christopher | Graph |
|
8 |
Raymond. 9:41pm on 2/18/14 | Listening to message on iPhone at 100% volume. Microphone against speaker. Message begins at t=5s. |
57.51 |
0.08392-80.95 |
0.1028 |
S/Reset/A/Lo | Phe | Graph |
|
9 |
Jewett. 9:13pm on 2/13/14 | Listening to Kings&Queens – 30STM, volume at 100%, using headset with volume at 100%, however headset is on my head and microphone is 0cm from left ear. |
60.86 |
50.78 – 67.38 |
0.05022 |
S/Reset/A/Lo | Christopher | Graph |
|
10 |
ACDC. 12:00pm on 2/13/14 | Noise level at ACDC (big side) during lunch. |
61.75 |
51.99-77.08 |
-0.009397 |
S/Reset/A/Lo | Phe | Graph |
|
11 |
Jewett. 8:58pm on 2/13/14 | Listening to Kings&Queens – 30STM, volume at 60% and microphone 10cm from speakers. |
61.86 |
41.28 – 71.53 |
0.08031 |
S/Reset/A/Lo | Christopher | Graph |
|
12 |
Retreat. 6:00pm on 2/18/14 | Noise level at Retreat during dinner. |
64.98 |
58.11-74.58 |
0.01566 |
S/Reset/A/Lo | Phe | Graph |
|
13 |
Vassar’s Infant Toddler Center. 2:30pm on 2/18/14 | The infant room at the ITC, with babies crying sporadically |
67.73 |
54.50-80.95 |
-0.02128 |
S/Reset/A/Lo | Hannah | Graph |
|
14 |
Jewett. 9:07pm on 2/13/14 | Listening to Kings&Queens – 30STM, volume at 100%, using headset with volume at 100%, microphone in place where head should be (2-4cm apart from each ear piece). |
69.9 |
42.28 – 81.31 |
0.1129 |
S/Reset/A/Lo | Christopher | Graph |
|
15 |
Retreat. 3:00pm on 2/17/14 | Lunchtime at the retreat, crowded |
70.8 |
64.10-83.32 |
-0.0111 |
S/Reset/A/Lo | Hannah | Graph |
|
16 |
Retreat. 12:08pm on 2/18/14 | Noise level at Retreat during lunch. |
71.83 |
63.85-80.08 |
-0.03982 |
S/Reset/A/Lo | Phe | Graph |
|
17 |
ACDC. 6:20pm on 2/12/14 | Dinner time on the west side (big side) of ACDC. |
79.9 |
69.97-91.31 |
0.02131 |
S/Reset/A/Lo | Hannah | Graph |
|
18 |
Raymond. 10:40 on 2/17/14 | Listening to “What Makes You Beautiful” on iPhone from apple earbuds at 100% volume. Earbuds up against microphone. |
83.39 |
72.49-91.48 |
-0.01072 |
S/Reset/A/Hi | Phe and Hannah | Graph |
|
19 |
Raymond. 10:34pm on 2/17/14 | Listening to “What Makes You Beautiful” on iPhone from jvc earbuds at 100% volume. Earbuds up against microphone. |
90.66 |
79.48-97.23 |
0.01003 |
S/Reset/A/Hi | Phe and Hannah | Graph |
|
20 |
Jewett. 8:35pm on 2/17/14 | One of my friends practicing with her oboe from t=4 to t=113. 109 seconds of data. |
91.29 |
77.99 – 101.40 |
-0.05215 |
S/Reset/A/Lo | Christopher | Graph |
|
21 |
Raymond. 10:45 on 2/17/14 | Listening to “What Makes You Beautiful” on iPhone at 100% volume. Apple earbuds with holes on back covered. Earbuds up against microphone. |
91.46 |
77.48-101.9 |
0.07732 |
S/Reset/A/Hi | Phe and Hannah | Graph |
|
22 |
Villard room. 12am on 2/15/14 | Villard room party 100 nights, dubstep-like music was playing. 5-6 feet away from speakers. |
93.8 |
86.69-101.5 |
-0.06069 |
S/Reset/A/Hi | Hannah | Graph |
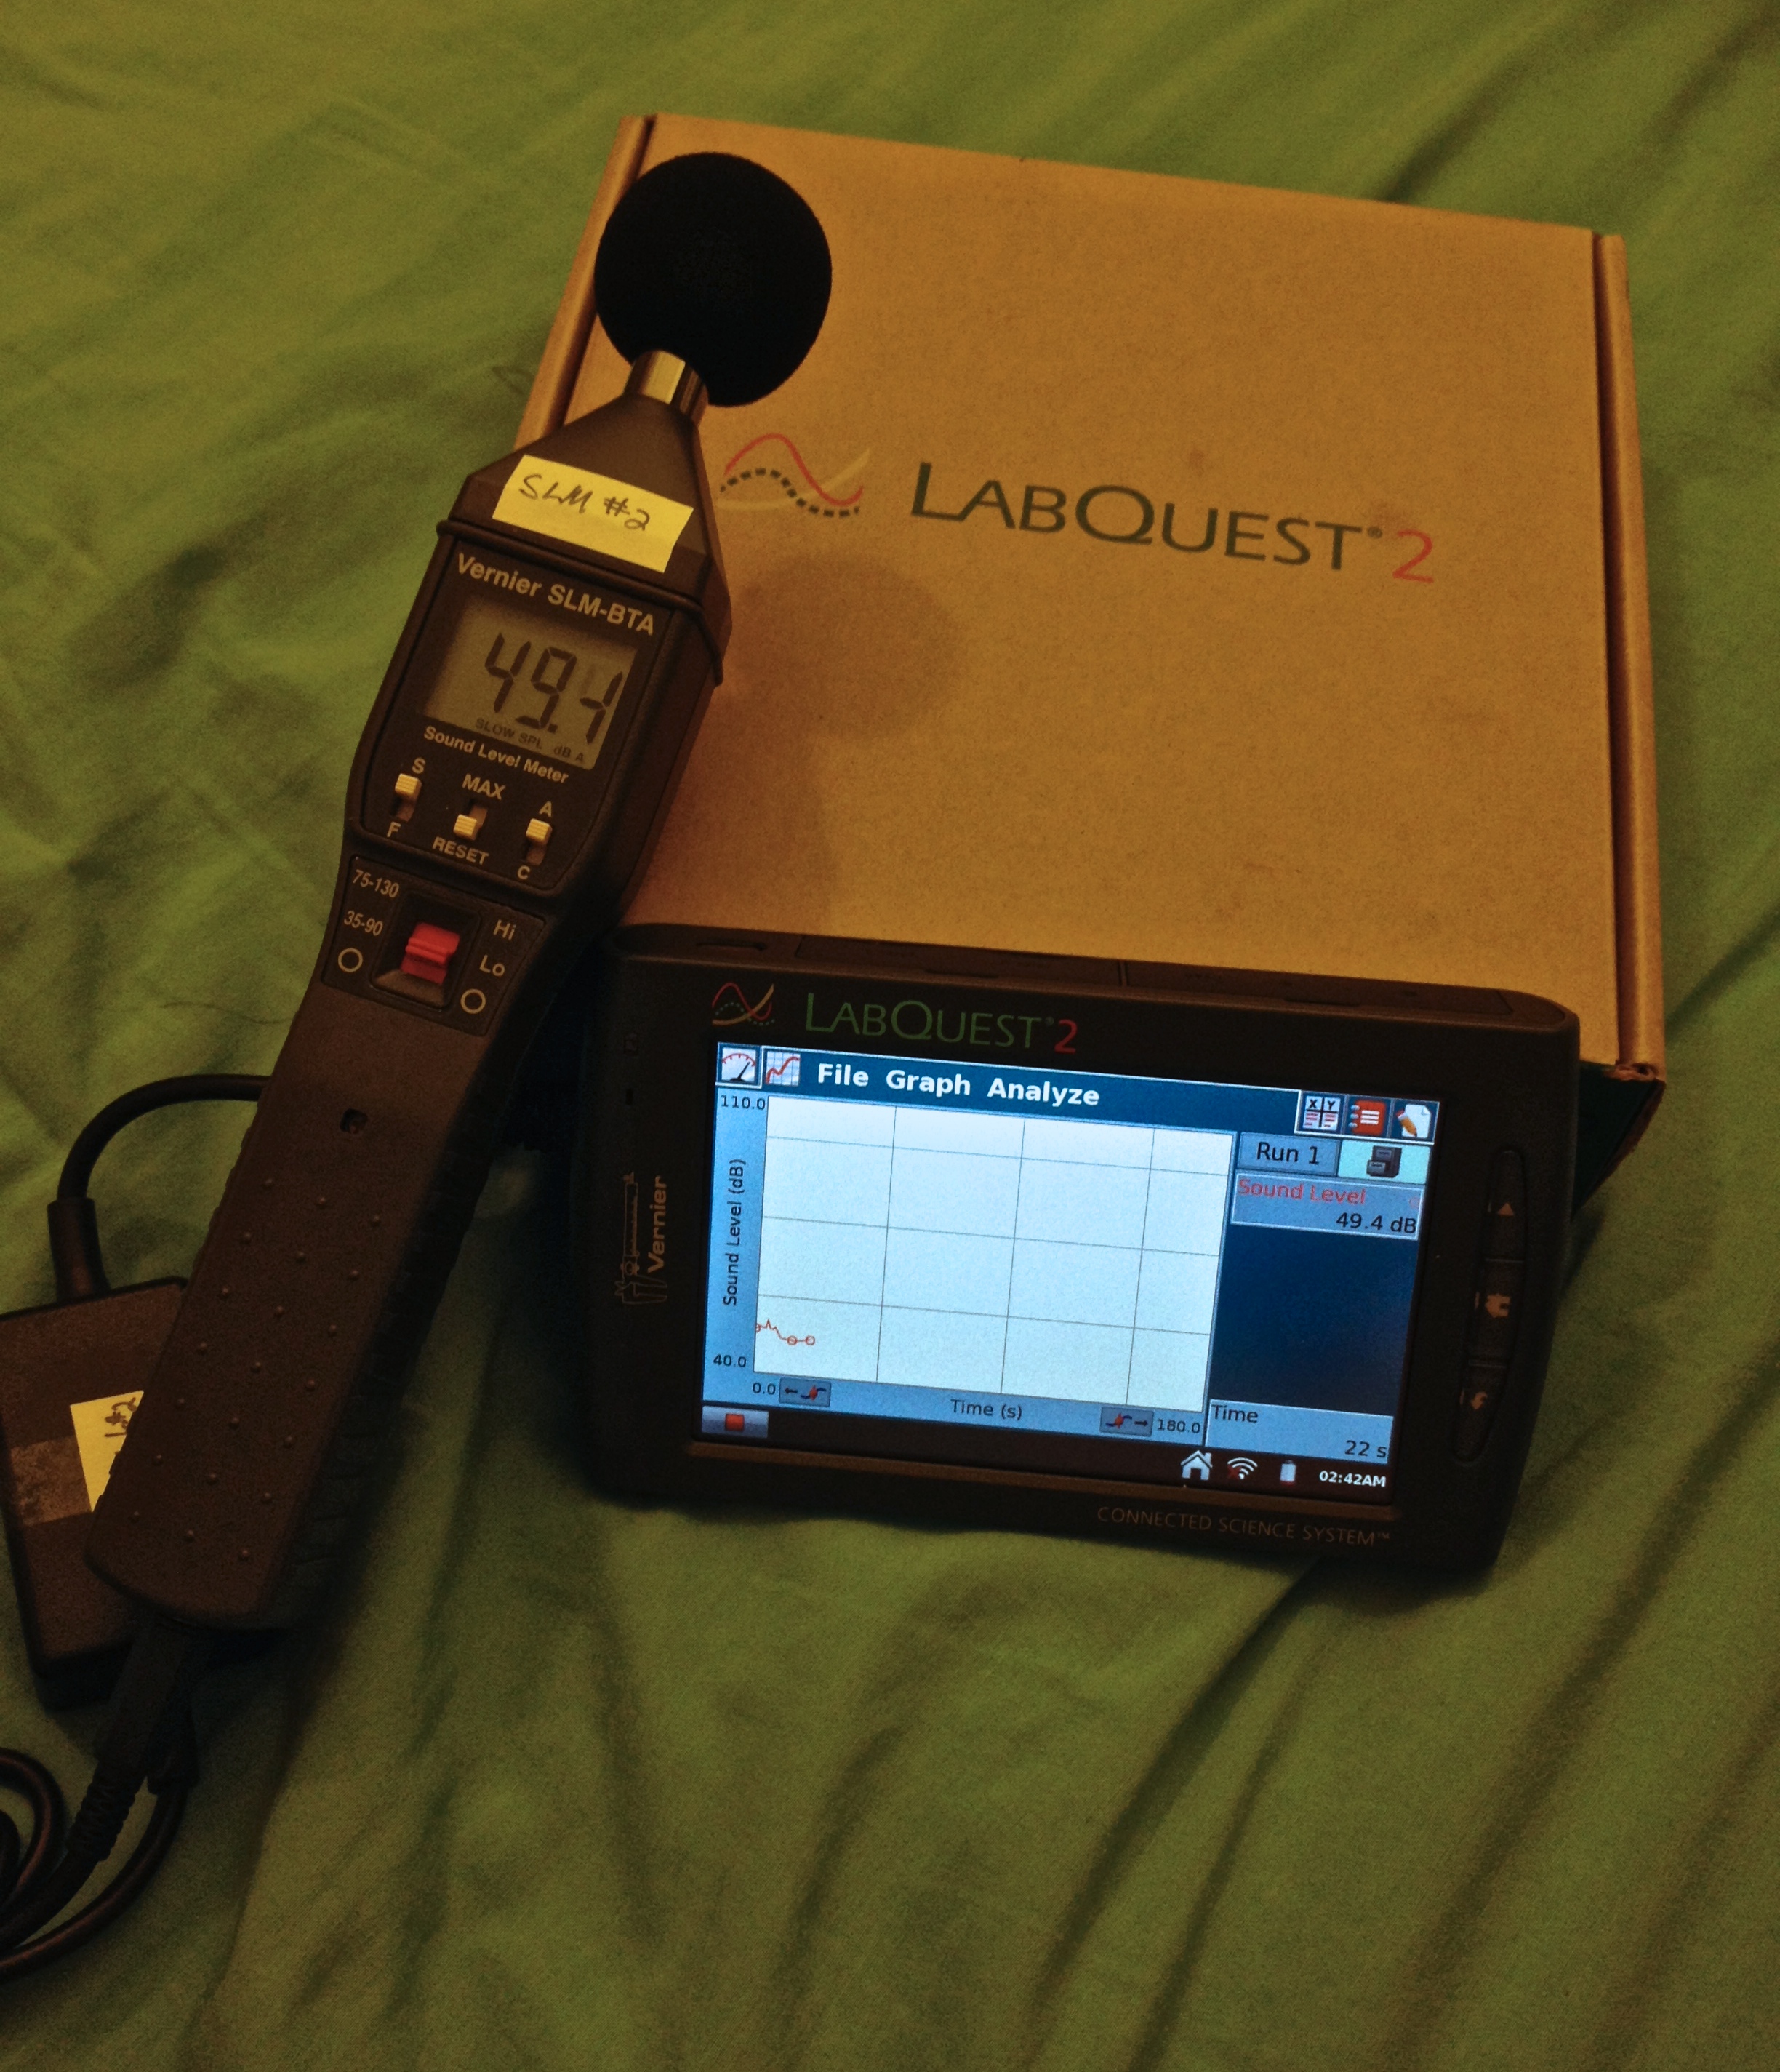
Sample experimental Setup Photo
Experimental Setup Explanation
Level of sound (in decibels) was collected using a Vernier Sound Level Meter (Vernier SLM-BTA) in conjunction with a Vernier LabQuest 2. The data was collected under 22 different conditions, as specified in the table above. All data, with the exception of data point 20 (see table), was recorded for 180 seconds. The Time Weighting switch on the Sound Level Meter (SLM) was set to “S” (slow), as is standard for most measurements. The Maximum Level Hold switch on the SLM was set to “Reset,” so that the screen would continuously display the sampled reading as opposed to the maximum reading. The Frequency Weighting switch on the SLM was set to “A,” which measures sound levels that most match those in the human hearing range. The Power/Measurement Range Switch on the SLM was most often set to “Lo,” which measures amplitudes in the range of 35-90 dB. When appropriate (when dB exceeded 90), the switch was set to “Hi,” which measures amplitudes in the range of 75-130 dB.
Explanation of Data:
The data is displayed in the table above. After collected, all data was transferred to the computers and analyzed in Logger Pro 3.8.6.1. The mean amplitude (dB), range, and slope of each graph was extracted using Logger Pro. This information, along with a photo of each graph is in the table. The mean amplitudes will be used to determine which conditions are damaging to human hearing after prolonged exposure. According to the National Institute on Deafness and Other Communication Disorders and to The American Speech-Language-Hearing Association, repeated or prolonged exposure to sounds at or above 85 dB can be damaging. Based on this statistic, the data will be analyzed to determine which sounds (based on mean dB) are dangerous.
Technology involved:
Two Sound level meters: Vernier SLM-BTA (Type 2) were used in conjunction with two Vernier LabQuest 2 to record the sound level of each condition. The Vernier LabQuest 2 recorded the data and provided graphical representation of the data for each of the conditions. For further analysis, the Vernier LabQuest 2 were connected to computers (a MacBook Pro and a Samsung Series 9 Laptop), which had Logger Pro 3.8.6.1 installed. We utilized the stats tool and the linear fit tool to analyze the data in Logger Pro. Further more, we created a graph of the average dB level exposure per activity (Average dB for each data point) and created a chart of all of the data using Google Docs.
Conditions under which data was taken:
Twenty-two conditions with various amplitude levels, from studying in the library to a Villard room party, were studied. Please see table above for specifics.
Citations:
“Noise.” ASHA. n.p., n.d. Web. 17 Feb. 2014.
“Noise-Induced Hearing Loss.” NIDCD. NIH, Oct. 2013. Web. 17 Feb. 2014.
Good organization. Do you have any recommendations for students to preserve their hearing?