Results:
Explanation of Results:
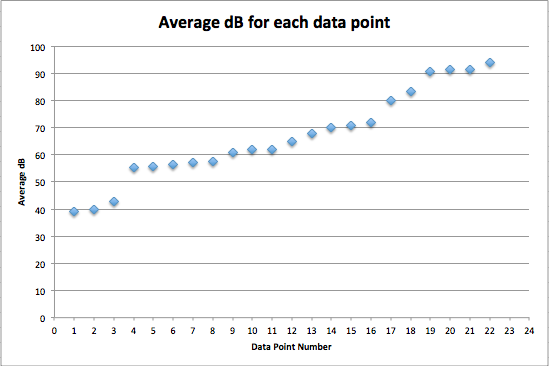
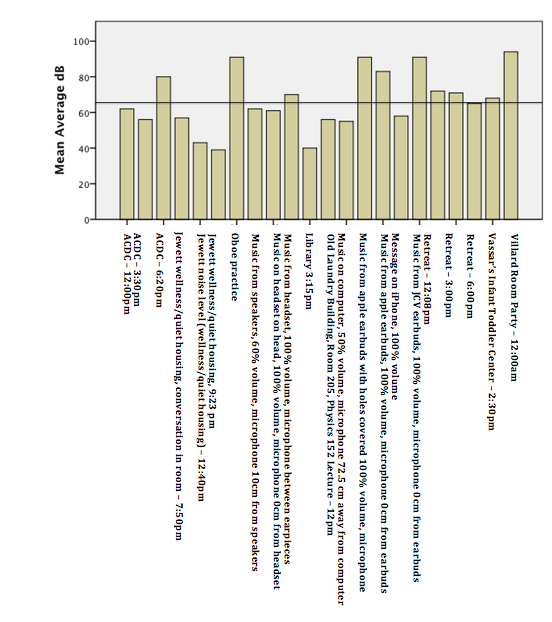
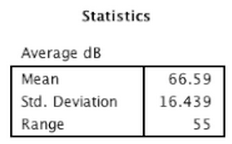
The results in the above graph show the average dB levels for each condition. The line across the center of the graph shows the mean dB level of all trials, 66.59 dB. The standard deviation from this mean is 16.439 dB.
The vast majority of the conditions we tested do not pose a threat to our hearing. Sound during lectures, during meals, from computer speakers, in our rooms, and in the library was not found to be harmful. Even while working in the Vassar Infant Toddler Center, surrounded by crying babies, there seems to be very little danger. However, some of the sounds recorded were loud enough to eventually cause hearing damage. According to the National Institute on Deafness and Other Communication Disorders and to The American Speech-Language-Hearing Association, repeated or prolonged exposure to sounds at or above 85 dB can cause damage to, or death of hair cells. Hair cells are sensory receptors of the auditory system, in the cochlea. Damage to hair cells often results in hearing loss.
The average amplitude of the Villard room party we measured was 93.8 dB. According to the Center for Disease Control and Prevention (CDC), repeated exposure to this amplitude for under two hours could be dangerous to hearing. The sound intensity reached as high as 101.5 dB in the Villard room party. According to the CDC, repeated exposure of just 15 minutes at a time can cause damage when the amplitude of the sound is at 100 dB. This is to say that going to Villard room parties repeatedly over your time at Vassar, could cause permanent hearing loss.
We tested the intensity of sound that comes out of headphones and earbuds multiple times in the project. When listening to music at 100% volume from a headset, the mean amplitude was only 60.86 dB, which does not pose any threat to hearing, even after long exposure. Listening to music at 100% volume from Apple earbuds, the mean amplitude was 83.39 dB and the intensity went up to 91.48 dB at some points. Over years, these intensities can damage ears after repeated exposure of just a few hours a day. Apple earbuds have holes on the back that let some of the sound escape from them. They are made to lower the likelihood of causing damage to your ears. For one of our runs, keeping the volume constant, we covered these holes and found a mean amplitude of 91.46 dB and a high of 101.9 dB. The mean amplitude of the sound from the covered earbuds was essentially the same as the highest amplitude emitted from the uncovered earbuds. The highest amplitude for the uncovered earbuds run was high enough to cause damage after exposure of less than 15 minutes a day, according to the CDC. We also tested another brand of earbuds, JVC, that do not have holes on the back to release sound. The mean amplitude was 90.66 dB and the highest was 97.23 dB. These values were higher than the sound levels we measured from untampered Apple earbuds, and only slightly lower than the intensity measured when the Apple earbuds were covered. This indicates that the holes on the back of Apple headphones do in fact work to protect listeners from hearing loss.
Another potentially hazardous source of sound we are exposed to is from musical instruments. We measured the sound emitted from an oboe, and found a mean amplitude of 91.29 dB and a high of 101.40 dB. Over a few years, exposure to these sound levels for even less than 2 hours at a time, can cause permanent damage. This is important to note because people who play instruments often have 2-hour long rehearsals, and have to practice by themselves on top of that.
Somewhat surprising to us, was that the ACDC at dinner time reached sound levels of 91.31 dB. The mean amplitude was only 79.9 dB, which is not damaging, but the sound did get intense enough to cause some damage over extended periods of time. Considering that many Vassar students eat at the ACDC every night for months, this is an interesting find. According to the CDC, repeated exposure to 90 dB for even less than 2 hours at a time can cause hearing damage. The data suggests that the sound fluctuates enough that no student would be exposed to 90 dB of sound for an entire 2 hours at the ACDC. However, it is something to keep in mind on especially busy ACDC nights.
Expectations:
Our results were for the most part as predicted. For example, we did not expect quiet places, such as the library or our own rooms, to be loud enough to cause hearing damage; we wanted to study them for comparison. We expected the sounds at the Villard room party to be intense. However, we did not realize how damaging they would be. As explained above, repeated attendance at these parties could cause permanent hearing loss. We expected the sound emitted from headphones at a high volume to be enough to damage ears, because this is one of the main warnings you are given when told about hearing loss. However, we did not realize the difference that different types of headphones/earbuds would have on our measurements. The same song was played at the same volume through different earbuds, and resulted in different amplitudes.
Problems that arose:
It is important to point out the limitations of our study. We were only able to measure most conditions one time and the data would be stronger if the measurements were repeated. We also had difficulties when measuring the sound emitted from headphones/earbuds. We held the microphone up to the speakers, in an attempt to imitate the placement in relation to our ears when we are actually listening to music. However, in actuality, part of what makes headphones/earbuds so dangerous, is that the sound is tunneled through the ear canal to the inner ear. We were not able to recreate this, and some of the sound escaped during our measurements. This would be an interesting problem to attempt to solve. Possibly a model of the human ear canal would be needed to take accurate measurements of which sounds are really reaching and damaging hair cells.
Take away message:
In order to prevent hearing loss while at Vassar, students can limit their prolonged exposure to Villard room parties and limit their proximity to those practicing loud instruments. Additionally, we have observed the effect of tampering with headphones, and demonstrated the importance of using earbuds as intended, and at moderate volumes. Investing in a pair of headphones that allows sound to escape may be beneficial, as would be keeping them in their original condition.
Science we learned:
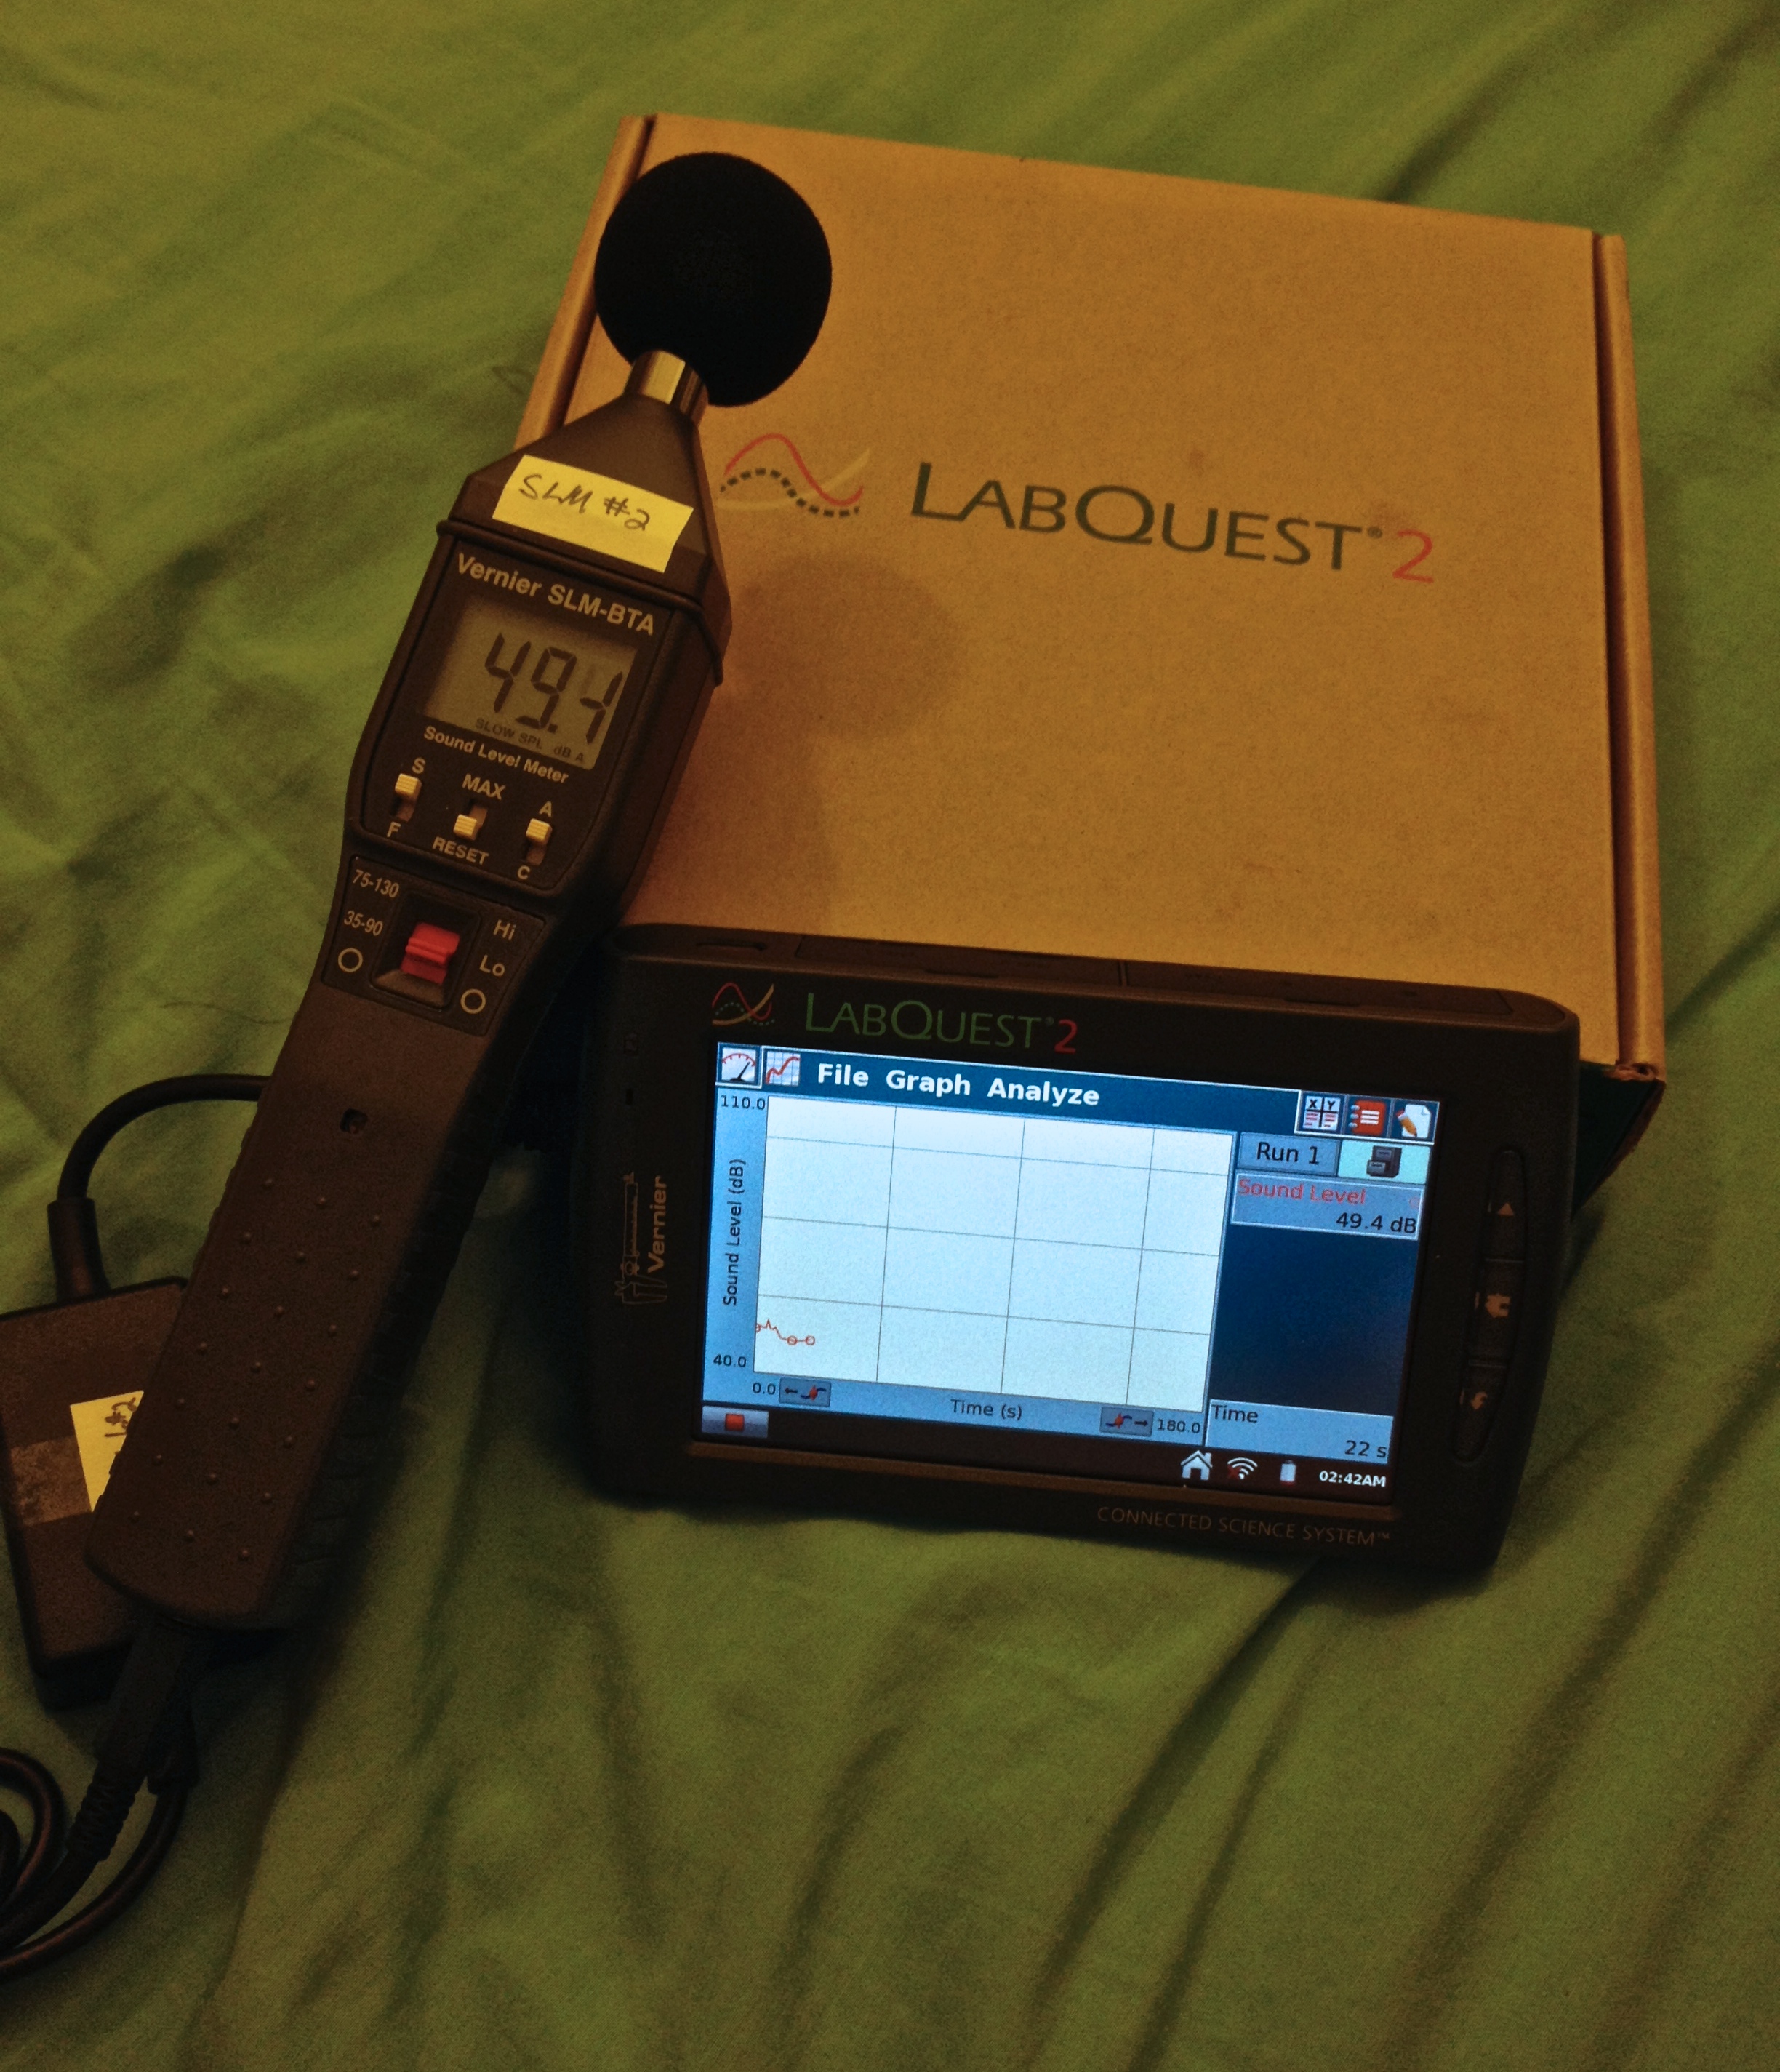
Although we already knew about sound amplitude and decibels, through the project we learned the significance of these measured values. We learned that 30-40 dB is very quiet while 85+ dB can be damaging over time. We also learned how to use a Sound Level Meter (SLM), which we used to take our data. By playing with the different SLM settings in order to figure out which to use, we learned more about it. For example, we could either record continuous measurements of fluctuating sound, or just record the maximum values, depending on the setting. We also learned that different settings are needed to measure lower amplitudes versus higher ones. We learned that the SLM has a microphone that senses and records sound. When connected to the LabQuest 2, the data resulting from the recorded sounds was displayed as a graph. We could then connect the LabQuest 2 to a computer with Logger Pro to further analyze the sound.
Additional data we would have liked to look at:
If we could have done this differently, we would have also tried to record the frequencies of the sound waves. With our limited amount of time, we were only able to obtain the amplitudes of the sound waves. We would have also liked to note how often an average person is exposed to these sound levels and for how long. We had some events that were extremely loud that many students only attend once a month, so the effect of these occasions may seem insignificant in the grand scheme of things.
The Next Step:
If we had another six weeks, we would have taken a lot more data. Particularly, we would try to have a larger variety of data, but also enough points for each activity to get a good average for each activity. We would have also liked to calculate how long the exposure to a certain activity had to be to damage our ears.
Citations:
“About Hearing Loss.” CDC. n.p., n.d. Web. 25 Feb. 2014.
“Noise.” ASHA. n.p., n.d. Web. 17 Feb. 2014.
“Noise-Induced Hearing Loss.” NIDCD. NIH, Oct. 2013. Web. 17 Feb. 2014.