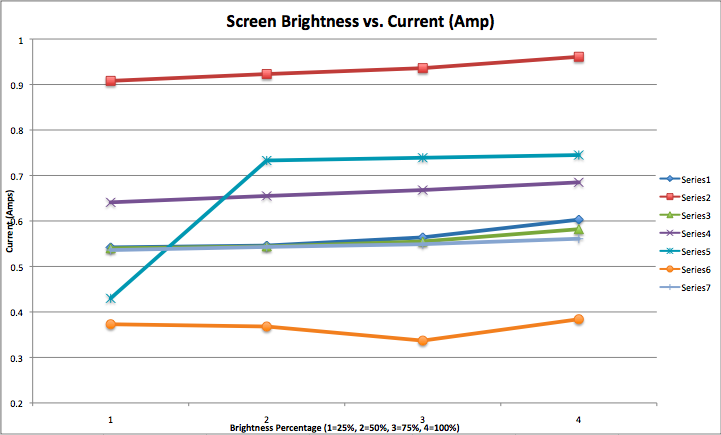
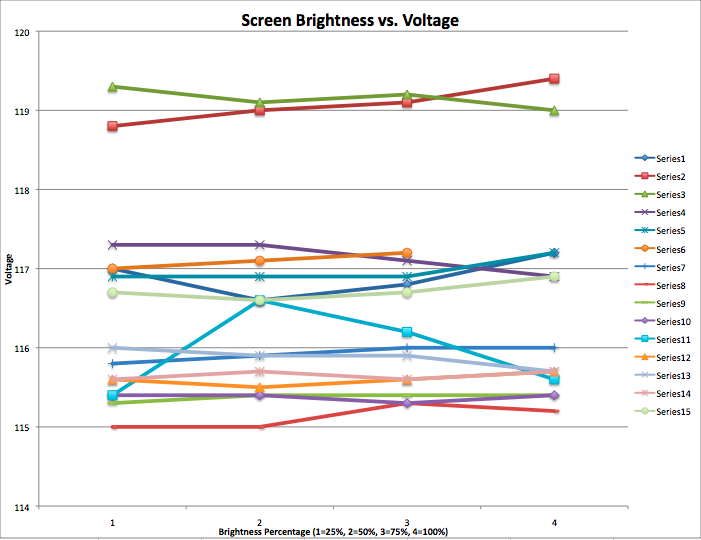
We graphed the output of power, current, and voltage for each laptop computer we received data from. We excluded all zero values, as we attribute those recorded values to a malfunction in the Watts Up Pro or human error while recording data. We can see from our graphs that power and current increase, if only slightly, when the screen brightness is increased. The voltage, however, does not seem to change much and does not have an overall trend of increasing or decreasing when the screen brightness was changed.