Author Archives: joloree

Adam Warner Project Review by John Loree

On the whole, I thought your project was very well done, however there are a few pints within that I found to be somewhat unclear. First, your explanation of the differences between European and American options is delayed until your final results, and is somewhat sparse. Second, the equations used for the finance Monte Carlo method are neither shown nor explained, as are the rest of the parameters in the Ising model aside from the tendency to act within the market (Ci and Si). It would have been helpful to have provided a slightly more rigorous outline of each of the equations you provided above the very good general explanation. Finally, I think a section mentioning the further possible uses of each model in finance above these relatively simple scenarios would have been interesting, not something necessarily in depth, just a section that prompts the reader to consider further, more useful applications of your option models.

To elaborate on the first critique, In you preliminary data you mentioned how the European option is easier to computationally model using the Black-Scholes model, and later, in your results, you state how the primary difference between the American model and European models are the ability to prematurely act upon options prior to reaching maturity. While you provided a convincing argument as to why the binomial trees provide a better prediction, you did not provide an argument as to why the Black-Scholes model is useless. Having read your explanations and code, it is clear that binomial trees are more complicated and volatile, and your project would be strengthened greatly by explaining why this extra complexity needs to implemented.

The second critique has to do with understanding each of the models that you use. While your project delves into depth on the background theory of Monte Carlo integration and approximation, as well as consider the general sweep of each each of the methods in your write up, some of the innards of each equation are left unclear for the reader. In the Monte Carlo method, you discussed how you were able to price options using a simpler equation that required less variables. It would have been helpful to show this equation and discuss why it is applicable to finance options. As for the Ising model, you discussed the magnetization and market tendencies of the buyers and sellers, yet you did not discuss how your approximation of the strength of the relations with nearby nodes (the “first term” of Equation 3 in your conclusion) affects the market strategies of each of the buyers.

My final critique is a direct result of the obvious simplicity of this method. Even to someone poorly versed in Economics and market theory, it is clear that this method is a loose estimate, at best. The volatility of the market is arbitrarily set and constant, the market must be modeled in isolation, and all the actors in the market have to be actively participating. In reality, markets can become more or less volatile as you have discussed and would have been nice to have seen that model implemented or elaborated upon in your conclusion even though you ran out of time. Furthermore, it would have been inspiring to talk about the possible ways to take the market out of isolation in a model, ie to model related markets through independent, co-inhabiting Ising models. This could then inspire the reader to think about the possible use of the ising model in practice, for example modeling the fracking and deepwater crude oil platform markets. However, I was taught a significant amount by your project, and thought on the whole it was extremely successful.

Share

John Loree Project Conclusion

Neuroprosthetics Data Analysis: Project Summary

John Loree

This project was designed to create a rudimentary data analytics software for a Neuroprosthetic controller to be used in my possible 2015-2016 Senior thesis in physics. During this project, I have developed a rudimentary data analysis program which inputs data from an EMG, and calculates two key parameters: peak spike amplitude and spike duration.

Initial Goals

My initial goal for this project was to develop a data analysis program that served the following purposes:

1: Use a Fourier transform to excise the major sources of noise in the signal including movement artifacts and common appliance noise

2: Design a program which can calculate data quasi-continuously (i.e. collect and analyze data in .1 s increments)

3: From the quasi-continuous data find the peak cycle amplitudes and spike duration for each bin and sort the signal into three regimes, a contracting state, a hold state, and a state representing a “rest” position.

4: Ensure the code is easily transferable to other formats / coding languages such that it can be used elsewhere in my thesis.

What I did:

1: The code was successful in sorting and solving for the peak amplitudes and spike duration of the experimental data. However the spike duration is different from the cycle duration (which is more useful) and is not currently calculated. However, the code can easily be adapted to solve for this. The reason it has not yet been modified is that the thresholds and methods by which cycles are delineated are unclear and are part of the larger thesis experiments, therefore they do not fall under the purview of this project.

2: Although the code developed for this project specifically and attached to this submission is unable to run quasi-continuously, the architecture implemented can easily be arranged such that it does run quasi-continuously.

3: The code does successfully sort the data into each of the three regimes, and “tags” them numerically by adding whole numbers to distinguish each of the regimes (0.xxxxx is a contracting state, 1.xxxxx is a hold state, 2.xxxxx is a rest state)

4: The code is easily transferable to other coding languages and formats. With the exception of the Fast Fourier Transform command and language specific syntax, the commands used in the code are language independent. This will allow the code to be transferred to Arduino, which controls the movement of the arm itself streamlining and speeding the execution of each of the experiments.

Methods

The code and parameters for which it solved for were inspired primarily by two papers:  Filtering the surface EMG signal: Movement artifact and Baseline noise contamination by Carlo De Luca (2010) and Modulation of in vivo power output during swimming in the African clawed frog  by Christopher Richards (2007). The code was written in Matlab, and 3 sample Human EMG data sets were found from a medical database online.

The program has three main sections. First, matrices are created to store the relevant results and initial parameters of the system. Then the input EMG code is chopped into bins .1 seconds in length and each bin progresses through the rest of the code sequentially and independently. From this, the chopped data is passed through a Fourier transform, and the major sources of noise are excised. The excised noise sources are as follows: <20 Hz noise originating primarily from movement artifacts and low frequency pressure waves and 60 Hz noise stemming from most electrical appliances and lights.

The second section solves for the spike amplitudes in each bin. Using the findpeaks command, the locations and magnitudes of each of the spikes are solved for using nested if/else and while loops. The locations of each of the peaks are passed into the third section, while the peak amplitudes are saved as one of the output parameters.

The third section solves for the spike duration and splits the signal into each regime. To do so, a series of nested if/else and while loops are set to proceed from each spike and the beginning of the bin. First, the spike durations are calculated using the locations of the peak amplitudes from the previous section of code. After the spike durations are found, the code cycles back and calculates the regimes where the arm is considered to be either holding  or going to a rest state. Any excess time within the bin created as a result of conditions to maintain code stability is then characterized as a hold state, which will allow the physical Neuroprosthetic arm to catch up to the computation in the physical system. The final output durations are then tagged according to which regime they belong into and the results are output in a cycle durations matrix for each bin.

A fourth section, which is only utilized if no spikes are detected in the current bin, goes through the same procedure of finding the hold and rest regime durations for the inactive bins.

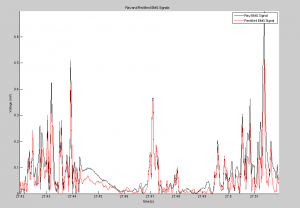
In the code graphs of the original signal, comparisons of the rectified and original signals for each bin and the total program are created to allow the experimenter to have a visual verification of the efficacy of the code.

Results:

As discussed previously, the code was both successful and stable. Following the Fourier noise rectification, the signal was clearer and more legible than the original signal, and the data was still maintained. The peak amplitude outputs are accurate, and are positioned in the output matrices identically to their corresponding spike duration for easy identification and analysis. Similarly, the code successfully found the regime durations in each bin, with hold, contracting and resting states all distinguishable and present in the appropriate locations and placed sequentially.

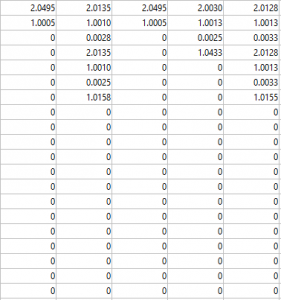
Analysis of the output signal figure will shows the noise reduction caused as a result of the Fourier noise analysis, and the table, showing the output cycle duration matrix, shows how cycle durations were successfully found. To see larger images, please see either the google drive folder associated with this project, or click on the images themselves.Screen Shot 2015-05-13 at 10.14.31 PMScreen Shot 2015-05-13 at 10.15.32 PM


Conclusion and Future Experiments

I am satisfied with this initial foray into Neuroprosthetic data mining. The data outputs were accurate and returned the information that I sought to solve. Furthermore, the architecture of this code is easily transferable to other formats and coding languages, and can be modified to solve for other experimental parameters dependent on the needs of the other experiments.

Although in and of itself, this experiment is extremely successful, and wide number of individual parameters can be calculated by altering the analysis code slightly, the architecture itself may prove unsatisfactory in later experiments. The reason for this is that this code currently only processes data stemming from a single data input. However, there are a number of models for nerve activity that are reliant upon populations and pre-contraction initial conditions (Churchland, 2012), which are significantly more complicated and cannot be solved for using the current architecture. However, I believe that it is not necessary to use that kind of population level model, in which case this architecture is sufficient for later work.

Further modifications to this code will be to change the parameters that the code solves for, as well as transferring the code Arduino such that it can be installed directly into the robot arm. Furthermore, there is a significant amount of information lost through data processing in the name of preventing crashes, which is an inefficiency that I intend to remove in the future. The code developed for this project will serve as an initial, rudimentary data mining code which can be used in a number of different ways elsewhere in my future projects and investigations into neuroprosthetics.


Relevant Files can be found through the link below with headers:

1: EMG_Data_Analysis_427.m

2: SampleEMG1.mat

3: SampleEMG2.mat

4: SampleEMG3.mat

https://drive.google.com/drive/#folders/0B0K4JjJfDy1ffkR4eEZaMzlxb0xvTjRjWDBIUm9iVzZuRmVyeG1aM0RhWHMxcVB6RXZDUFk

References:

1: De Luca, C. Gilmore, D. Kuznetsov, M. Roy, S. Filtering the surface EMG signal: Movement artifact and Baseline noise contamination. Journal of Biomechanics (January 5, 2010) 1573-1579

2: Richards, C. Biewener, A. Modulation of in vivo power output during swimming in the African clawed frog. Journal of Experimental Biology 210 (2007) 3147-3159

3: Lichtwark, G. Wilson, A. A modified Hill muscle model that predicts muscle power output and efficiency during sinusoidal length changes. Journal of Experimental Biology 208 (2005) 2831-2843

4: Computational Physics by Nicholas J. Giordano and Hisao Nakanishi

5: Churchland, M. et. al. Neural population dynamics during reaching Nature (2012) 51-56

Share

John Loree Final Results

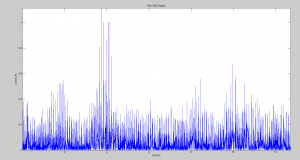
Unfortunately, I was unable to finish hacking the equipment in the laboratory to harvest EMG signals. This is because I do not have access to LabView hardware in my lab yet, and as such am currently unable to read my own surface EMG signals onto a computer. However, the sample signals mentioned previously in the preliminary data proved sufficient to proof this code and derive an understanding of the capabilities of this version of the algorithm. Pictured below is the absolute value of a sample EMG spectra (EMGSample1.mat), which allows a viewer a better understanding of the kinds of trends within the signal easier.

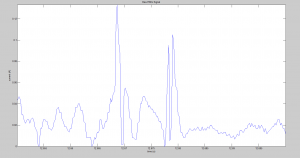
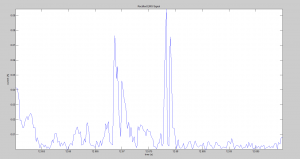
Raw_EMG_signalI was successfully able to create a working code that finds the peak amplitudes above a contraction threshold, and the thousands of separate cycle durations distinguished in order for each of the the three states of action in the robotic arm, contracting, holding at a contraction, or resting/ returning to resting. Like the previous iteration of code, this version implements a FFT (Fast Fourier Transform) noise analysis process to help eliminate the primary sources of noise in the EMG signal, 60 electronic noise and low frequency (<20 Hz) vibrations. Although significant, the effects of this noise cancellation is not sufficient to fully extinguish all experimental noise. For this data, I cannot include any further analysis as I do not know the lab conditions from which this data originated. Pictured below a snippet of the raw EMG spectra is shown above that same data after being passed through a rectification process. Although noise is still an issue in the rectified signal, the rectified data is more workable than its predecessor. However, since a Fourier transform is a frequency analysis tool, I have had to abandon running a truly continuous analysis in favor of chopping the data up into smaller bins of some small time and going through the analysis process for each bin individually as a quasi continuous process.Raw_EMG_signal_smallRectified_EMG_signal


For the purposes of testing the efficacy of the EMG analysis code, the noise threshold, which determined whether the arm would be in the resting state or holding some strained state, was made lower than it ought to be in a practical experiment. Similarly, the threshold that determines when the signal indicates contraction was lowered, such that there would be more opportunities within each signal to evaluate if the code was executing as intended. The data for both peak amplitude and cycle duration is saved in a 20 by j matrix, where j is the number of bins that characterizes the stagnant code in this iteration, or in a later version the number of bins that have been created up to this point.  For cycle duration, the data is stored for each bin as a column vector in a matrix, with elapsed time for contraction cycles, rest cycles, and holding cycles stored in order (values 0-1 contraction, 1-2 holding, 2-3 resting). Similarly, the values for peak amplitude during the contraction cycles are stored with the same indices as the contraction duration that they occur during. The peak amplitudes are represented as a proportion of the contraction threshold, which will allow for easier programming of the robotic arm downstream.

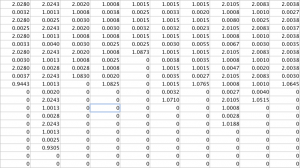
The data sets are inordinately large, so I will leave it to the discretion of the reader to use Google drive to access the code and run the results. However, the image below is a screenshot of the results for cycle durations of the first data set (SampleEMG1.mat) between 1.85 and 2 seconds. Although this code serves its purpose, it is not a perfected or completely stable arrangement. Due to the large datasets and indexing method used, changing noise threshold outside of a small range around .1 can or altering the algorithm that controls the analysis can cause the code to crash.

 Cycle durations for 1.9s-2s

Furthermore, as a byproduct of ensuring a higher degree of stability such that the code is reasonably likely to function properly over a dataseries, the cycles are trimmed slightly and lose resolution in each bin. To compensate for this, any excess time in each bin that has not been accounted for is said to be a hold state at the end of the bin. Though this may seem inefficient, This extra time at the end of each bin will allow the physical system and computational analysis to stay at pace with one another, as the extra hold time can be reduced while the physical system tries to continue a motion. Further work on this code will include making it more robust and resilient, as well as finishing on getting my own EMG signals to analyze. Outside of the context of this class, I plan on integrating the analysis code with the code to control the robotic arm, as well as increasing the sophistication of my model such that the outputs and conclusions better correlate with physical action in a biological agent.

Relevant Files can be found through the link below with headers:

1: EMG_Data_Analysis_422.m

2: SampleEMG1.mat

3: SampleEMG2.mat

4: SampleEMG3.mat

https://drive.google.com/drive/#folders/0B0K4JjJfDy1ffkR4eEZaMzlxb0xvTjRjWDBIUm9iVzZuRmVyeG1aM0RhWHMxcVB6RXZDUFk

References:

1: De Luca, C. Gilmore, D. Kuznetsov, M. Roy, S. Filtering the surface EMG signal: Movement artifact and Baseline noise contamination. Journal of Biomechanics (January 5, 2010) 1573-1579

2: Richards, C. Biewener, A. Modulation of in vivo power output during swimming in the African clawed frog. Journal of Experimental Biology 210 (2007) 3147-3159

3: Lichtwark, G. Wilson, A. A modified Hill muscle model that predicts muscle power output and efficiency during sinusoidal length changes. Journal of Experimental Biology 208 (2005) 2831-2843

4: Computational Physics by Nicholas J. Giordano and Hisao Nakanishi

Share

John Loree Preliminary Data

As of 4/13, I have yet to finish hacking and reassembling all of the equipment in my laboratory to take my own EMG (electromyography) data. As a refresher, an EMG is a means of measuring nerve activity by analyzing voltage changes in muscles either on the surface of the skin or subcutaneously. However, I believe that I should be able to complete the relevant assembly of the EMG kit prior to the end of the project.

That being said, I have completed the initial version of my data analysis code to be implemented in this project, as well as in my thesis. This version uses two data set inputs, a raw EMG signal, and a corresponding time vector. In addition, the code requires the sampling frequency. Beyond this, the experimenter has to set noise and contraction thresholds. The noise threshold serves the dual purpose of compensating for any noise not already dealt with in the Fourier transform, as well as setting the region below which the robot will relax and return to the rest state. The contraction threshold, determined by the relative magnitude of successive peaks to a standard strained peak determined immediately following the transform process.

The two Fourier transforms performed on the raw data, forward and back, allow the code to eliminate the most significant predictable sources of noise, that if left ignored, would render any analysis worthless. The three largest sources accounted for currently are movement artifacts, electrical artifacts, and electric noise. The first two noise signals are generated as a byproduct of the EMG process, mostly existing below 20 Hz. Most electric devices emit strong interference at 60 Hz. Following the forward transform, these frequencies are negated and zeroed, then back transformed to create a rectified, useable signal for later analysis.

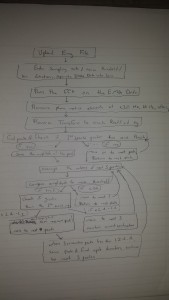
The code is meant to reliably extract the peak amplitudes and cycle durations of up to two contractions by binning the raw EMG data into smaller datasets that are then analyzed. The reasons for this are that it makes coding less difficult as well as opening up the possibility of a quasi-continuous computation. By chopping  the data into bins and analyzing them separately, the code can process data quickly after the signals are created, which in a living subject, corresponds to continuous motion of the prosthesis. In the picture below, the initial analysis code is represented as a flowchart.

Flowchart

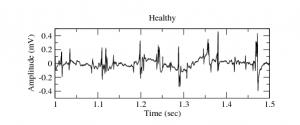
Additionally, I have found a raw sample EMG data set with a time vector, which if needed, can serve as the data for this project. This was available on a public domain, the link to which is below the figure of a raw EMG signal below and in the corresponding google drive document attached to this submission.

Capture

http://physionet.org/physiobank/database/emgdb/

Further work will include improving my code such that it is more independent of the data inputted, more modular, and generally faster/more efficient. Additionally, I have yet to comment on the code, which will be another component of this project. I expect for the final data to have improved my code and run analysis on either data that I have taken, or if I cannot get my experiment assembled and working to a reasonable extent, the sample EMG that was available online.

Relevant files can be found here:

https://drive.google.com/drive/u/0/#folders/0B0K4JjJfDy1ffkR4eEZaMzlxb0xvTjRjWDBIUm9iVzZuRmVyeG1aM0RhWHMxcVB6RXZDUFk

Share

John Loree Project Outline

The goal of this project is to extract 2 relevant measures stemming from an EMG or nerve signal, the peak cycle amplitude and cycle duration. These two measures as demonstrated in several academic papers in a variety of model organisms, are the measures most consistently correlating with a muscle response. An idealized nerve spike train signal appears as repeating spikes, whose amplitudes and frequencies vary according to the action at hand. However, this method has several issues with both execution and correlating to the physical model. Primarily, depending on the scenario at hand, there will be constant low level nerve activity corresponding to maintaining a given muscular contraction, this activity is extremely difficult to distinguish from noise.

The relevant measure will be quasi-linked in the code, with the program measuring nothing, peak amplitude, or amplitude and cycle duration depending on the magnitude of the signal from the EMG. However, prior to any signal extraction, the program will run a Fourier transform (due to software, hardware  and time restrictions, this iteration will likely store data in bins and process after each bin, as opposed to continuous measurement), excise the largest and most common noise signals (such as 60Hz noise emanated by  many electronic devices), and transform the spectrum back as a rectified signal. The system will not update (essentially being in a resting state), when there are no peaks above a noise threshold for a given duration. This  first threshold, determined by measuring the mean peak magnitude of noise registered by the EMG that is not connected to a live test subject will provide a lower limit on the kinds of information that the program will save. Above this first threshold, the program will record the peak amplitudes of the EMG signal. This can be used to keep the robotic agent at some non-resting state, without any motion. A second threshold, determined by the difference of magnitude between 2 measured peaks, will incite contraction in the arm. Once this threshold is passed, the program will measure all peaks for the cycle, and the the cycle duration (start and finish determined by the difference between each contracting peak and the last pre-contraction peak). The cycle duration will control the length of the contraction as determined by a scale elsewhere in the project, and the highest peak will be used to set the speed of the robotic arm’s motion.

Each signal will correspond to a single robotic degree of freedom, such that this program will be repeated uniquely for each EMG channel. A major limitation at this initial stage of design is available processing time, as the time required to process each signal will likely exceed the time that the biological agent would execute the same motion. As such, this initial setup will have signals taken at a different time than processing. This iteration will be written in Matlab, although later versions of the code will likely be run elsewhere.

Timeline:

Week 1: Execute background research, create an architecture on paper to use as a blueprint for the actual program

Week 2: Write the code for the Fourier transform, bin size to be determined later, harvest the noise signal and find the lower threshold for the data acquisition program

Week 3: Write the code to gather the relevant signals and set the thresholds and bin sizes depending on processing time.

Week 4: Finish writing/modifying code, prepare presentation and write up report for the project.

Sources:

TBD (There are several from the thesis list, I just have to select which ones I am going to use and possibly gather a few others)

Share

John Loree Project Proposal

I am currently working on a senior thesis in Physics. As part of this project, I intend to harvest nerve spike train signals using either an EMG apparatus or a fine-needle electrode direct to the nerves in interest. These signals tend to be obscured heavily by noise, and as such are difficult to use experimentally. For this project, I intend to use a Fourier Transform or other computational methods to separate out EMG signals from background noise, and extract the relevant parameters from those nerve signals (duty cycle frequency, peak cycle stress) that can be used to help control a robotic agent elsewhere in my project.

Share

Critique: Modeling Electric and Magnetic Fields

At the end of the preliminary data section, the Electric Field of a bar electret is stated to be approximately that of two opposing charged point charges at either end of the bar. However, little explanation is given as to why the bar can be modeled that way. If there was a justification given for this model, such as modeling many charges arranged in a line to show that the net fields cancel aside from the two charges at either end, the data would significantly benefit from this. Finally, it is unclear in the final data whether or not you are modeling a bar electret or an electric dipole.

Additionally, it is unclear why you chose the specifications for the dipole bar magnet, as well as the surrounding constants and values for the other scenarios. Although it is clear from a knowledgeable individual’s standpoint why the charges were assigned the equations as they were, a layperson may not be able to interpret the equations correctly.  Additionally, including the full derivations for each scenario on the preliminary data in mathematica would streamline the analysis of the data significantly, as the constants themselves would become more clear with this. Additionally, the equations that yield the specific graphs in the final data you are showing should be wrote, so that I we can associate the data and figures easily.

Finally, I suggest making the equations and derivations slightly more robust. By that I mean carrying out the derivations for these geometries in matter, as to better replicate the situations which a student may come across. Currently, this issue is approached without giving thought to the effects of polarization and the various materials involved. This may prove to both improve the depth and breadth of the project. Another concern that I have, although it may be a fault with mathematica, is that the field of the electret, does not show the field’s shape clearly. I suggest using a different graphing method, perhaps a contour graph, which would allow the interpretation of field lines much more intuitively. As such we would then expect the graph to take the shape of an imperfect dipole, as stated in your data.

Share

Final Data and Conclusion

NOTE: some of the equations are too long to render fully. To see them in their entirety, either open the image in a new window or see the mathematica file

Force on the slug

In the preliminary data, an equation for the force in a railgun was calculated assuming a constant current in the system. This was:

    \[ \text{Fmag}(i,L,W)=\frac{\mu _0 \left(i^2 L \left(-L \sqrt{L^2+W^2}+L^2+W^2\right)\right)}{\pi  \sqrt{L^2+W^2}} \]

Where J is substituted for the I, because mathematica will not accept I for some strange reason. However, this is entirely inaccurate and essentially useless, as the current is almost never constant in time for a railgun. The graph does show, however, that for very small values of L, the force is small. This means that the slug must move into the loop far enough to experience a force before the current dissipates. Happily however, from the equation for the force calculated earlier, we can now find the total force on the system as a function of time using the equation of total current as calculated by Elias Kim.

    \[ \text{Fmag}=\frac{\mu _0 \left(L \left(-L \sqrt{L^2+W^2}+L^2+W^2\right)\right) \left(\frac{A Q_0 e^{-\frac{A t}{C \rho  (2 L+2 W)}}}{\text{C$\rho $} (2 L+2 W)}\right){}^2}{\pi  \sqrt{L^2+W^2} \left(\frac{A \mu _0 v \left((-\ln ) \left(L \sqrt{a^2+L^2}+L^2\right)+L \ln  \left(\sqrt{(W-a)^2+L^2}+L\right)-\ln  \left(L \sqrt{(W-a)^2+L^2}+L^2\right)+\ln  \left(L \sqrt{a+L^2}+L^2\right)\right)}{4 \pi  \rho  (2 L+2 W)}+1\right){}^2} \]

Where L is the instantaneous length of the loop along the rails, W is the rail separation (center to center), a is the radius of the rails, A is the cross sectional area of the rails, Qo is the initial charge in the capacitor, rho is the resistivity of the rails, v is the velocity, and C is the capacitance of the capacitor. We will then use this derived equation to solve for the force in two theoretical examples and provide simulations of the force as functions of time for each. For a small railgun, where a=.009, W=.03, C=450*10^-5 and Subscript[Q, 0]=1.8 we get

    \[ F=\frac{4 \left(\left(L \left(L^2-\sqrt{L^2+0.0009} L+0.0009\right)\right) \left(\frac{1.8 e^{-\frac{t}{(10 L+0.15) \rho }}}{(10 L+0.15) \rho }\right)^2\right)}{10^7 \left(\sqrt{L^2+0.0009} \left(\frac{9.04 k v}{10^{11} ((2 L+0.06) \rho )}+1\right)^2\right)} \]

However, although this is still more accurate than before, it is still not a completely accurate measure, as t and L are still expressed independently from one another. however, this issue may not be resolved as the equations of motion are too complicated to attain precise equations of motion.

For the military railgun, however, the force is significantly greater, with a C=1.5 farads, Qo=10000, W=.8, and A=.01 additionally, the logarithmic terms were solved for to be inside of a range of values, which were then plotted as the variable k. Additionally, it should be noted that the values of the capacitance and charge are derived assuming a 100% conversion between energy stored in a capacitor and kinetic energy. The resistivity was plotted to be at a minimum that of Aluminum.

    \[ F=\frac{4 \left(\left(L \left(L^2-\sqrt{L^2+0.064} L+0.064\right)\right) \left(\frac{10000 e^{-\frac{t}{(75 L+60) \rho }}}{(75 L+60) \rho }\right)^2\right)}{10^7 \left(\sqrt{L^2+0.064} \left(\frac{4 k v}{10^9 ((2 L+1.6) \rho )}+1\right)^2\right)} \]

These measures of force are significantly more accurate than the theoretical version shown earlier in the data. The reason for this is that aside from the previous issue of L and t still being unrelated, this graph demonstrates the correct behavior for this system. We can manipulate the values of L however, and can see a clear trend in the force as a function of time in the above manipulation. Upon firing, the force quickly reaches a maximum as both the loop becomes large enough and the current still is present in sufficient quantity to provide efficient acceleration, however, as time goes and the loop size becomes larger, this term then collapses to be insignificant. That being said, it is clear that even a small system can accelerate objects to incredible velocity. Additionally, the resistance in the circuit must be accounted for as it has a tremendous impact on the graph of the force.

By combining and altering our manipulations of the equations given above, a clear trend in the force appears. Most likely, the force will resemble an overdamped wave, as seen in classical oscillations and EM waves. This means the force will reach a maximum, then exponentially decrease until the slug leaves the rails.

Finally, by analyzing these examples and the general equations of force it is clear that there is an ideal set of dimensions for a given system to maximize the force upon the slug. If each value falls outside the ideal range, the force will quickly decline by several magnitudes from the maximum possible force.

The Inductance Gradient

Remember the force can also be given as

    \[ F=\frac{1}{2} i L_1 t^2 \]

The other way to measure the force experienced by the slug in a railgun is using the inductance gradient, L’, for the railgun, by which you can find the optimal measures for a given system. The inductance gradient is measured in microhenries per meter, accounting for the Mu term of the force. For most cases, this value is calculated experimentally, however, for a miniscale railgun, the method of Lagrangian optimization. The object of this method is to minimize the value of the goal function,

    \[ \pmb{P=G+\sum _{i=1}^m \lambda _i\left(J_{\max }(h,w,z)_i-J_{\text{material}}\right)}\ \]

The minimum of G is also proven to be the point of inflection in the P function. found using the second, series term of the P function. Eventually, this will form a regression, which can be evaluated using a system of equations to find the most efficient rail dimensions for a given system.

Where Jmax] is the maximum tolerable current density in the rails, and Lambda is an aribitrary constant. The Jmateral value is derived from the maximum tolerable current density of a copper cable (it comes from the material used in the system). The h, z and w, values are the dimensions of the rails. Jmax] is different from Jmaterial] because the current, attempting to take the shortest path through the system, will cluster in the corners between the rails and the slug.

Energy in a railgun

The most effective means to approximate the energy in the railgun is to use the capacitance and charge in the capacitor bank. Although this is extremely inaccurate while measuring the actual velocity and energy of the slug following firing of the system, it is an effective means to calculate the various constants going into the force. The muzzle energy can be calculated by measuring the kinetic energy of the slug following its expulsion from the loop, from this, it is possible to calculate the fraction of energy lost thermodynamically and frictionally in the system as discussed in the preliminary data. The energy in a capacitor is defined as:

    \[ W=\frac{Q^2}{2 C}=\frac{\text{CV}^2}{2} \]

The kinetic energy of any object is defined classically as:

    \[ T=\frac{\text{mv}^2}{2} \]

Using this we can theoretically calculate the efficiency of both our large and small railgun systems. For the small system, where 10 400V, 450 microfarad capacitors are wired in parallel, C=4500 microfarads, V=4000 V, the mass is 3.6 grams and the muzzle velocity was around 700 m/s. This gives the following values:

    \[ W=\frac{\left(4\ 10^3\right)^2 4500}{10^6 2}=3.6 \text{kJ} \]

    \[ T=\frac{0.0036 700^2}{2}=882 J \]

    \[ \frac{T}{W}=0.245 \]

For the small scale design, the system achieved a 25% efficiency in the transfer of energy. Although this appears to be a low efficiency, a standard firearm usually has an efficiency between 20-40%, and this is an extremely inefficient design for a railgun. The military, in their system tested in 2013, for which we modeled the forces earlier, the  kinetic energy was given to be 33MJ however, due to the fact that the precise specifications of the capacitors are classified, we cannot effectively measure the efficiency of the system. Their efficiency is most likely higher, probably around 60%. The reason for this is that for high efficiency designs, the slug design and rail geometry changes significantly. We have modeled the military design as a square barreled launch system, with rails on either horizontal side. However, it is likely that the real geometry is different, to increase the efficiency of the discharge, as well as reduce the inevitable wear caused by heat. Additionally, rather than routing the current through the slug, through a gap all the while dealing with high resistances and thermodynamic loss, the millitary system insulates the main body of the slug, while adding a material at the rear which when subjected to the initial current shock will become a plasma. This is a much more efficient design, and that, along with the ability to make the slug more aerodynamically efficient will increase the total efficiency of the system. Although we do not have the tools to fully explain the resistivity of the plasma (plasma physics is a graduate level study), the Spitzer resitivity of a plasma is given as:

    \[ \eta =\frac{\Lambda  \sqrt{m} \text{$\pi $Ze}^2 \ln }{\left(4 \pi \epsilon _0\right){}^2 \sqrt[3]{T k_b}} \]

*from http://silas.psfc.mit.edu/introplasma/ and Wikipedia, common knowledge to people who have taken plasma physics

Where Eta is the Spitzer resistivity, Z is ionization of nuclei, m is the electron mass, Curly Epsilon is the resistivity of free space, ln (Capital Lambda) is the Coulomb logarithm, k is Boltzmann’s constant and T is the temperature in kelvins. This value is presumed to significantly increase the efficiency. Additionally, the use of a plasma allows the system to be launched from rest, which as shown in the force approximations, significantly increases the efficiency of the system.

Acceleration on the slug

Using the derived equations of force found earlier, it is fairly simple to calculate the accelerations as functions of time in a railgun. Prior to showing, it ought to be noted that although the accelerations for even a small scale model are enormous, predicting in the hundreds of thousands, even tens of millions of metres per second squared, the slug only remains in the rails for periods best measured by microseconds, and the force dissipates even faster.

Given this understanding, the general form of the acceleration can be written as:

    \[ \text{Amag}=\frac{\mu _0 \left(L \left(-L \sqrt{L^2+W^2}+L^2+W^2\right)\right) \left(\frac{A Q_0 e^{-\frac{A t}{C \rho  (2 L+2 W)}}}{\text{C$\rho $} (2 L+2 W)}\right){}^2}{m \left(\pi  \sqrt{L^2+W^2} \left(\frac{A \mu _0 v \left((-\ln ) \left(L \sqrt{a^2+L^2}+L^2\right)+L \ln  \left(\sqrt{(W-a)^2+L^2}+L\right)-\ln  \left(L \sqrt{(W-a)^2+L^2}+L^2\right)+\ln  \left(L \sqrt{a+L^2}+L^2\right)\right)}{4 \pi  \rho  (2 L+2 W)}+1\right){}^2\right)} \]

For our two examples, the smaller scale measure using a projectile weighing 3.6 grams and our large scale millitary model used a projectile mass of 3.2 kg. Subbing those in and generating manipulations, we arrive at:

    \[ \pmb{a=4*10^{-7}\frac{\left(L \left(.0009+L^2-L\sqrt{.0009+L^2}\right)\right)\left(\left(\frac{1.8}{(10L+.15)\rho }\right)e^{\frac{-t}{\rho (10L+.15)}}\right)^2}{.0036\sqrt{.0009+L^2}\left(1+\frac{1}{\rho (.06+2 L)}9.04*10^{-11} v k\right)^2}}\ \]

for the small scale model, and:

    \[ \pmb{a=4*10^{-7}\frac{\left(L \left(.064+L^2-L\sqrt{.064+L^2}\right)\right)\left(\left(\frac{10000}{\rho (75L+60)}\right)e^{\frac{-t}{\rho (75L+60)}}\right)^2}{3.6\left(1+\frac{1}{\rho (1.6+2 L)}4*10^{-9} v k\right)^2\sqrt{.064+L^2}}}\ \]

For the military model. A is also the second time derivative of L as a function of T. So to find L(t), we can set up a differential using the acceleration to see if we can solve for theoretical values of velocity and position in the loop.

    \[ \partial L^2=\frac{\mu _0 \left(L \left(-L \sqrt{L^2+W^2}+L^2+W^2\right)\right) \left(\frac{A Q_0 e^{-\frac{A t}{C \rho  (2 L+2 W)}}}{\text{C$\rho $} (2 L+2 W)}\right){}^2}{m \left(\pi  \sqrt{L^2+W^2} \left(\frac{A \mu _0 v \left((-\ln ) \left(L \sqrt{a^2+L^2}+L^2\right)+L \ln  \left(\sqrt{(W-a)^2+L^2}+L\right)-\ln  \left(L \sqrt{(W-a)^2+L^2}+L^2\right)+\ln  \left(L \sqrt{a+L^2}+L^2\right)\right)}{4 \pi  \rho  (2 L+2 W)}+1\right){}^2\right)}\partial t^2 \]

where Mu, m, W, A, Rho, a, A, C, and Qo are constant with regards to t, while L and t are time dependent. This information, however does not help us solve this differential, which is impossible to be solved for. The real plots of position and time are almost always calculated experimentally, as are the inductance gradients. This is the most effective means to solve the system practically, as to arrive at our data, several simplifying assumptions had to be made.

Conclusions

The basic principles surrounding railgun physics are an excellent teaching tool to model much of the classical mechanisms of Electromagnetism. However, beyond the conceptual standpoint, the mathematics to calculate the specific quantities in the system are extremely complex. Since most of the variables are dependent upon one another, the resultant mathematics quickly expands into a long equations which cannot be computed. However, using the equations we have modeled, several understandings can be reached. First, the materials used in the railgun must be highly efficient conductors. Second, the geometry of the rails in question is crucial, helping determine the current densities, magnetic fields, forces and inductance gradient. Third, the force and resultant acceleration, when derived experimentally, should resemble an overdamped oscillator, where the system starts at 0, reaches a peak, then experiences an exponential decay. Finally, it is clear that for any railgun, regardless of setup, it can be assumed that there will be an enormous discharge of energy in an extremely small timescale, with forces anywhere from the hundreds of thousands to millions of newtons in the first few nanoseconds/ microseconds, depending on the size of the system. This last conclusion actually is the basis of the sub-field of engineering called pulsed power, which has a variety of applications.

Railguns, and by extension pulsed power, have a wide variety of uses. There is the obvious military benefit, being able to shoot kilogram sized objects with enough kinetic energy to annihilate most naval vessels at ranges previously limited to missiles. However, this technology is not only useful for that application. In a more optimistic setting, these systems can be used to quickly and cheaply accelerate objects into space (non-living, as the forces experienced to accelerate organic matter to escape velocity would most likely result in immediate death), Finally, and perhaps most interestingly, railguns have been proposed as starter mechanisms for fusion reactors, specifically inertial confinement systems. Using a railgun, the idea is to collide plasmas at high velocity into a single locus, hopefully triggering a self sustaining fusion reaction. Fusion is, of course the holy grail of energy research, and the invention of a self sustaining reactor would be a significant leap in technological progress.

Finally, although we had planned to regroup and construct a railgun, we simply ran out of time as well as material issues. We sent a request for materials into the associated offices on campus, and they responded on May 2nd. As such, we were under enormous stress to undertake that portion of the project. Although we gathered most of the necessary materials, there were several issues with assembly. First, we had to use a flash circuit as the basis for our railgun, unfortunately, in order to expose all the necessary terminals, the circuit had to be exposed. Additionally, the specific camera we used always had charge within the capacitor. As such, I shocked myself, a lot. Following this issue, we discovered that although the base components were available on campus, wiring that was appropriate for the circuit was being used both in the electronics lab, and the physics department. We then had to cut most of the circuit. Finally, we managed to make a semi-functional railgun; however, the slug possessed too high of a resistivity, and was too massive. So there was no launch, this limited our project’s scope, as most of the values for the railgun’s dimensions must be determined experimentally, as there are simply too many variables to cope with.

However, it is still possible to understand most of the railgun system using theoretical derivations. It became clear that when trying to design a system to deliver huge quantities of energy in a short time railguns are the ideal system, assuming there has been careful consideration given to the systems dimensions.

Mathematica notebook:

https://drive.google.com/a/vassar.edu/#folders/0B0K4JjJfDy1fNnE4MHJON0k4TDg

Share

Preliminary Data, Magnetic Fields and force in a railgun

From Biot-Savart law of a wire in a closed loop can be broken into 4 parts. Additionally, it should be noted that when considering Ampere’s Law:

Capture

The displacement current term is expected to be negligible. That is because in order for the instantaneous rate of change of the electrical field to be significant, the power, loop size and switching rate would have to be extremely, large, small and fast, respectively. Furthermore, for a railgun that size, the current term dwarfs the displacement term by several magnitudes, rendering it irrelevant.

Capture

Where z is the shortest distance from a point in space to the wire and theta and phi are the angles between the beginning and end of the wire, respectively. Modeling the circuit as four line currents then allows us to break the B field into four components and solve the above equation, yielding:

railgun

Capture

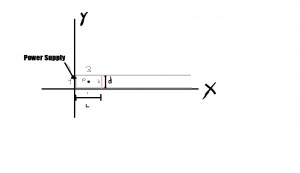
It should be noted that L is the distance from the start of the rail to the slug and is time dependent, x is the distance along the rails, d is the separation between the rails and y is the distance from the bottom rail. Combining these terms using the law of superposition gives the total magnetic field at any point within the loop.

Capture

However, since we are interested in the magnetic field on points within the slug, however, we can set x=L and remove the Bback and Bslug term. The removal of these terms originates from the fact that the nonrail sections are far removed from the slug and generate no significant field within the loop. Additionally, the Bslug term can be removed since due to conservation of momentum, the external magnetic field upon the slug can not be generated by the slug. Additionally, in order to ease calculation, we assume the slug is thin in the x direction, so that we do not have to include width considerations in our calculations. Therefore the Magnetic field upon a point within the the slug (hereafter referred to as B) is:

Capture

Next, we will calculate the force upon the slug. Using the Lorentz force law, F=I(dlxB). Since railguns are extremely high energy devices, using enormous currents withing the rails while firing, the best way to power these devices is using capacitors. As a result, the current is variable with time as the capacitor discharges. Additionally, as a result of Faraday’s law, there is an emf generated in the loop as the current and loop size vary, which also affects the current as a function of time.

The force direction is determined by the right hand rule between the direction of the current and the B field within the slug. For a counter clockwise current, the current flows in the positive y direction and the B field for all wire components, including the back and slug, point in the positive z direction (out of the page in the diagram), giving a right hand rule direction of +x.

Additionally, the B field described above is for a specific location along the projectile, and as such the B field must be integrated over the width of the slug. The total magnetic force on the slug therefore becomes:
Capture

The magnetic force can also be used in Newton’s Second law to solve for the current in the slug. Of course, this is entirely inaccurate, as there are several means for the current to change, including thermal radiation, rotation and voltage gaps between the slug and the rails. These effects are difficult to calculate and not the subject of this project, suffice to say that the most common method of dealing with these forces is to see what portion of the force is lost.

Since L is time dependent, and extremely fluid, the most common way of reducing this equation is to take the spatial terms and group them into a quantity called the inductance gradient. This quantity is the result of the complex induction effects within the circuit, and is dependent upon the waveform of current, geometry of rails, materials of rails and projectile This quantity, however, cannot be determined theoretically. There are not enough governing equations to solve for L. Instead, what papers concerning railguns use are complicated regression models to determine the optimum dimensions for the rails to maximize this inductance gradient, some of which will be modeled using mathematica in the final data. Therefore, the instantaneous force on the slug can be modeled as:

Capture

The Current, being modeled by Elias Kim, can then be inserted into this equation to provide an instantaneous force upon the projectile as a function of t, which can the be solved to (hopefully) provide equations of motion for the slug, and at the very least provide a unsolvable differential equation.

In this reduced form, it becomes clear that the most important factor in this equation is the current, which exponentially increases power as it is made bigger.  The 1/2 scalar multiple is the result of the common approximation that half of the current in the loop is required to maintain the expanding magnetic fields, and that only the other half produces force. The navy recently tested a gun that fired a 3.2kg slug over mach 7, this gun used over 33MJ of energy.

As for our physical construction, we had some “technical” difficulties with our design and the small issue of it firing a lethal projectile with highly expensive, dangerous materials. As such we are currently working to scale down our design and will construct it and test this weekend, posting the final specifications and results during the final data.

Mathematica Notebook: https://drive.google.com/a/vassar.edu/?tab=mo#folders/0B0K4JjJfDy1fNnE4MHJON0k4TDg
References:

http://web.mit.edu/mouser/www/railgun/physics.html

Elias Kim

http://ikiu.ac.ir/public_files/profiles/items/1295865343.pdf

http://www.livescience.com/7463-navy-tests-incredible-sci-fi-weapon.html

Share

John Loree Project Plan: 4/7

Sources and Resources:

1: Introduction to Electrodynamics by David J. Griffiths

2: http://web.mit.edu/mouser/www/railgun/physics.html

3: https://www.carroll.edu/library/thesisArchive/HarmonSFinal_2011.pdf

4: http://physics.wooster.edu/JrIS/Files/Rhoades_Web_Article.PDF

5: http://www.instructables.com/id/Rail-Gun-Linear-Accelerator/

6: Vassar College Laboratory technicians and resources as referred to by Professor Magnes

note: sources and citations may change as data is accrued and decided if needed

Models and Experiments:

The generated magnetic field in the railgun will be modeled using the biot-savart law, ampere’s law, and Faraday’s law. Upon creating and modeling the changing magnetic fields as a function of time, loop size and current, the force upon a slug will then be modeled using the Lorentz force law. As a result of these calculations, we can approximate the theoretical velocity at the end of the rail.

We then intend to build a functional  small scale railgun and test fire it. When testing, we will calculate the velocity upon leaving the rails, and the loss in energy of the projectile over its flight relative to the theoretical values calculated using the models from earlier in the project. Upon the calculation of relative efficiency and accuracy of theoretical models, we will compare our data & values to other railguns that have been produced.

Timeline:

April 16th: complete modeling of the magnetic field as a function of time using mathematica.

April 16th-23rd: construct small scale railgun for test fire with Elias Kim

April 20th: Model the force and velocities of the slug using mathematica.

April 21st: provide the theoretical velocity & range of our small scale railgun

April 22nd: post preliminary data on site using either LaTEX or Mathematica

April 27th: compare theoretical values of railgun to experimental values, upon calculation of relative efficiency of the two reactions, compare our model other railguns constructed.

April 30th and May 1st: prepare presentation and submit final blog

Collaborators:

I will be collaborating with Elias Kim in this project. While I am modeling the magnetic field, induction and force in the railgun, Elias will model the circuitry and current in the railgun. We will then collaborate to generate equations of motion, build the small scale gun and calculate its efficiency. We will regularly collaborate and discuss our projects. However as the project progresses, our roles may shift to split the work evenly between the two of us.

Share