
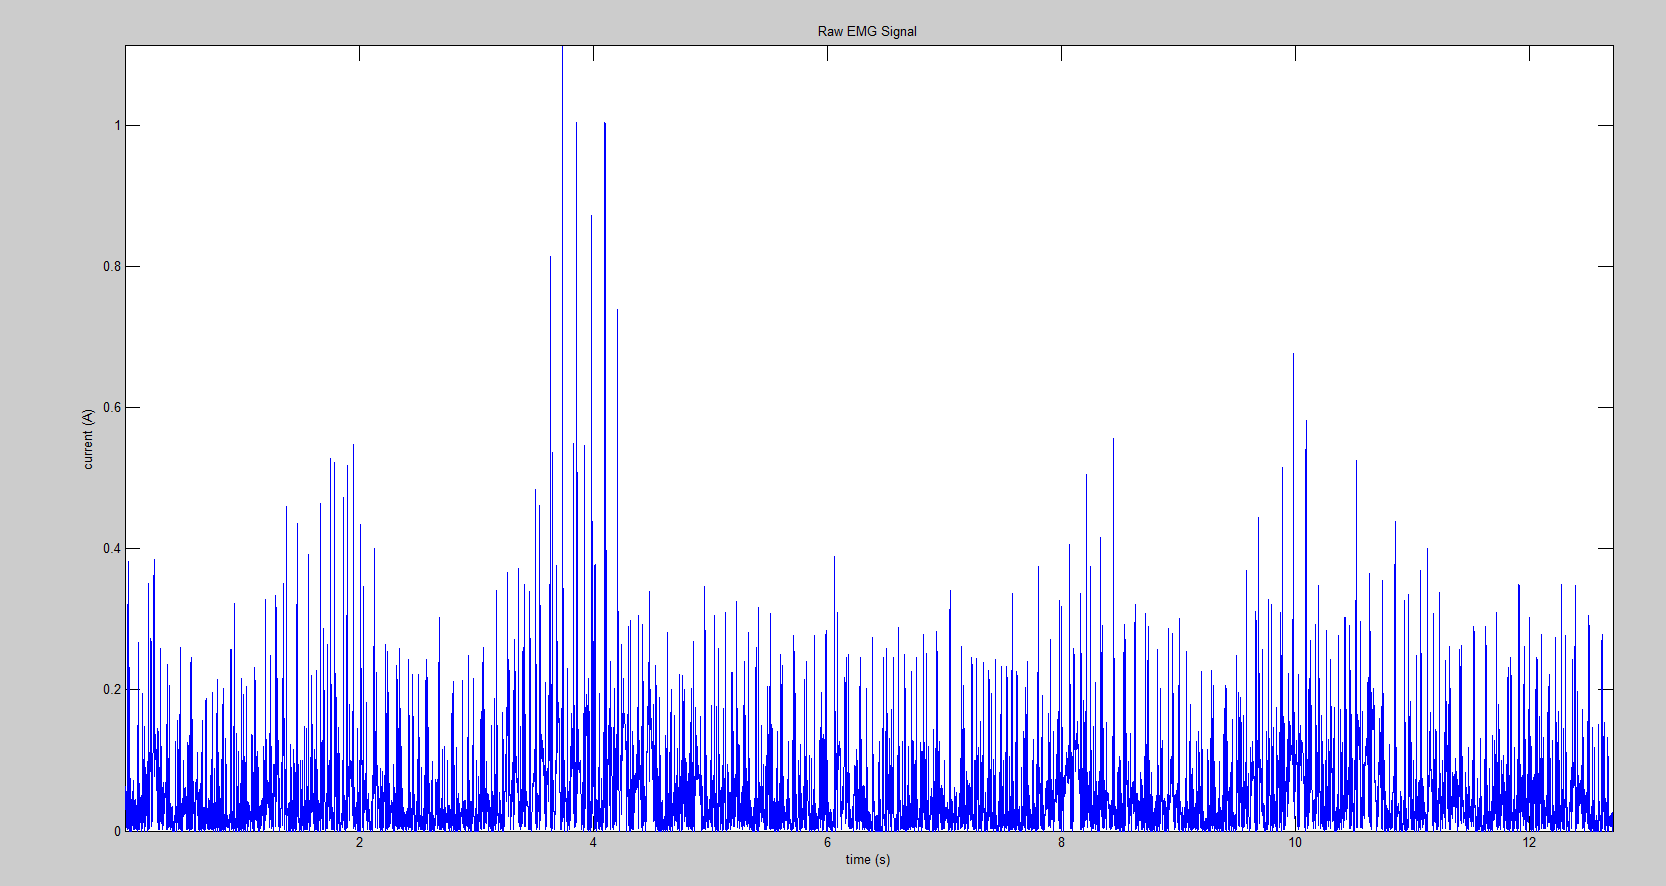
Unfortunately, I was unable to finish hacking the equipment in the laboratory to harvest EMG signals. This is because I do not have access to LabView hardware in my lab yet, and as such am currently unable to read my own surface EMG signals onto a computer. However, the sample signals mentioned previously in the preliminary data proved sufficient to proof this code and derive an understanding of the capabilities of this version of the algorithm. Pictured below is the absolute value of a sample EMG spectra (EMGSample1.mat), which allows a viewer a better understanding of the kinds of trends within the signal easier.
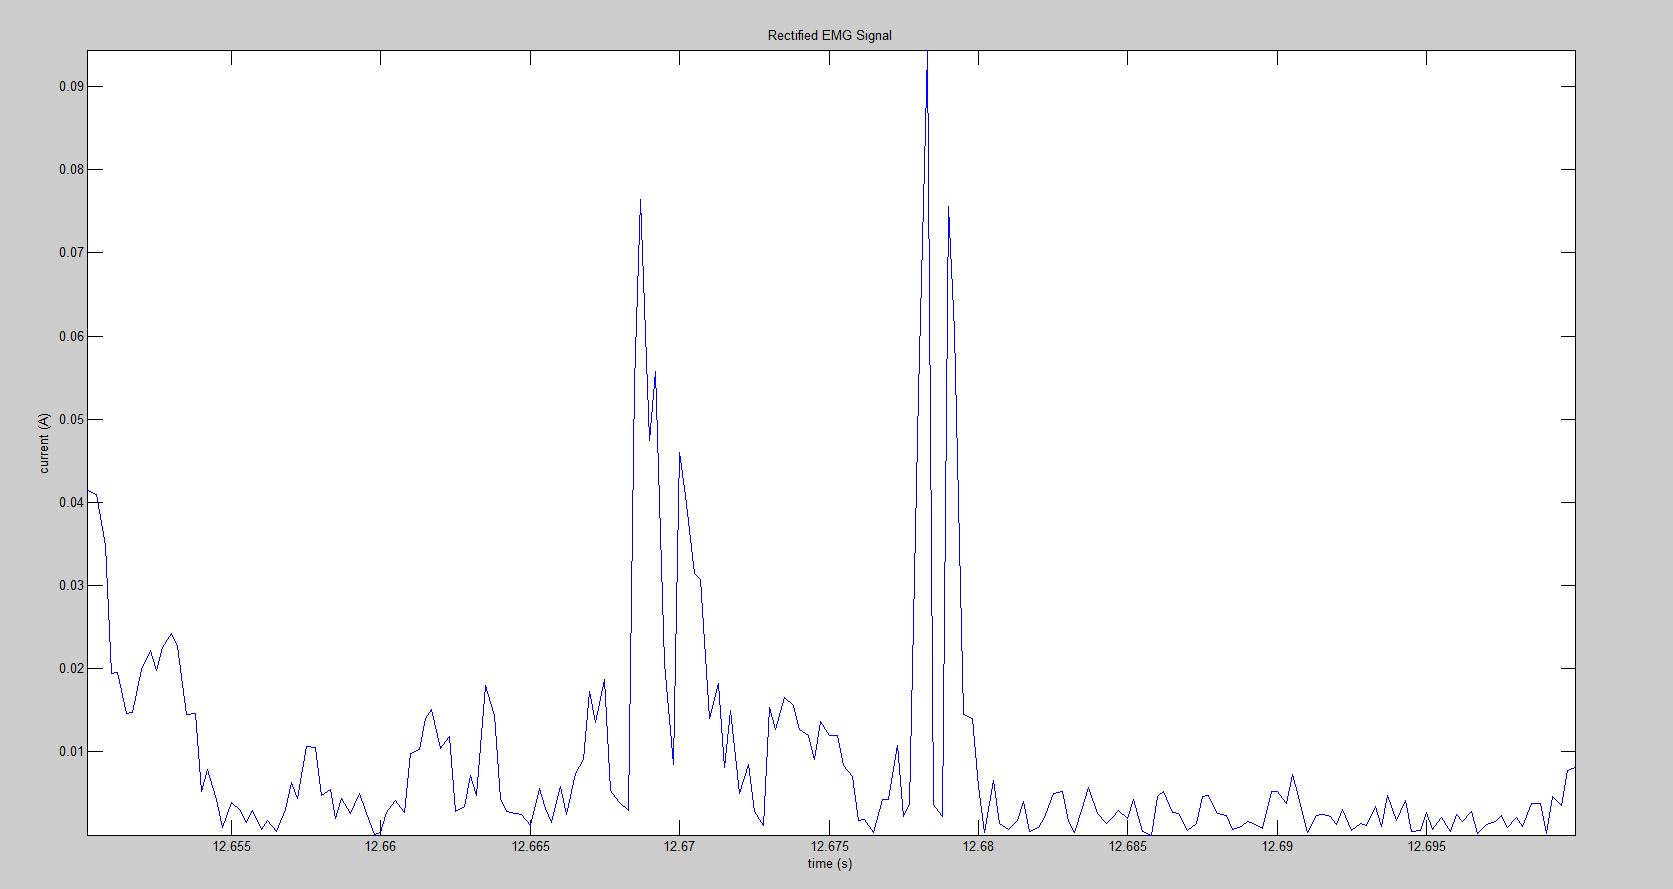
 I was successfully able to create a working code that finds the peak amplitudes above a contraction threshold, and the thousands of separate cycle durations distinguished in order for each of the the three states of action in the robotic arm, contracting, holding at a contraction, or resting/ returning to resting. Like the previous iteration of code, this version implements a FFT (Fast Fourier Transform) noise analysis process to help eliminate the primary sources of noise in the EMG signal, 60 electronic noise and low frequency (<20 Hz) vibrations. Although significant, the effects of this noise cancellation is not sufficient to fully extinguish all experimental noise. For this data, I cannot include any further analysis as I do not know the lab conditions from which this data originated. Pictured below a snippet of the raw EMG spectra is shown above that same data after being passed through a rectification process. Although noise is still an issue in the rectified signal, the rectified data is more workable than its predecessor. However, since a Fourier transform is a frequency analysis tool, I have had to abandon running a truly continuous analysis in favor of chopping the data up into smaller bins of some small time and going through the analysis process for each bin individually as a quasi continuous process.
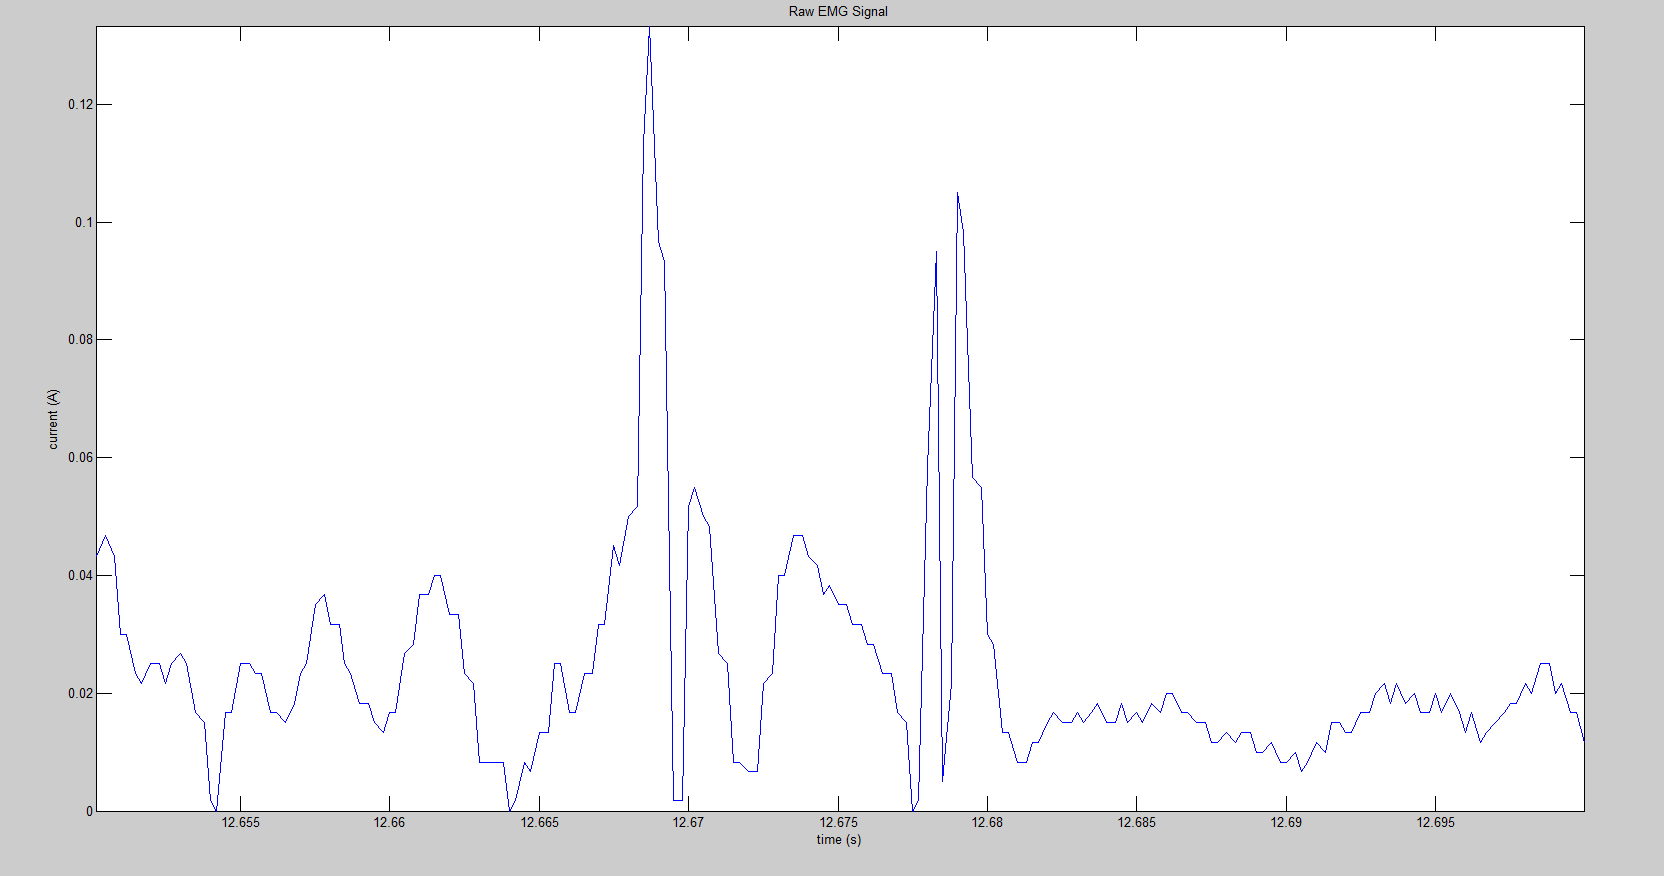
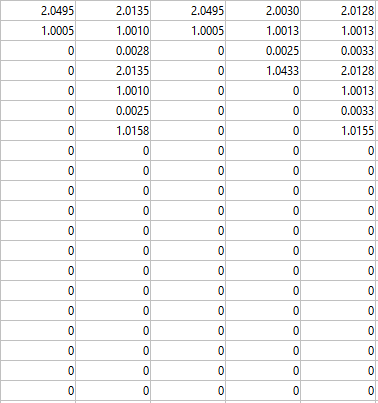
For the purposes of testing the efficacy of the EMG analysis code, the noise threshold, which determined whether the arm would be in the resting state or holding some strained state, was made lower than it ought to be in a practical experiment. Similarly, the threshold that determines when the signal indicates contraction was lowered, such that there would be more opportunities within each signal to evaluate if the code was executing as intended. The data for both peak amplitude and cycle duration is saved in a 20 by j matrix, where j is the number of bins that characterizes the stagnant code in this iteration, or in a later version the number of bins that have been created up to this point. For cycle duration, the data is stored for each bin as a column vector in a matrix, with elapsed time for contraction cycles, rest cycles, and holding cycles stored in order (values 0-1 contraction, 1-2 holding, 2-3 resting). Similarly, the values for peak amplitude during the contraction cycles are stored with the same indices as the contraction duration that they occur during. The peak amplitudes are represented as a proportion of the contraction threshold, which will allow for easier programming of the robotic arm downstream.
The data sets are inordinately large, so I will leave it to the discretion of the reader to use Google drive to access the code and run the results. However, the image below is a screenshot of the results for cycle durations of the first data set (SampleEMG1.mat) between 1.85 and 2 seconds. Although this code serves its purpose, it is not a perfected or completely stable arrangement. Due to the large datasets and indexing method used, changing noise threshold outside of a small range around .1 can or altering the algorithm that controls the analysis can cause the code to crash.
Furthermore, as a byproduct of ensuring a higher degree of stability such that the code is reasonably likely to function properly over a dataseries, the cycles are trimmed slightly and lose resolution in each bin. To compensate for this, any excess time in each bin that has not been accounted for is said to be a hold state at the end of the bin. Though this may seem inefficient, This extra time at the end of each bin will allow the physical system and computational analysis to stay at pace with one another, as the extra hold time can be reduced while the physical system tries to continue a motion. Further work on this code will include making it more robust and resilient, as well as finishing on getting my own EMG signals to analyze. Outside of the context of this class, I plan on integrating the analysis code with the code to control the robotic arm, as well as increasing the sophistication of my model such that the outputs and conclusions better correlate with physical action in a biological agent.
Relevant Files can be found through the link below with headers:
1: EMG_Data_Analysis_422.m
2: SampleEMG1.mat
3: SampleEMG2.mat
4: SampleEMG3.mat
https://drive.google.com/drive/#folders/0B0K4JjJfDy1ffkR4eEZaMzlxb0xvTjRjWDBIUm9iVzZuRmVyeG1aM0RhWHMxcVB6RXZDUFk
References:
1: De Luca, C. Gilmore, D. Kuznetsov, M. Roy, S. Filtering the surface EMG signal: Movement artifact and Baseline noise contamination. Journal of Biomechanics (January 5, 2010) 1573-1579
2: Richards, C. Biewener, A. Modulation of in vivo power output during swimming in the African clawed frog. Journal of Experimental Biology 210 (2007) 3147-3159
3: Lichtwark, G. Wilson, A. A modified Hill muscle model that predicts muscle power output and efficiency during sinusoidal length changes. Journal of Experimental Biology 208 (2005) 2831-2843
4: Computational Physics by Nicholas J. Giordano and Hisao Nakanishi

It is interesting that cutting out some of the noise changes some of the relative heights of the large peaks. Are the relative heights important? It would be nice to have the pre and post FFT clean up on the same graph.