For our project we attempted to compare three smart technologies, a smartphone, a tablet, and a macbook based on four criteria: battery life, issues with overheating, cost, and energy consumption. All criteria were tested in two ways, while the devices were using Netflix, and while they were on but not running any other processing devices. The results of each test are as follows:
Battery Life:
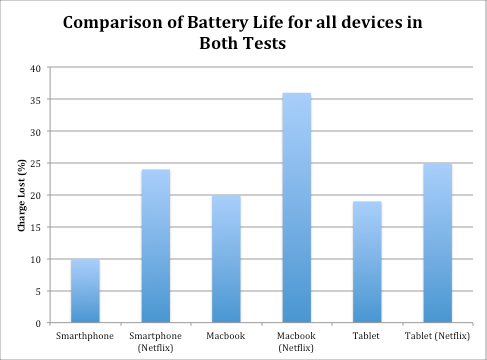
Here we have a graph comparing how much charge each device lost over an hour. In the control test the Macbook lost the most charge, and the smartphone lost the least. In the Netflix test group the Macbook lost the most charge and the smartphone lost the least. It is interesting to note the difference in the control and Netflix test for all the devices, the graph shows a huge increase in loss of charge for all devices while watching Netflix when compared to the control group.
Issues with overheating:
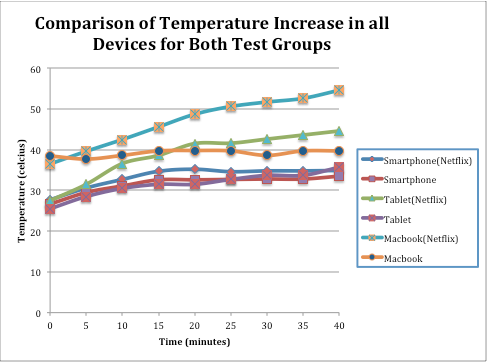
Here, we have a graph that tracks the increase in temperature over a period of 40 minutes, data was taken every five minutes. This graph illustrates how each device increased in temperature over time to some degree. It is interesting to see how, while watching Netflix all the devices’ temperatures increased more rapidly than while in the control test groups.
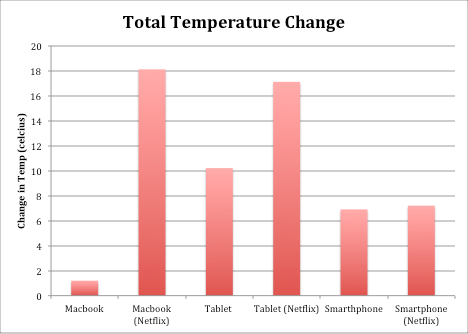
This graph is a comparison of the overall change in temperature for all of the devices. In the control group the Macbook’s temperature increased the least, and the tablet’s temperature increased the most. In the Netflix test the MacBooks’ temperature increased the most, and the smartphone’s temperature increased the least. Also, the tablet has the least amount of change between its temperature increase in the control and Netflix tests, and the macbook has the most amount of change between the two tests.
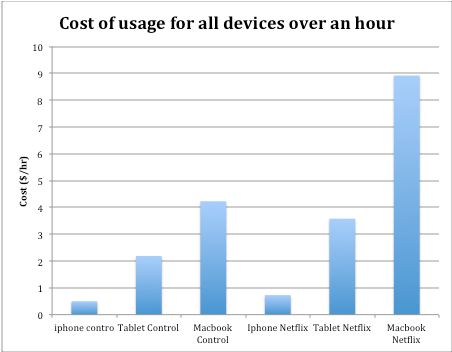
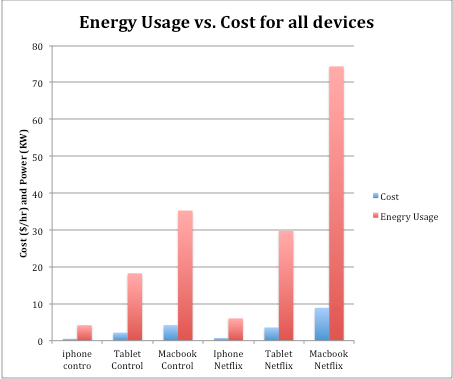
Cost:
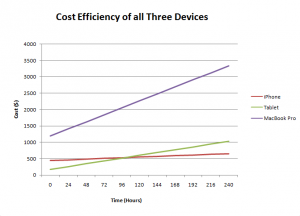
This graph compares the amount of money it takes to run each device over an hour. For both tests the macbook costs the most to run, and the smartphone costs the least to run. More interestingly there is a huge increase in cost between the control and the Netflix groups. For all devices the cost of running while using Netflix for an hour was on average $2.103 dollars higher than the control group.
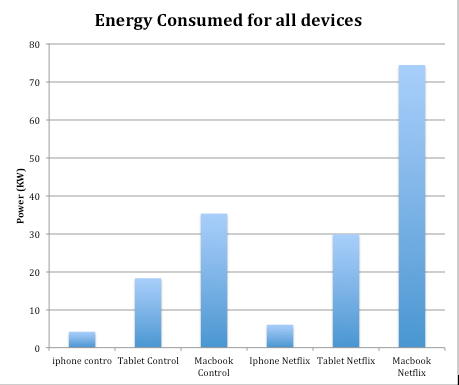
Energy Consumption:
This graph compares how much power each device used over an hour in Kilowatts. In both tests the iPhone used the least amount of energy, and the macbook used the most. There is an interesting increase in energy consumption for the devices while they use Netflix when compared to the control tests.
In order to understand what or results meant, we compared varying test groups to see if there
were any correlations that could me made between them.
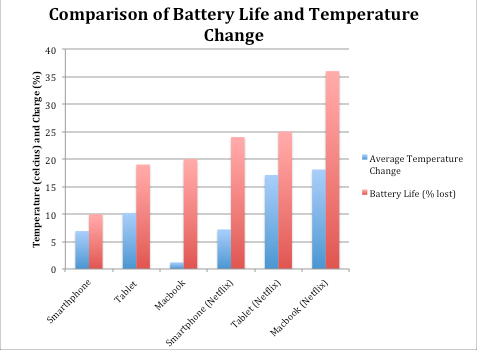
Comparison of battery life and the change of temperature:
The above graph is a comparison of the change in temperature and the loss of charge over an hour. When comparing the data (especially the smartphone and tablet) we saw that though there was a significant difference between how much each device increased in temperature, there was not a corresponding significant increase in loss of charge. This meant that there was not a correlation between the loss of charge and the increase temperature.
Comparison of the loss of charge and the energy consumed over an hour:
The above graph is a comparison of the charge lost and the energy consumed over an hour for all devices. We noticed that since the energy consumed increased significantly when comparing all the devices, and the loss of charge did not increase significantly between all devices there is no correlation between the two.
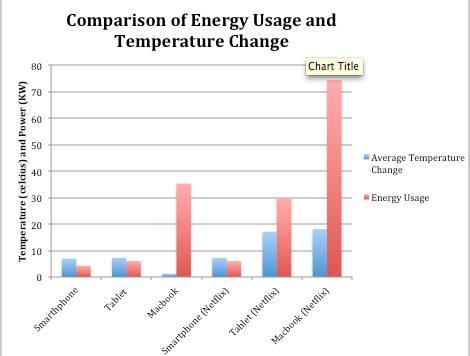
Comparison of energy consumed and the change in temperature for all devices:
The above graph is a comparison between the energy consumed and the change in temperature change. There is a noticeable correlation between the amount of energy consumed, and the increase in temperature. However, there is an outlier to this correlation – the macbook in the control group did not increase with energy consumption. This can be explained because, when running dormant, a macbook has temperature control software that prevents overheating.
Comparison of the energy consumed and the cost of the devices:
The above graph shows that there is a correlation between the energy consumed and the cost of the device. As the energy consumed increases per device the cost of the device also increased.
We also decided to analyze the cost of the device, when taking into account the down payment/data plan for each device. The most cost efficient device was calculated to be: iPhone
Were your results as expected?
We predicted that the MacBook Pro would use the most energy, followed by the tablet, followed by the smart phone. This prediction was accurate, in both the control tests and Netflix tests. This is due to the positive correlation between the size of the device/number of processes and energy consumption.
We expected the laptop to have the best battery life, followed by the tablet, then the phone. However, it turns out the smartphone lost the least amount of charge over an hour, followed by the tablet, followed by the laptop. Battery life is effected significantly by rate of energy consumption as well, and because the MacBook Pro consumes a very large amount of energy, it’s battery life is the worst of the devices tested. The iPhone, because it consumes very little energy, has the best battery life.
We expected the phone’s temperature to increase the most when using Netflix, followed by the tablet, then the laptop. However, the MacBook Pro’s temperature increased the most during the Netflix test, followed by the tablet, and then the smartphone. It is more resource intensive for a laptop to watch Netflix than a tablet or a phone, so it is understandable why the laptop would have the largest increase in temperature for the Netflix test.
We predicted that the tablet would be the most cost effective of these devices because the down cost of a MacBook Pro is quite high, and the cost of a phone plan is high as well. However, it turned out that the tablet uses so much more energy than the smart phone, that over time it becomes less cost efficient. These costs were obtained using the cost per hour of each device obtained from the Netflix test.
What science did you learn?
We learned how take measurements using an infrared temperature probe, and a Watts up Pro? How to take raw data and convert raw data and convert it into graphical form. Lastly, we learned
how to calculate the cost of a device using KWH (1 hour is equal to 12 cents).
What would you do differently if you had to do this project again?
Instead of using Netflix as a test, we would use a more resource intensive task that would provide more accurate data with regards to battery life and issues with overheating. We would also use devices from the same provider, (i.e. all windows product, all mac products, or all android products) this would provide for a more controlled experiment.
What would you do next if you had to continue this project for another 6 weeks?
We would continue our tests in the same manner as before, and compare the sound quality on each device, the screen clarity,the ability to connect to wifi, and the amount of radiation that each device produces.


I never knew how energy consuming streaming videos are! I would like to see more non-Apple products.