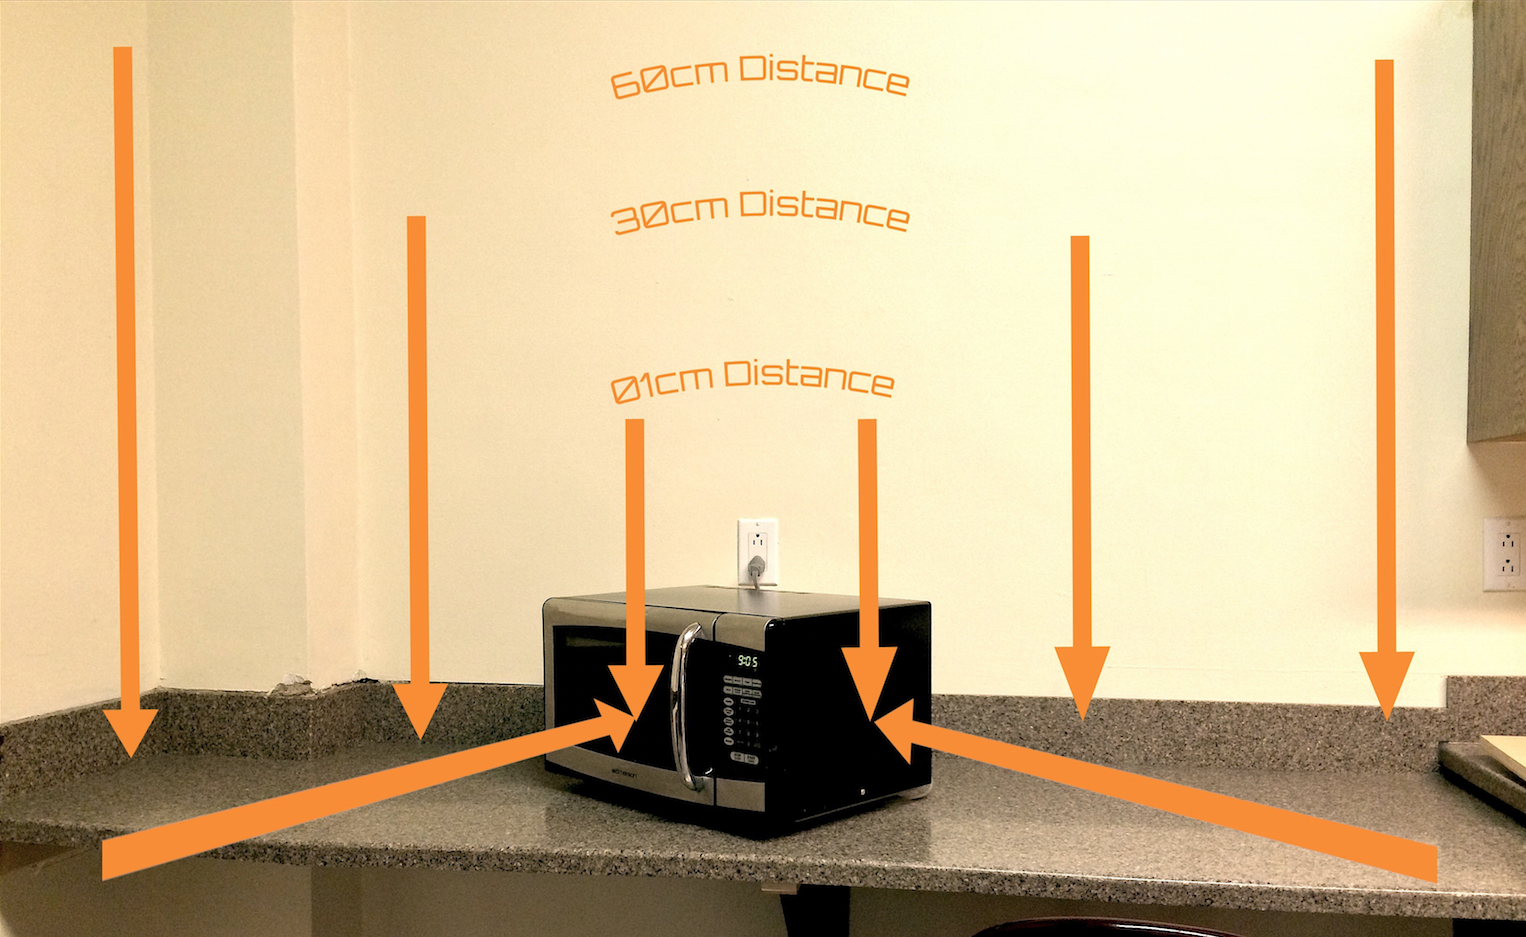
EXPERIMENT SET-UP:
Readings were taken at three distances (1 cm, 30 cm, and 60 cm) from the microwave oven door as well as from the right side (magnetron) of the oven.
TECHNOLOGY USED:
Our data was collected with entirely with an RF Meter: with it, we tested the EM field strength around different microwaves at various locations around campus. The only other technology used in this experiment were the microwaves tested, which were all of varying models and ages.
DATA COLLECTION OVERVIEW:
We collected our measurable data as a team, with all three people assessing the qualitative variables before beginning measurements, and then one person recording data, and two using the RF meter in conjunction with the microwave to collect data. We allowed the microwave for ~30 seconds before starting to collect data to make for a more consistent readings from each distance. We first observed the average value at each distance. This required us to be subjective–since the average value switched as the RF meter collected data, every second or so, two people observed the average values for about 10 seconds before deciding an approximation where most of the values fell. We then switched to measuring the maximum average, a value that stood constant on the RF meter. We repeated this process at each distance from the microwave. We of course switched roles periodically in order to give each member of the group a better understanding of the overall process!
We got to this streamlined process through trial and error, and toggling with the RF meter, whose manual is not extremely comprehensive. We had to test measuring from different axes and also realized that we needed to measure the radiation in the general vicinity of the microwave before we measured for microwave radiation, so that we had an idea of the baseline of EM fields in the area. We also had to toggle with measuring values on different settings. While we began measuring only maximum average, we realized this did not give a sufficient idea of the radiation emitted on average. Furthermore, if the RF meter caught a signal from something like a cell phone receiving a text, that outlying measurement would appear on the meter rather than the measurement from the microwave. We decided to use both average and maximum average measurements to get an idea of how much radiation was generally emitted, as well as how much could potentially be emitted.
We also collected data by researching the safety standards of microwaves. This data will help us understand what our values mean during analysis/conclusions. We found that the International Electrotechnical Commission has set a standard of emission limit of 50 Watts per square meter at any point more than five centimeters from the oven surface. The United States Federal Food and Drug Administration has set stricter standards of 5 milliWatts per square centimeter at any point more than two inches from the surface. Most consumer microwaves report to meet these standards easily. Further, the dropoff in microwave radiation is significant with the FDA reporting “a measurement made 20 inches from an oven would be approximately one one-hundredth of the value measured at 2 inches.”
DATA COLLECTING CONDITIONS:
The conditions under which our data was collected were simply the conditions of the microwaves habitats: some were found in secluded kitchens without much EM feedback from its surroundings (before testing each microwave we made a note of the general, ground-level EM reading in the vicinity so we could adjust and compare microwaves after taking that initial radiation into account), and others were found in areas where wi-fi signals and cell phone usage really bumped up the ground-level readings, and requiring us to adjust how we understood the data accordingly,
UNITS:
- Distance from the microwave (cm.)
- Power of Microwave, found on microwave label (Watts)
- Radiation (µW/m^2)
DATA TABLES:
1) Preliminary Observations
|
Sample # |
Location |
Brand |
Wear and Tear, Year? |
Radiation Off |
|
M1 |
Strong Kitchen |
GE MSES1139BC03 |
June 2011 No major wear and tear |
AVG: 0.00 MAX AVG: 0.00 |
|
M2 |
Retreat |
LG Orbit LRM1230W |
December 2004 In good shape |
AVG: 0.00 MAX AVG: 0.00 *but when measuring not on avg., values did appear |
|
M3 |
Noyes Dorm Room |
Microfridge with Safe Plug N060203077 |
February 2006 Squeaky noises |
AVG: 0.00 MAX AVG: 0.00 |
|
M4 |
UpC |
Amana Commercial Microwave RFS11MP2 |
February 1999 |
AVG: 17.7 µW/m^2 MAX AVG: 18.4 µW/m^2 |
|
M5 |
South Commons Senior Housing |
Emerson MW8999SB |
March 2013 New condition |
AVG: 0.00 MAX AVG: 0.00 |
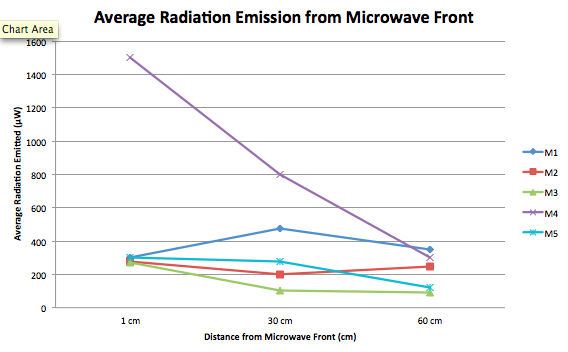
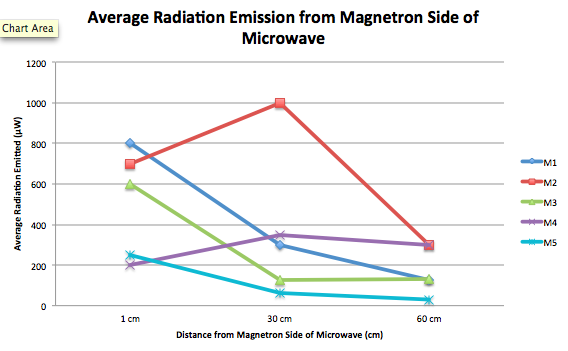
2) Average EM Radiation Values
|
Sample # |
Power (Watts) |
EM Radiation from Front (1 cm) |
EM Radiation from Front (30 cm) |
EM Radiation from Front (60 cm) |
EM Radiation from Magnetron (1 cm) |
EM Radiation from Magnetron (30 cm) |
EM Radiation from Magnetron (60 cm) |
|
M1 |
1,600 W |
300 µW/m^2 |
475 µW/m^2 |
350 µW/m^2 |
800 µW/m^2 |
300 µW/m^2 |
125 µW/m^2 |
|
M2 |
1,200 W |
275 µW/m^2 |
200 µW/m^2 |
250 µW/m^2 |
700 µW/m^2 |
1.00 mW/m^2 |
300 µW/m^2 |
|
M3 |
700 W |
270 µW/m^2 |
100 µW/m^2 |
90 µW/m^2 |
600 µW/m^2 |
125 µW/m^2 |
130 µW/m^2 |
|
M4 |
1,250 W |
1.5 mW/m^2 |
800 µW/m^2 |
300 µW/m^2 |
200 µW/m^2 |
350 µW/m^2 |
300 µW/m^2 |
|
M5 |
900 W |
300 µW/m^2 |
275 µW/m^2 |
120 µW/m^2 |
250 µW/m^2 |
80 µW/m^2 |
30 µW/m^2 |
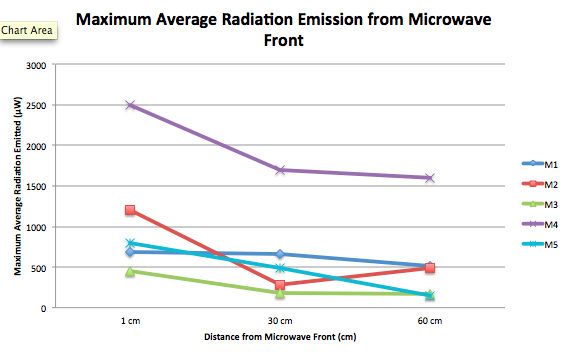
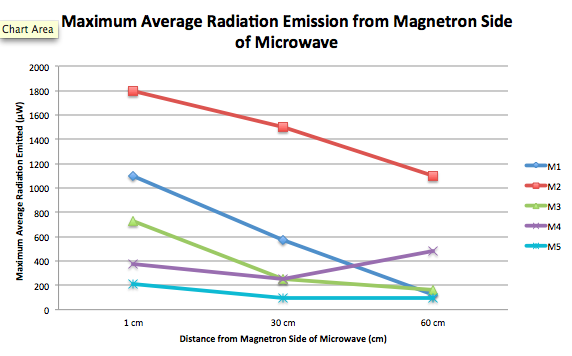
3) Maximum Average EM Radiation
|
Sample # |
Power (Watts) |
EM Radiation from Front (1 cm) |
EM Radiation from Front (30 cm) |
EM Radiation from Front (60 cm) |
EM Radiation from Magnetron (1 cm) |
EM Radiation from Magnetron (30 cm) |
EM Radiation from Magnetron (60 cm) |
|
M1 |
1,600 W |
628.3 µW/m^2 |
662.5 µW/m^2 |
508.8 µW/m^2 |
1.1 mW/m^2 |
571.3 µW/m^2 |
123.4 µW/m^2 |
|
M2 |
1,200 W |
1.2 mW/m^2 |
282.9 µW/m^2 |
482.9 µW/m^2 |
1.8 mW/m^2 |
1.5 mW/m^2 |
1.1 mW/m^2 |
|
M3 |
700 W |
457.7 µW/m^2 |
182.2 µW/m^2 |
169.1 µW/m^2 |
726.3 µW/m^2 |
252.2 µW/m^2 |
162.4 µW/m^2 |
|
M4 |
1,250 W |
2.5 mW/m^2 |
1.7 mW/m^2 |
1.6 mW/m^2 |
372.0 µW/m^2 |
250.0 µW/m^2 |
477.9 µW/m^2 |
|
M5 |
900 W |
798.2 µW/m^2 |
488.8 µW/m^2 |
149.6 µW/m^2 |
209.4 µW/m^2 |
92.3 µW/m^2 |
97.9 µW/m^2 |
DATA GRAPHS
1) Average Radiation from Front
2) Average Radiation from Magnetron
3) Maximum Average Radiation from Front
4) Maximum Average Radiation from Magnetron
Emma Foley; Hunter Furnish; Hannah Tobias
I can’t wait to see your assessment of the microwaves. What are the effects of exceeding FDA levels?