What were your results?
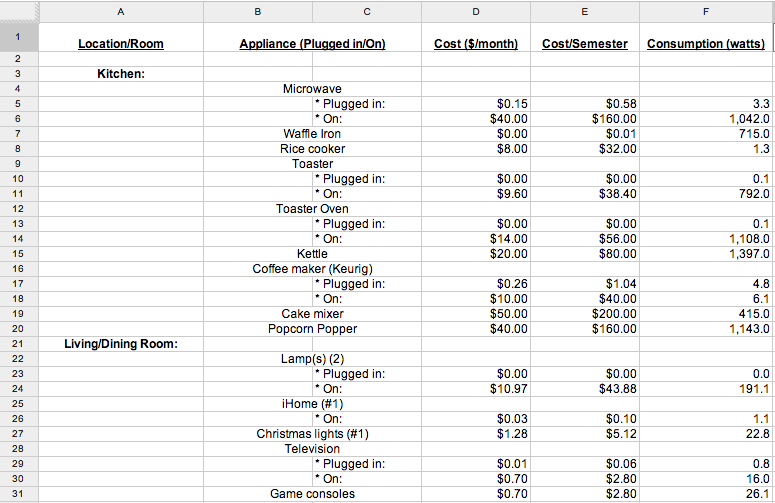
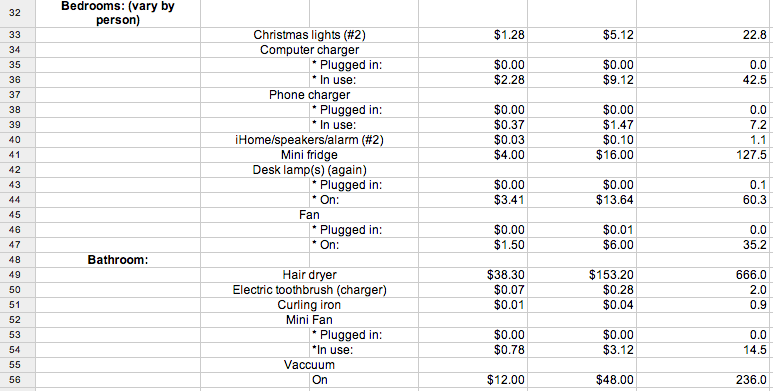
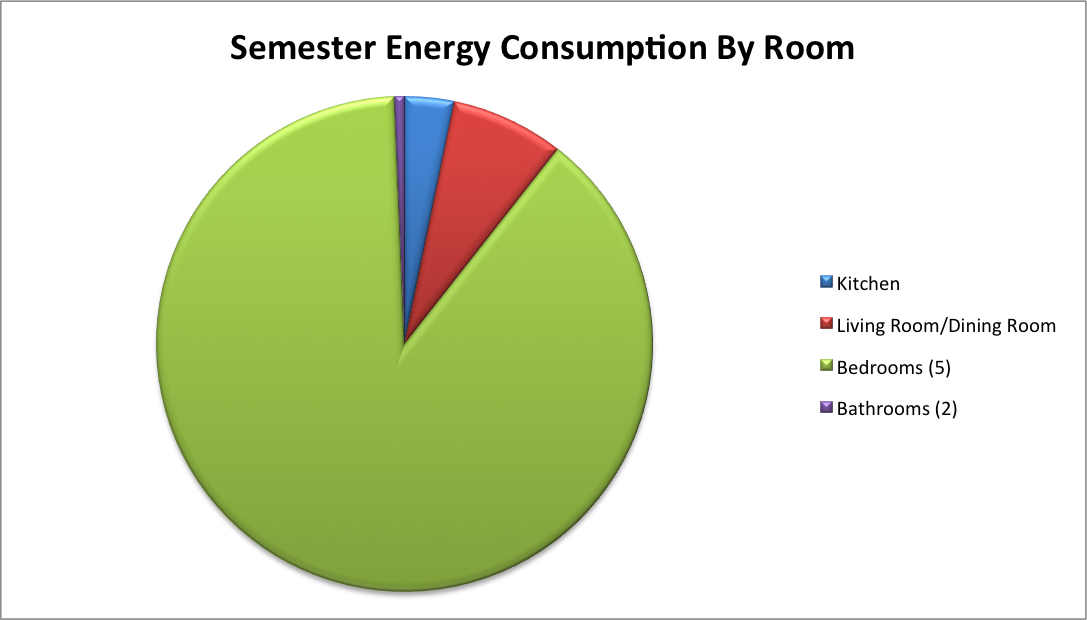
After conducting the appropriate calculations to take into account how often each of these appliances is actually on/in use versus simply plugged in (for a typical TH), we found that the total cost of powering all of these personal appliances based on typical usage in a semester would be $69.95. This is considering that there are 5 bedrooms in the house so we have multiplied the bedroom costs by 5. Below is a graph depicting the energy consumption by rooms, which demonstrates that the majority of the energy consumption comes from the 5 bedrooms.
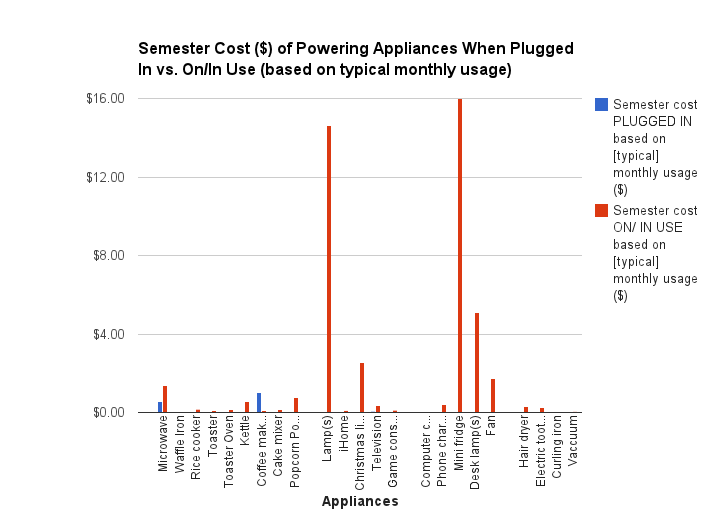
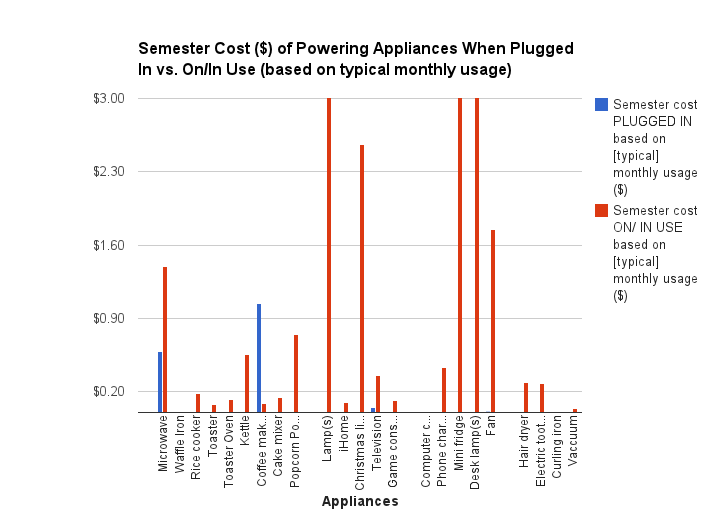
To provide a contrast, the cost of powering all of these appliances if each of them remained in use for the entire semester would be $1,253.83. Clearly this is not a realistic scenario, but the extreme disparity between the numbers helps provide a context to better understand the realities of our calculated energy consumption. The graphs below depict the cost ($) of powering each appliance when plugged in versus in use/on for a semester (4 months) based on a typical monthly usage. The first graph shows the data with a larger scale, and the second shows the data on a smaller scale to reveal the smaller details.
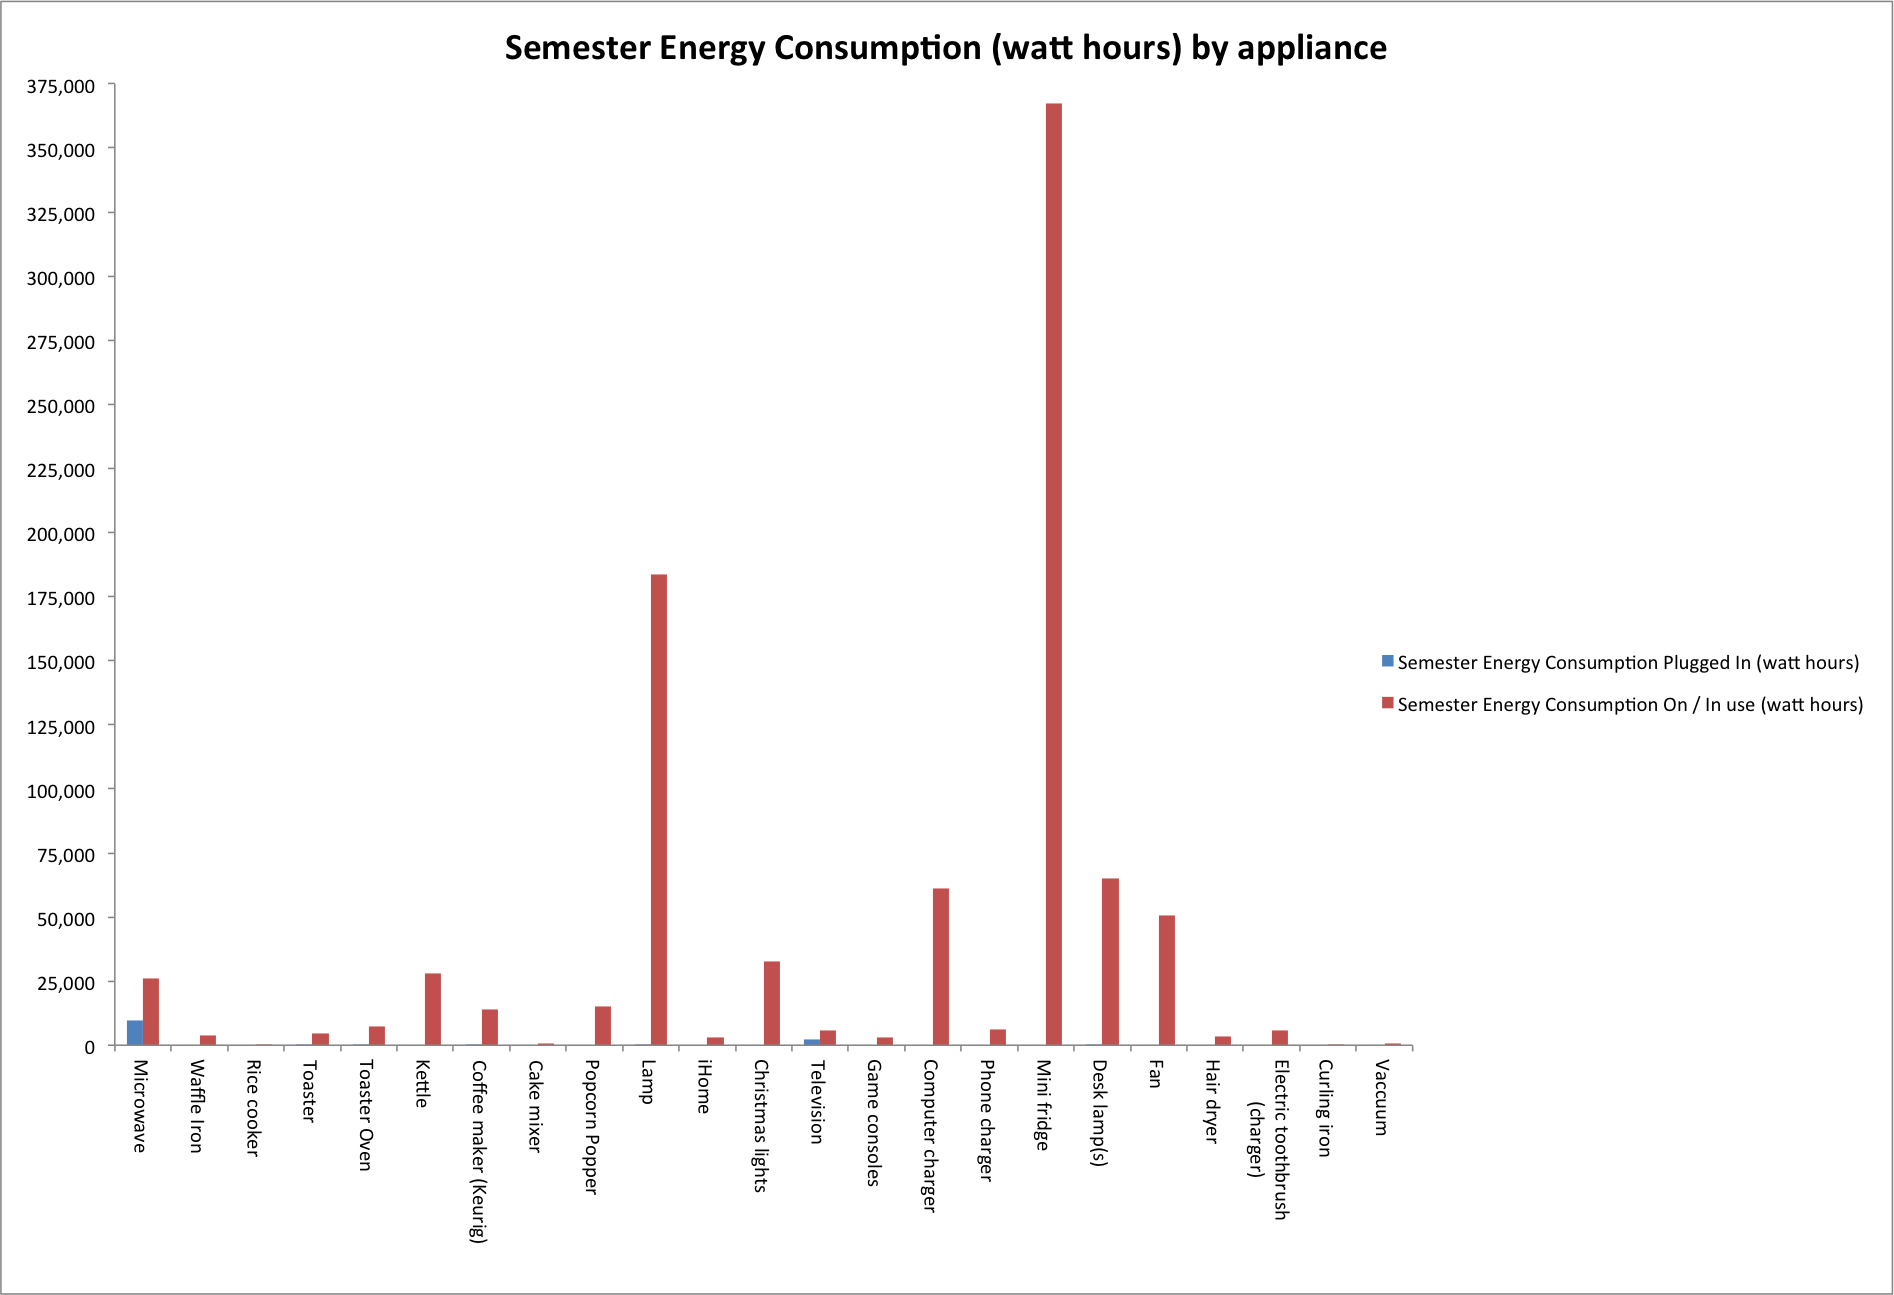
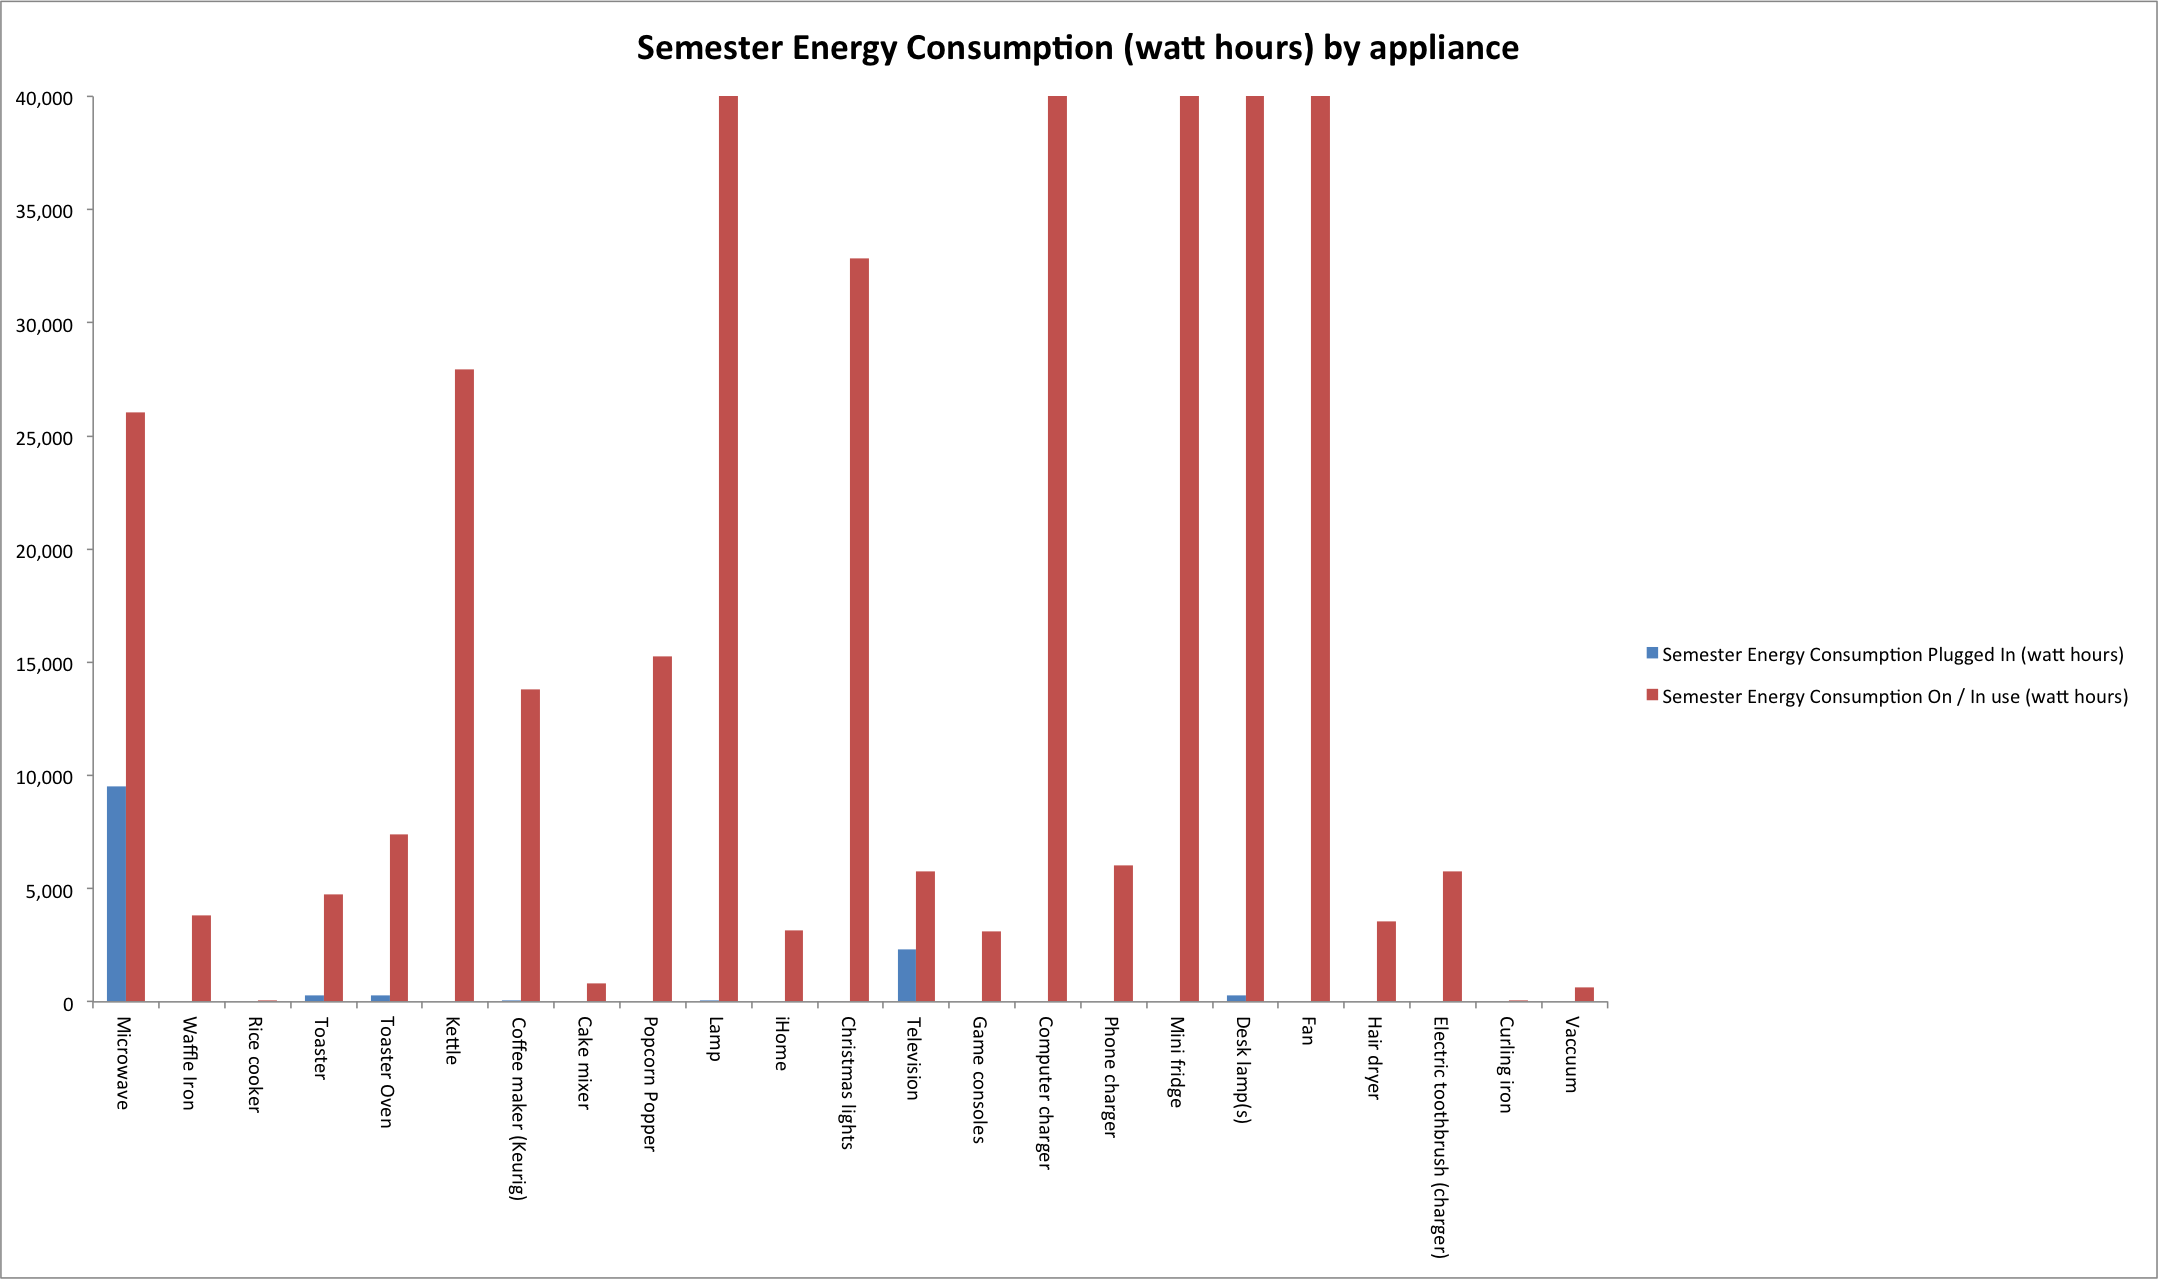
With regards to energy consumption, the total amount of energy (in kilowatt hours) all of these appliances use in a semester—taking into account how often each of them is actually on/in use versus simply plugged in—comes out to about 3,103 kilowatt hours. (This is also considering that there are 5 bedrooms in the house so we have multiplied the bedroom energy consumption by 5.) The graphs below depict the energy consumption (in watt hours) of each appliance when plugged in versus on/in use over a semester (4 months) based on a typical monthly usage.
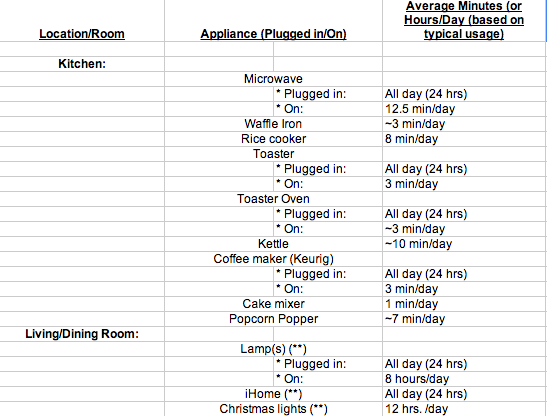
All of these calculations were made based off of what we believed was a typical monthly usage time for each appliance. In the chart below we explain what we believe to be a typical daily usage (minutes or hours) for each for each appliance. (For some appliances that aren’t used every day—such as a vacuum, for example—the typical monthly usage was decided and divided by 30 to find average daily usage.)

Looking at the graphs, it is clear that certain appliances contributed to the majority of the cost and the energy consumption as compared to other appliances. The appliances that consumed the most energy were (from most to least out of all the substantial contributors): the mini fridge, floor lamps, desk lamps, computer charger, fan, Christmas lights, kettle, and microwave. Similarly, the appliances that contributed most to the semester’s cost were (from most to least of the substantial contributors): the mini fridge, floor lamp, and desk lamp. In this case, there is a large difference in cost between the floor lamp and desk lamp, with fairly insignificant values for the appliances after the desk lamp as well.
Knowing that the mini fridge and floor lamps are the main source of energy use and cost can provide students with valuable information when deciding which appliances to have in their households. It is important to keep in mind that the total cost and energy consumption calculated for a typical TH included 5 mini fridges (because each bedroom typically includes a mini fridge), so both of these values would decrease relatively significantly if a house has less than 5 mini fridges. We must also take into account the fact that we didn’t gather data for the stove, heat, overhead lighting, or main refrigerator, which in future housing (not on a college campus) will likely make most of the impact in an electricity bill and with general energy consumption.
What do your results mean?
Although this is only significant with some appliances, leaving them plugged in when not in use really can make a difference. Even though it is not as much as we originally thought, just the fact that leaving certain appliances plugged in (when not in use) does cost some money and use quite a bit of energy reinforces the belief that most things should remain unplugged when not in use.
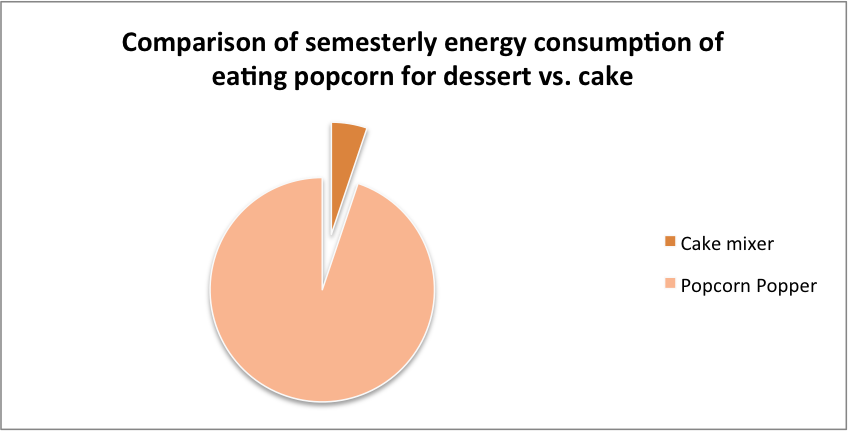
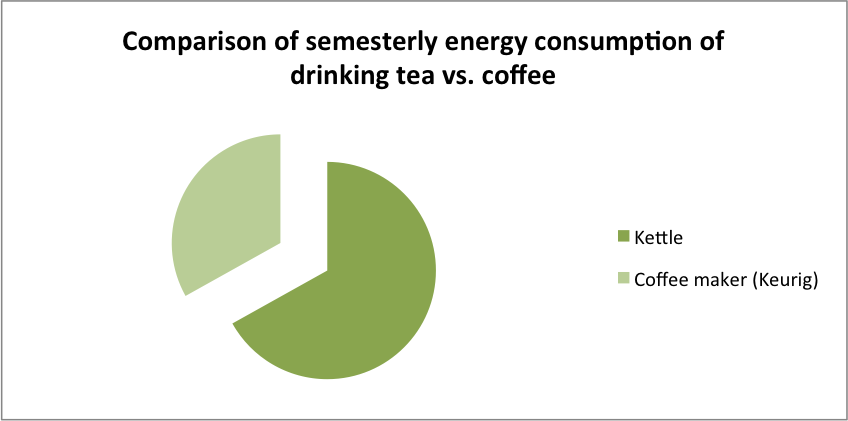
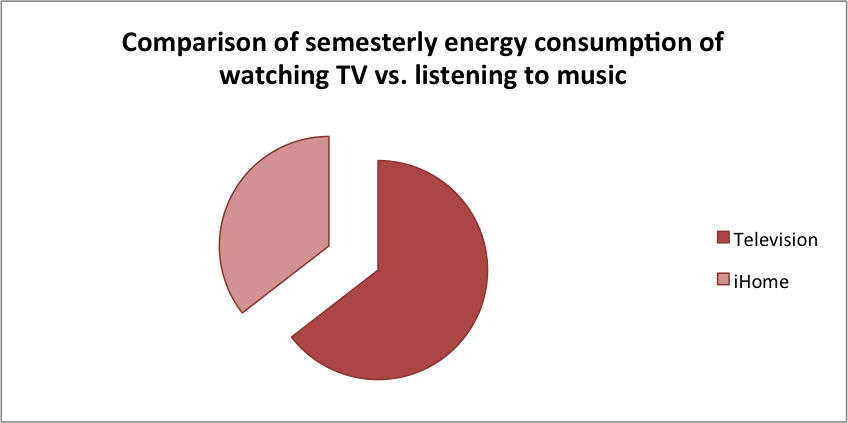
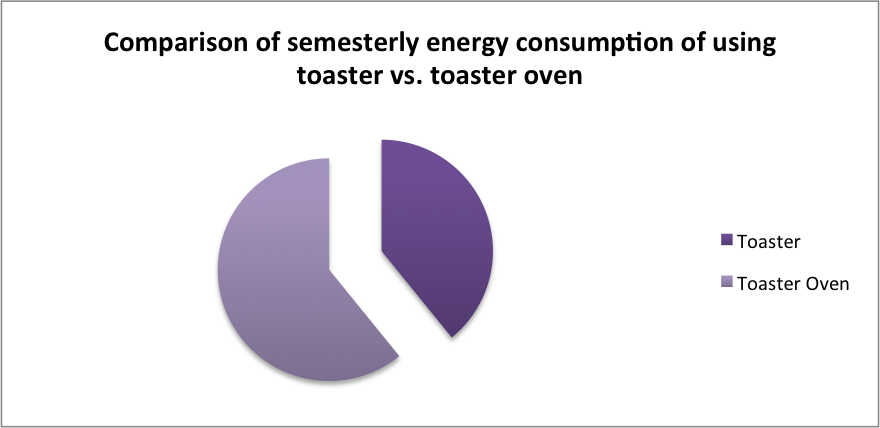
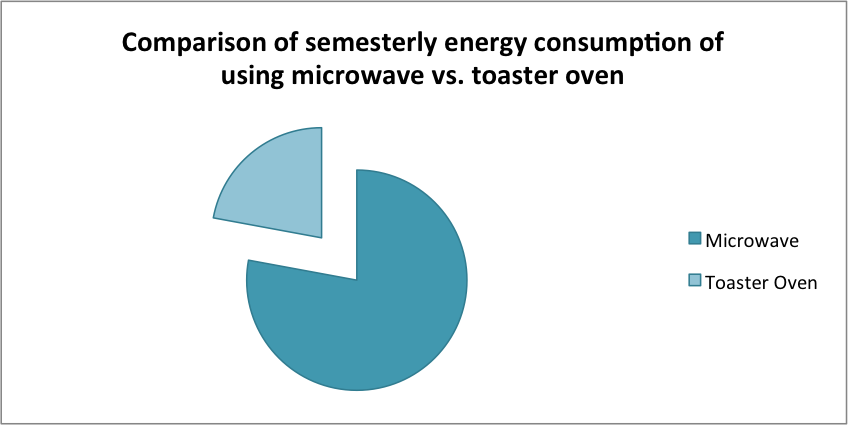
Additionally, our data demonstrates that using alternative methods to making certain foods or doing certain activities could make a difference, however small it may seem. For example, one could make popcorn on the stove to avoid using the microwave or a popcorn popper, or one could use a toaster instead of toaster oven. Cost and energy consumption could also be reduced by cutting down on the number of mini fridges in a house, by unplugging Christmas lights when no one is in the room, and especially by turning off and unplugging floor lamps when they are not being used. Even simply cutting down on the amount of time one uses each appliance per day or per month could make a small but important difference for energy conservation as well as saving money. Below we have included some simple pie charts that depict comparisons between certain appliances that have similar functions and could be used as alternatives.
Without knowing the cost of the main appliances (oven, stove, big refrigerator, etc.) it is hard to make any general statements about the portion of our tuition that goes towards housing because the cost of these personal appliances is relatively insignificant in comparison to the cost of the main appliances. However, it is important to be aware of how all the little costs and power usages add up: soon we (college students) will have to pay full electricity bills ourselves, and energy conservation is a crucial part of taking care of our environment.
Were your results as predicted? Why? or Why not?
In general, our results confirmed our predictions. We expected appliances such as the mini fridge and lighting sources to be the biggest contributors to cost and energy consumption, and this was definitely confirmed. The refrigerator is on constantly and uses a lot of energy to keep it at such high temperatures, and the floor lamps and most lighting sources are on for such a large part of the day that we also expected them to use a lot of energy and contribute a lot of the cost. That being said, a few of the appliances did provide surprising results; we had not expected the Christmas lights, kettle, or the popcorn popper to have values as high as they did, but now that we know more about how these appliances use money and energy, we can adjust and cut down on how often we use them.
What science did you learn during this project?
Despite this being a small project, it was very informative. Not only did it give us some insight into how much energy our appliances use, and the subsequent costs to operate and maintain these appliances, but it taught useful applications of basic science. Because we were measuring energy consumption we have now become adept at using the Watts Up? Pro and can have a better understanding of converting different units of energy such as watts (joules/sec) to watt hours, and joules to watt hours. In addition, we have learnt how these different values of energy consumption relate to the cost of operating an appliance.
What would you do differently if you had to do this project again?
Having now completed the project, we are more aware of some of the sources of error and limitations we faced. If we had to repeat this project we would make a simple graph of watts by time for each appliance. A problem we occurred when doing this project was that some appliance, particularly those whose function was to produce heat (kettle, toaster etc.), varied in energy consumption. This was probably due to the fact that it was using more or less energy dependent on how much heat it still needed to produce. If we had graphed watts by time we could have used this to calculate the average energy consumption during the usage of the appliance. This I believe was the major confound in doing this experiment.
What would you do next if you had to continue this project for another 6 weeks?
If we had to continue the experiment for another 6 weeks, we would widen our sample size and take averages of the energy consumption of the appliances, as well as the reported usage of these appliances by residents. In addition, to ensure more accurate and realistic data we would have a “sample month”, in which we record carefully the amount of time of usage of each appliance in this month. We were restricted in doing this due to the short span of time to conceptualize and carry out this experiment. However, given more time we could have removed a great deal of conjecture from our project.