Description
“The Water Paradise at Vassar” is a project under the supervision of Kevin Fernandez and Issai Torres. We collected samples of water from water fountains in various populated locations at Vassar College and analyze which water fountains is the most drinkable by comparing ph levels and turbidity (water clarity) measurements.
Predictions
The outcome we expected is that water quality will depend on how recently the building’s water system has been installed or renovated. Therefore, we expect the Bridge of Laboratory Sciences or Davison House to have the highest quality of water because it is the newest and renovated building on Vassar’s campus while older buildings such as Thompson Library or Taylor Hall will have a lower quality.
Technology
This team will use the turbidity and pH meter to collect data. The pH strips are responsible for detecting the potential of hydrogen that is inside of a substance which is important to determine the quality of the water. Finding the correlation between the water pH levels from Vassar’s water fountains and favorable levels (What are favorable levels?) of pH for humans is also important to determining water quality. The second equipment is turbidity sensor which measures water clarity by how much light is dispersed when shown through the water. The use of these two methods of water quality measurement will allow us to gather data to compare water quality across the campus of Vassar.
pH Sensor
pH Sensor Procedure
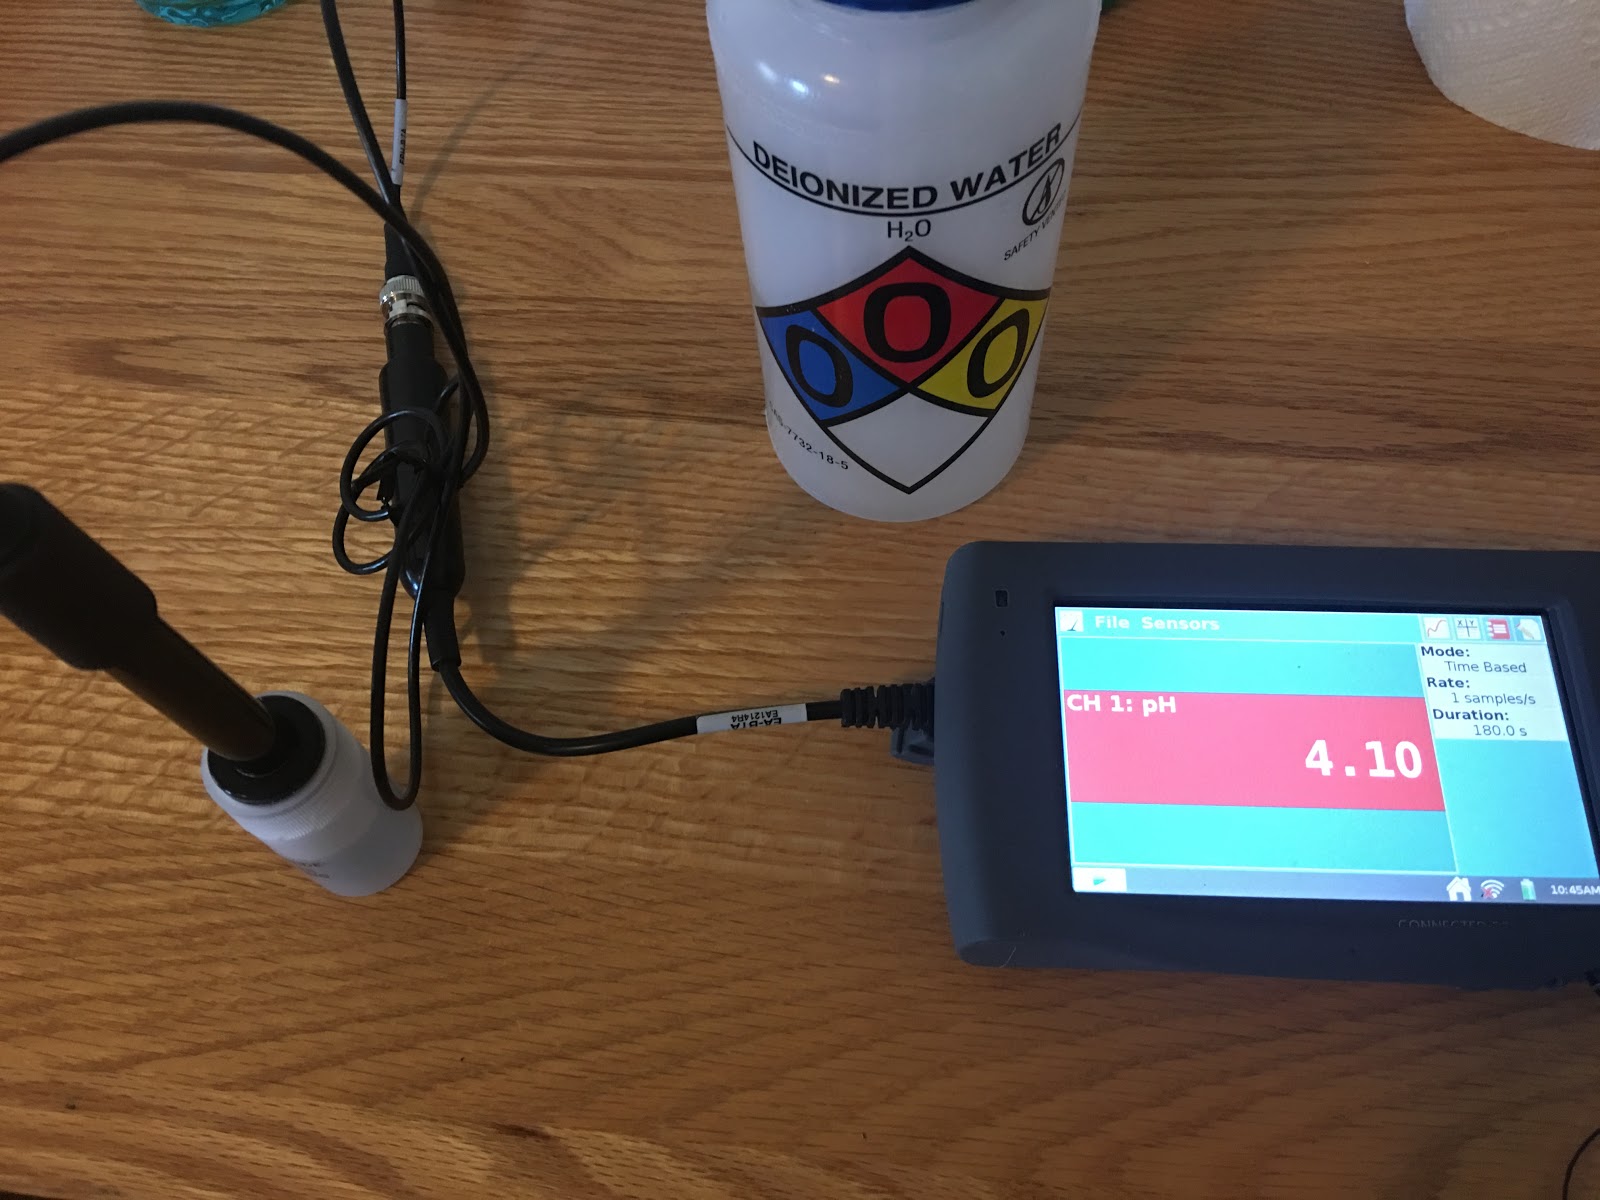
Our procedure to measure the pH levels of the water from the water fountain was by connecting the pH sensor to the LabQuest and recording data. The pH sensor is initially placed in a solution called the buffer where it would not be affected by any outside particles. When the pH sensor was removed from the buffer, it had to be cleansed with deionized water. Then we placed the pH sensor into a vial containing water from the water fountain and we would record the pH measurement that appeared on the LabQuest. Afterwards, we had to once again cleanse the pH sensor with deionized water and place it back into the buffer. We repeated this procedure for every water fountain we recorded data from.
Data of pH
Explanation of pH
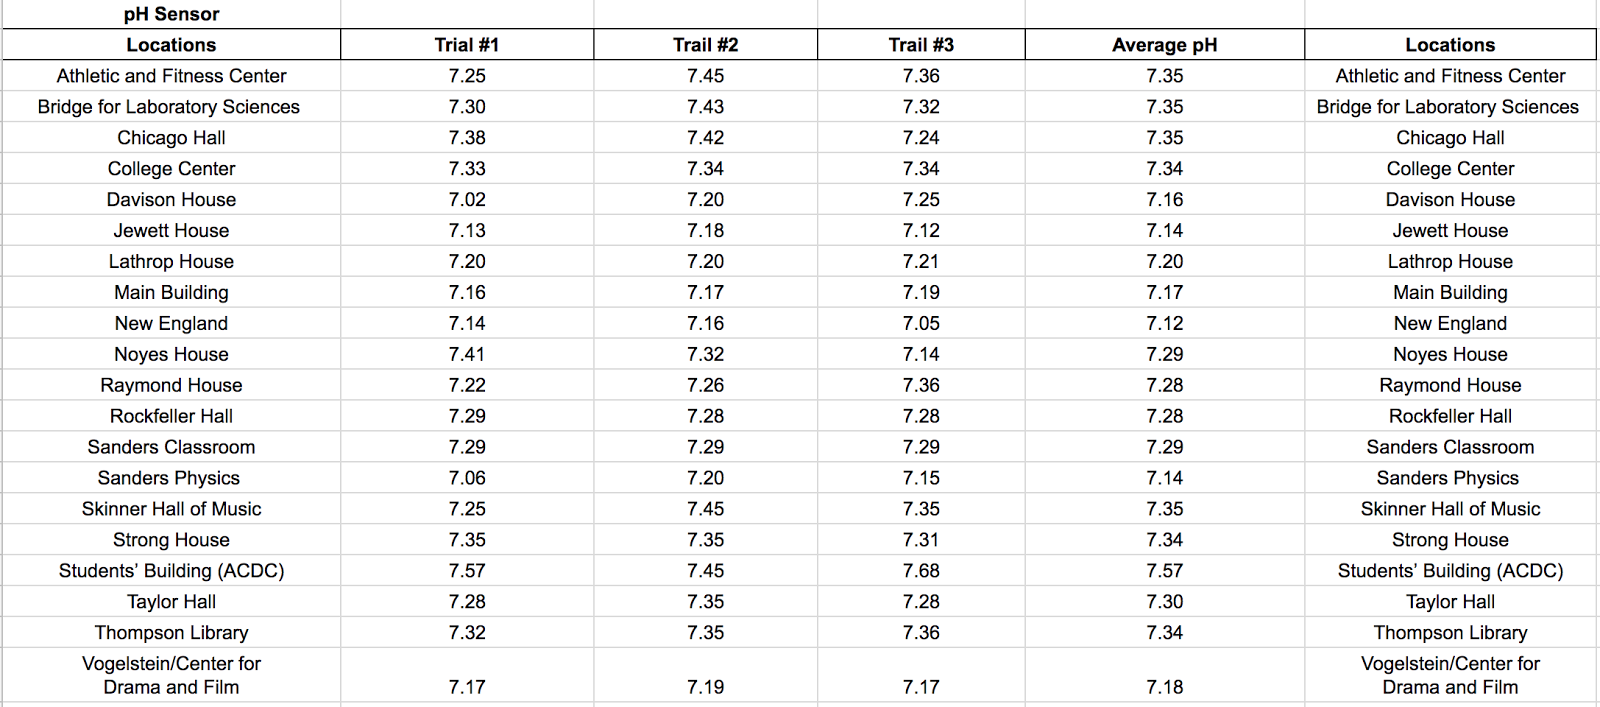
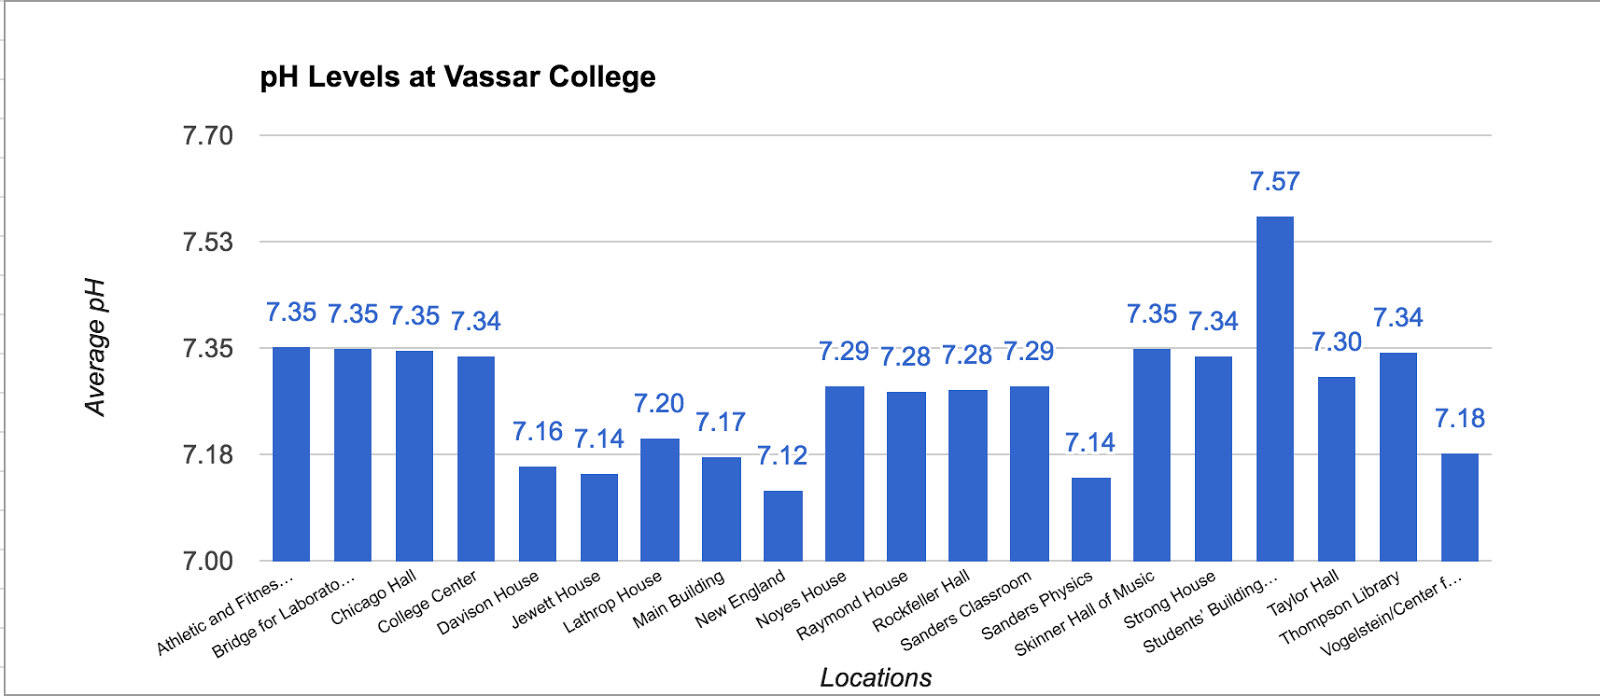
The pH scale ranges from 0 to 14 with 0 being very acidic, 14 being very basic (alkaline), and 7 being neutral. pH itself stands for “power of hydrogen” and is dependent upon the hydrogen ion concentration inside of a substance. The pH scale is logarithmic meaning that a pH level of 5 is 10 times more acidic than a pH level of 6. Pure water has a pH level of 7 and water systems range from pH levels of 6.5 to 8.5. Our data shows that Vassar campus contains good pH levels of water campus wide with the lowest pH level being 7.12 in the New England building and the highest pH level being 7.57 in the ACDC. Our original hypothesis was that Thompson Library or Taylor Hall would have the highest pH level because it is the oldest building on campus and that the Bridge for Laboratory Sciences or Davison House would have the lowest pH levels as it is the most recent building but we weren’t completely right. In conclusion, Vassar College has great levels of pH coming from the water fountains.
Turbidity Sensor
Turbidity Sensor Procedure
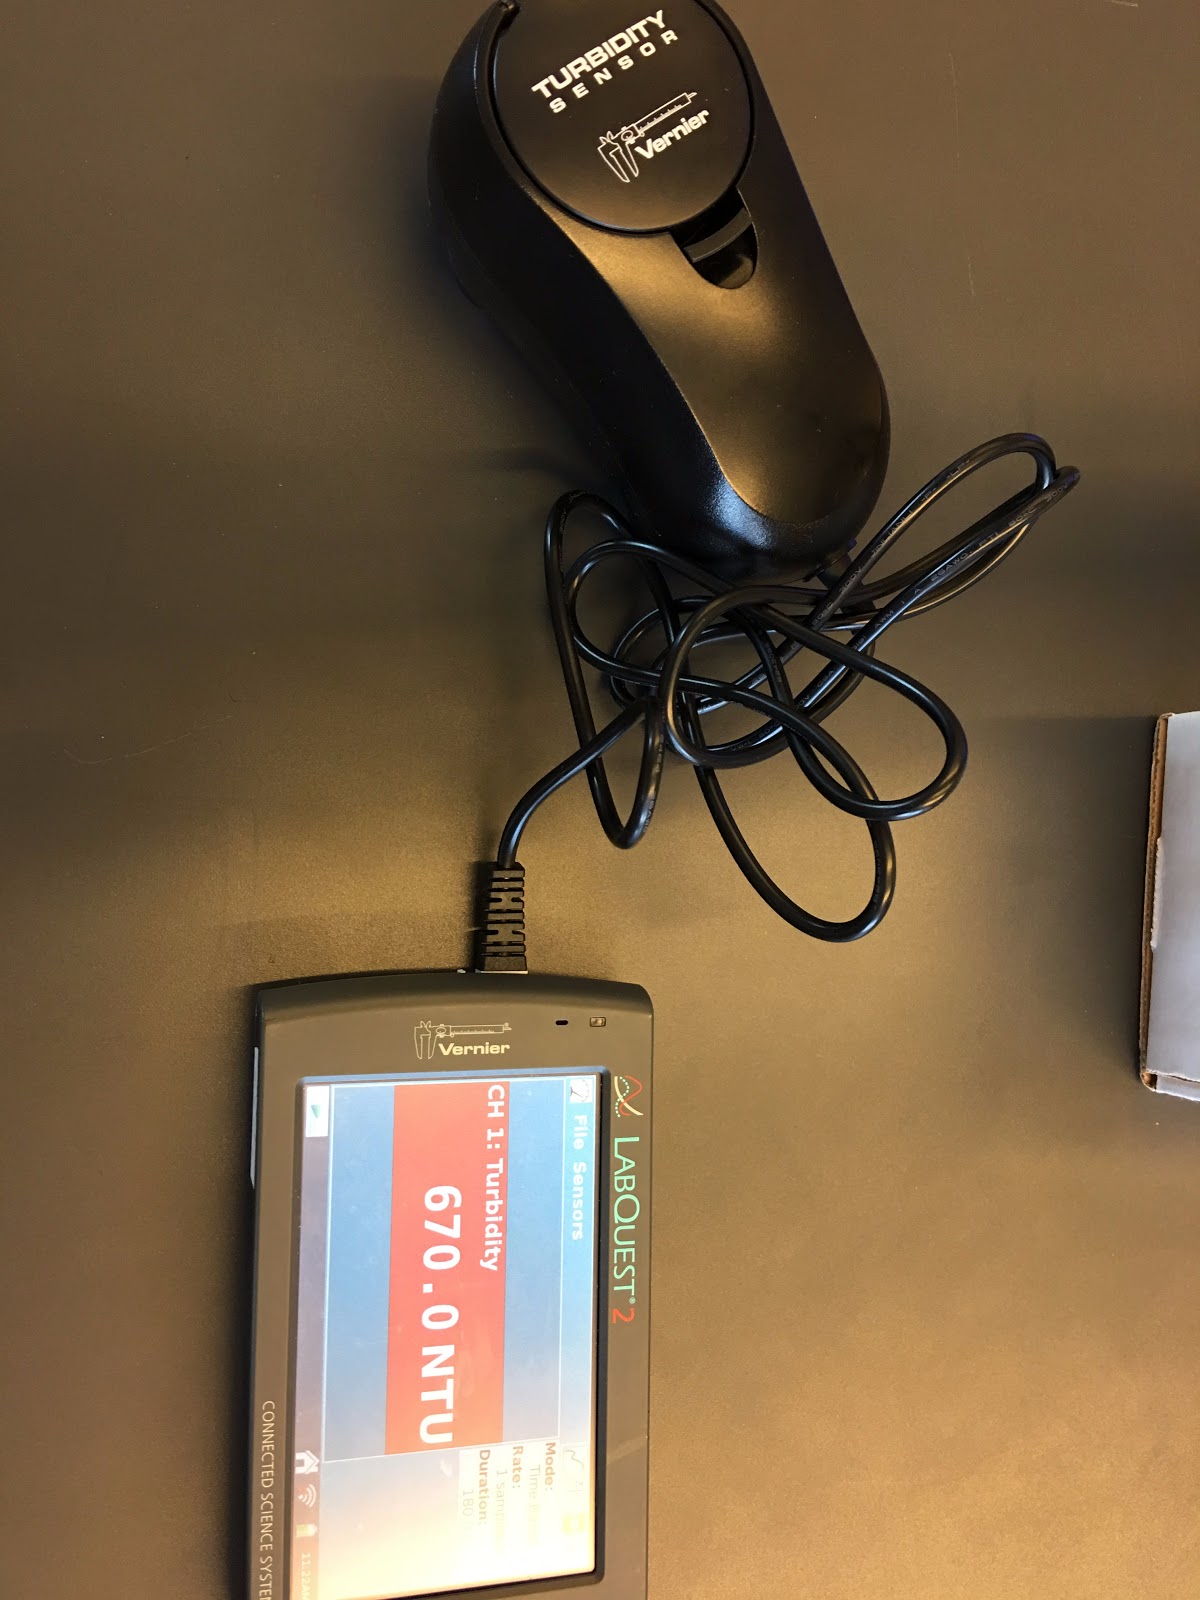
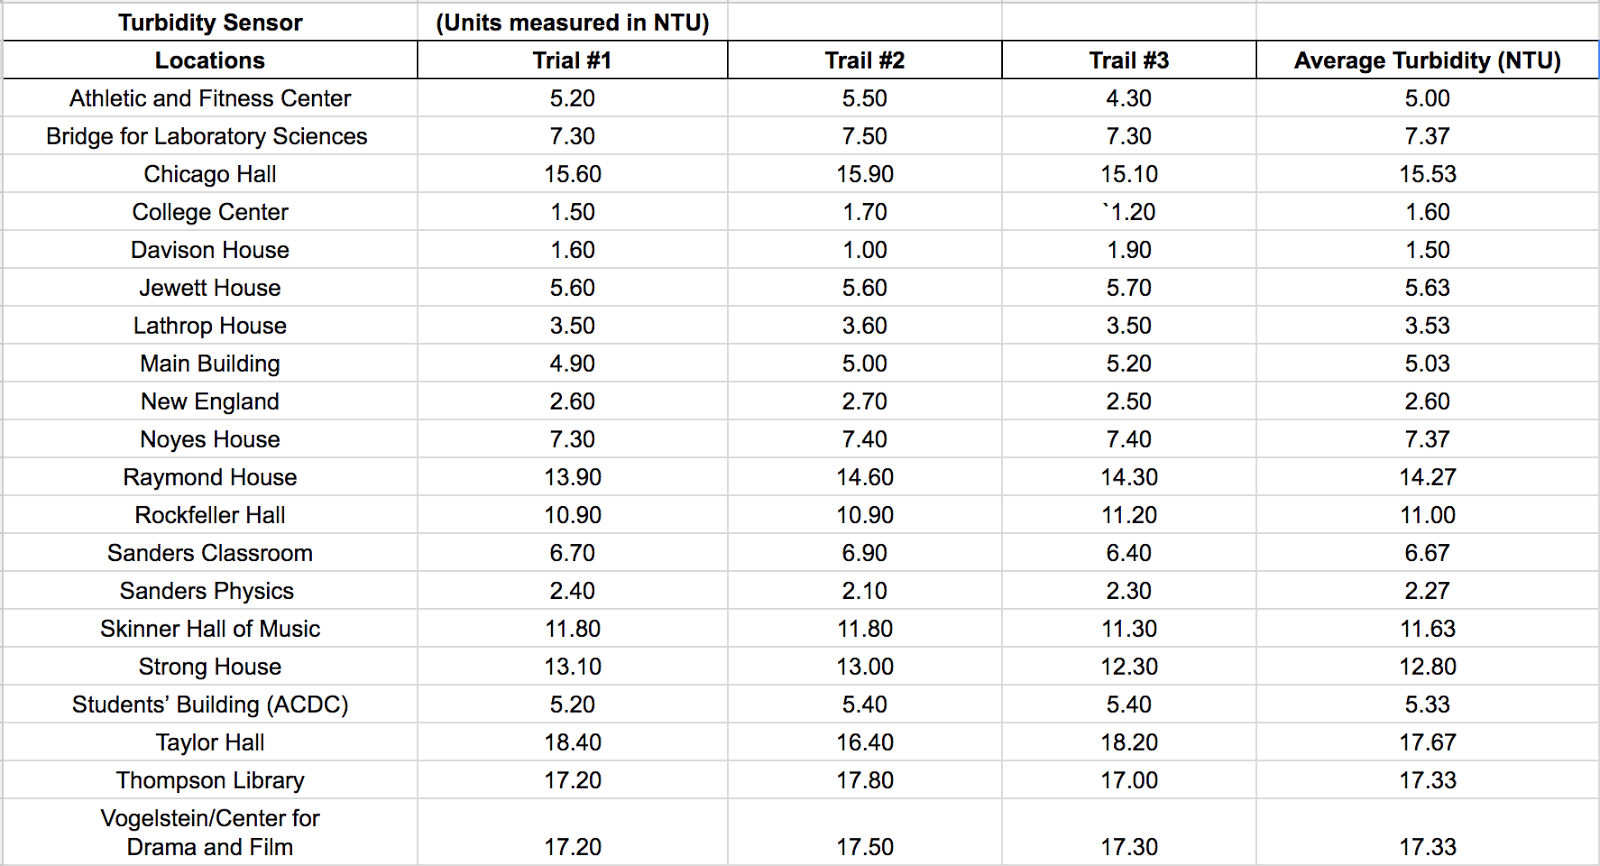
Our procedure to measure the turbidity of the water from the water fountain is by connecting the turbidity sensor to the LabQuest. The data is automatically presented with the units NTU, which stands for Nephelometric Turbidity Unit and measures scattered light at 90 degrees from the incident light beam. The light used is white. We calibrate the sensor to 0 NTU, yet it starts with 670.0 NTU. The second step filling up the small container that comes included with the turbidity sensor to the white line. Before we place the container inside the sensor, we must clean the outside of the container with clean paper towels in order to for no excess of water on the surface, which might affect our data. We need to make sure that the turbidity is placed still on a flat surface because shaking the sensor will severely affect the data due to the water particles moving at a fast speed and the light being shaken. Now, we can place the water sample into the sensor and we wait for one minute and thirty seconds in order for the measurements to be accurate and moving between a .1 NTU difference. In addition, we do three trials in total in every location in order to compare the data and find an average. We might test the same water three times or find three different water fountains depending how many water fountains are in the location.
Data of Turbidity
Explanation of Turbidity
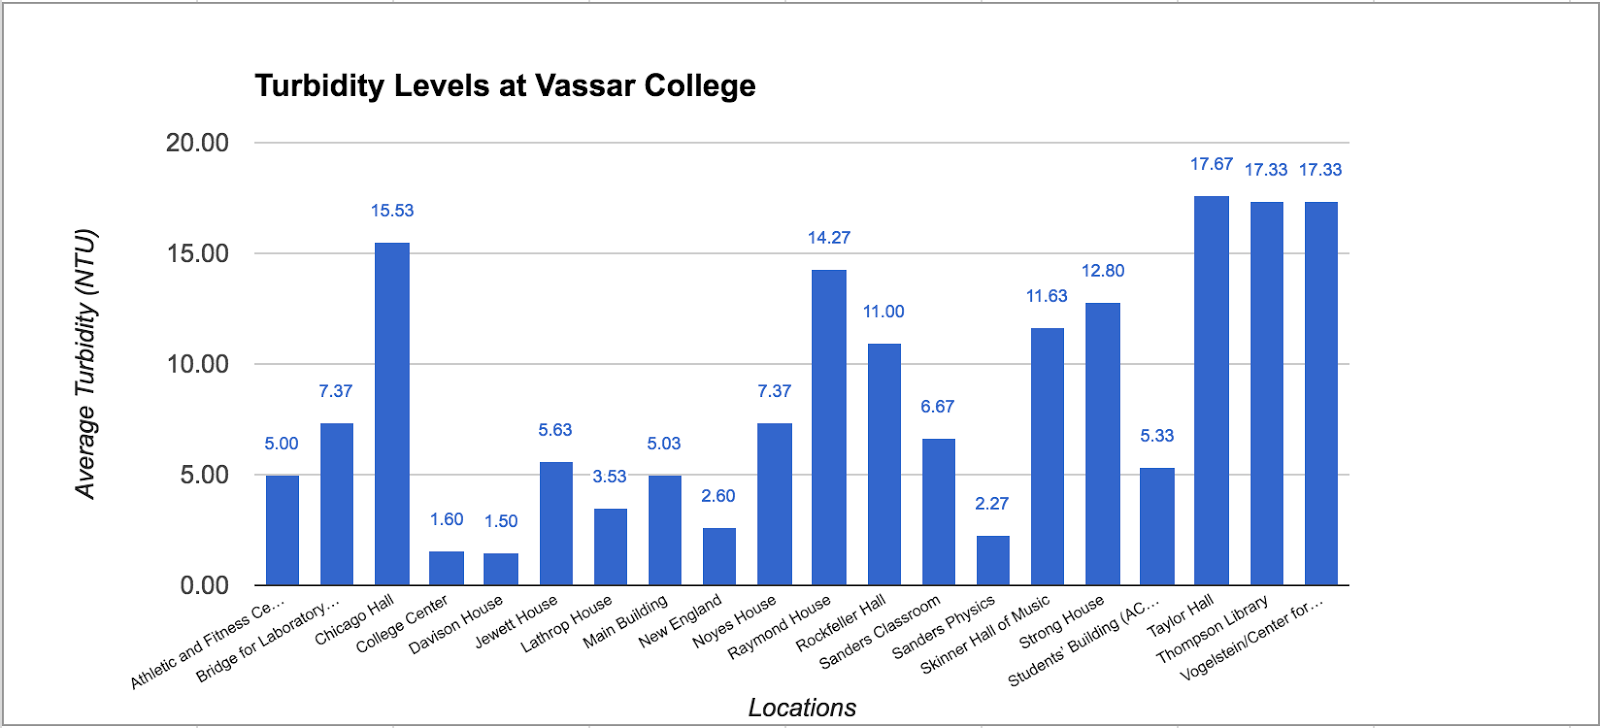
The explanation of the turbidity is really crucial. The turbidity measures the quality of water by measuring its transparency and see how clear or how much stuff is in the water. What causes turbidity is phytoplankton, water pipes, sediments from erosion, resuspended sediments from the bottom, waste discharge, algae growth, and urban runoff. In other words, the NTU should be really low in order to drink from it. As you can see from the data table, Taylor Hall has the highest turbidity with an average of 17.67 NTU while Davison House has the lowest with a 1.60 NTU. What I researched is The World Health Organization stated the the turbidity of drinking water shouldn’t be more than 5 NTU, and should ideally be below 1 NTU. Overall, Vassar College has a decent clear water quality.
Reflections
Most of our predictions were right, except the Bridge for Laboratory Sciences being one of the cleanest water sources. Our predictions were based on how recent was the building’s last renovation because that means the building has new pipelines, which can lead to cleaner water. What might have lead to the Bridge for Laboratory Sciences not being really clean might be due to errors in our data. In addition, Davison House was a top choice because it is the most recently renovated dorm at Vassar College. It was built in 1902 and renovated in 2009.
The science we learned during this project is related to the potability of water depending on its clarity and pH levels. Water clarity is important to its potability as it is an indication as to how much particles are in the water that you may drinking when there shouldn’t be any. Water should ideally be below 5 NTUs (Nephelometric Turbidity Units) and at Vassar, that limit is sometimes exceeded in certain buildings. We also learned about pH levels and how for water, they should ideally be close to a pH level 7 and range from 6.5 to 8.5. After gathering pH levels across Vassar, our data shows that Vassar has ideal pH levels for water. The science we had to learn for the pH sensor was what pH stood for “potential for hydrogen” and how that can affect water taste. Overall the science we learned was self taught and it was engaging because of our project.
Our project fits in with current science/technology as it is important to properly identify clean sources of water. There are areas around the world that do not have access to clean water and learning to identify sources that can affect pH levels or turbidity levels of water can be beneficial to helping make access to clean water widespread. Researching water quality also supports the need for other methods of keeping water clearer and safer to drink.
What we would have done differently in our project is be efficient in the time we take to collect the data. The progress was long and tiring, so we would have planned a route using the Vassar Campus Map and see which route is the fastest. Also, we could have calibrated the turbidity sensor and pH meter after every usage, but we did not have enough time to do it.
If we had more an additional six weeks for this project, we would have test every water source at campus from bathroom sinks to kitchen sinks and water fountains. Also, we would have tested all of our data again in order have more accuracy. Our research would have contained more details about pH levels and turbidity in order for our audience to have a better understanding of what the water is different in many locations at Vassar College.