For my project, I was interested in earthquakes; more specifically, I was interested in how people feel the impact of earthquakes that happen further and further away from them. Since noticeable earthquakes are fairly rare on the East Coast, and are certainly beyond my ability to reproduce, I instead collected data from the USGS’s online databases of recent earthquakes and reports thereof.
I decided to focus on four earthquakes in the US (including Hawaii) which had an unusually high number of responses, and construct models based on the data that I had gathered. Graphing the models themselves proved difficult (since I have multiple input variables, graphs would have to be in 3D), but below are individual graphs of the variables for the earthquake in American Canyon, California. The text form of general model for that earthquake is also below. (I produced graphs for all models, but I only included one, since they all look more or less the same).
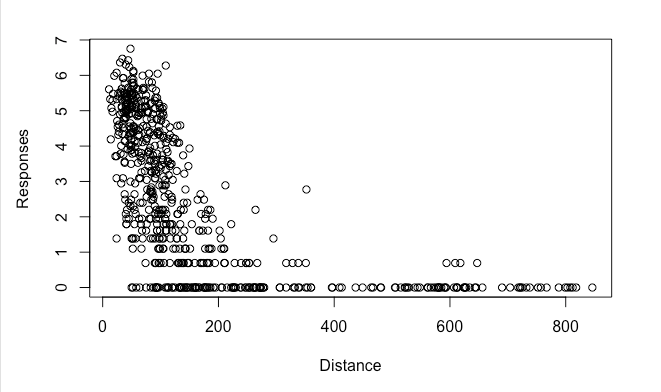

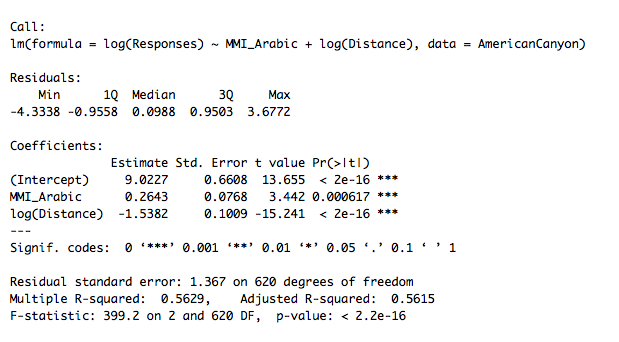
The individual plots and model formula more or less behaved as expected. First of all, being further away from the earthquake makes you less likely to report it, which did not come as a surprise (the zero values are because I took the logarithm to make the data more visible, and ln(1 report) =0). The reported shaking (MMI) follows a rough bell curve distribution, which was also to be expected: towns that experienced class 1 shaking were unlikely to report it at all, and very few towns experienced class 7 or 8 shaking (which consist of severe property damage).
The models were also fairly powerful: the models for Pawnee, Waikoloa, Belfair, and American Canyon explained 24%, 22%, 41%, and 56% of the variability in my data, which was a lot more than I was expecting. A big source of error is that the data are not weighted for town size; ten reports from a town of two hundred people is a lot more important than ten reports from a city of eight million, but the model weighs them the same. This is likely why the Pawnee and Waikoloa reports are bad. The data for the Pawnee earthquake (in Oklahoma) features reports from Florida, Nevada, and Maryland, while almost half of the Waikoloa data are reports from one city.
If I could continue this project for another 6 weeks, I would try and write or find a piece of code to weight the data points by zip code population density. Doing this by hand would be impossible (the Pawnee data set contains 3981 zip codes, for example), but a computer could chew through it quickly if I could teach it how. (All of the necessary data is publicly available from the census, so that wouldn’t be a problem).
If I were going to start this project over again entirely, I would try to do comparisons between earthquakes. The way that the USGS’ website is structured makes it impossible to directly compare the reports without downloading and merging hundreds of individual earthquake reports, but again, I could try to find or make a piece of code that could do this. It would open up some interesting questions that were unavailable with this approach: when in the day are people most likely to report an earthquake? How does the magnitude affect how far away the average report is? How about the depth?
The science involved here was in how the energy released by earthquakes is felt by humans, and I learned a lot about that. I also learned a good bit about data wrangling and interpretation from this project; I’ve taken classes about it before, but this was my first use of the techniques in the wild.
Most of the science around earthquakes is based around understanding how they happen with the pipe dream of predicting them. This data is of limited use in that respect, but research like this has potential in understanding how people assess and prepare for earthquakes. Do frequent minor earthquakes make people nervous or jaded? How about larger ones nearby? Even if we can’t predict earthquakes, understanding these kinds of questions could help the USGS and other organizations prepare responses for when they do.