Open Data & Tools for Information Visualization

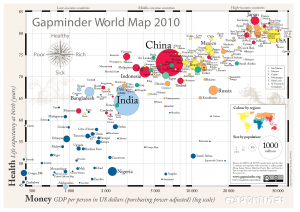
Gapminder World Map 2010

by Cristián Opazo

In a previous post we examined the broad field of data visualization, ranging from the ubiquitous charts and graphs to be found on every news site to the sophisticated instances of visualization of experimental data at the frontier of research in the natural sciences. In this post, I intend to offer a sample of the most relevant and useful data sources and visualization tools available on the web, with a particular emphasis on those with potential impact in higher education.

Before there were data visualization tools, of course, there was data. One of the most important consequences of the profound impact of the internet on our culture has been the ever-increasing promotion and acceptance of initiatives of open access to human knowledge. This translates, among other things, into a wealth of open data repositories readily available for usage, like the World Bank Data site, the databases from the Organization for Economic Co-operation and Development (OECD), and projects by the Open Knowledge Foundation. Ever since making its way into the White House in 2009, the Obama administration has been true to its campaign promises of making public data available through a series of online portals, such as data.gov, usa.gov, and USAspending.gov, which offer a variety of demographic, financial and social data sets alongside useful visualization tools. (As an aside, we recently learned with horror that the existence of these sites could be threatened by the compromises reached during the approval of the latest U.S. federal budget.) The data.gov site features a series of educational projects in K-12 and higher ed for students to learn about government data, how to use it, and help create the tools that enable others to do so. On USAspending.gov, interested citizens can find out information about how their tax dollars are spent and get a broad picture of the federal spending processes. You can view and compare, for instance, the relative spending of every government agency at a glance.

Having open data repositories as well as open architectures for the development of appropriate tools for analysis and visualization of these data is crucial for an informed, educated society. Here’s an inspiring 5-minute talk by Tim Berners-Lee, inventor of the world wide web, about the relevance of this issue.
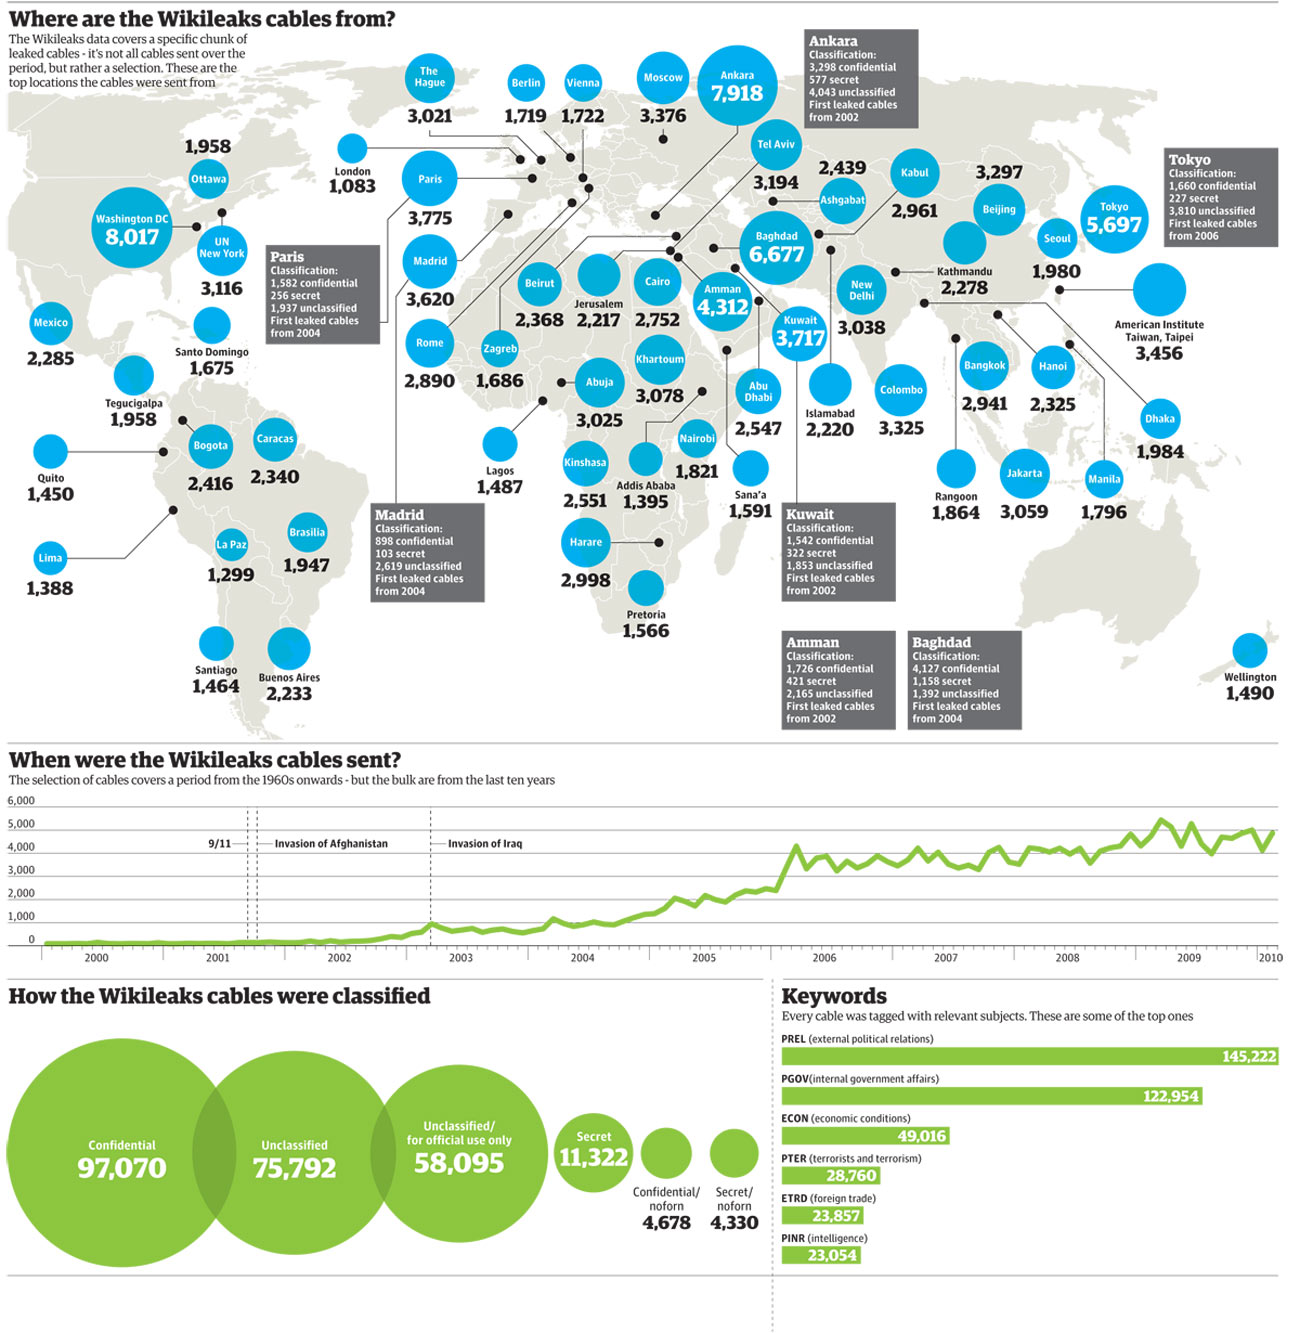
News organizations around the world have also made efforts not only to make publicly available data accessible to readers, but also provide interactive tools for easy analysis and visualization. The British paper The Guardian has been a leader in this regard through its Data Store site. They have collected, curated and made available global development data from sources that include the United Nations, the World Bank, and the International Monetary Fund (IMF). Here is a sample search for world literacy rates using the Data Store analysis tools. Furthermore, The Guardian’s Open Platform initiative allows developers to create custom applications through its open API. The site has been also successful in crowdsourcing a number of large data analysis efforts including sifting through Sarah Palin’s recently released email archive.

Wikileaks world map of embassy cables. Illustration by Finbarr Sheehy for the Guardian (Nov. 29, 2010)

A number of tools now allow us to analyze, visualize, publish and share our own data, allowing us to become active participants of this new paradigm of open knowledge. Sites like Gapminder.org, created by the great Hans Rosling have acquired well-deserved attention because of their ability to make instant sense of otherwise impenetrable mountains of data. The Gapmider World application allows to interactively pick and choose world data about wealth and health indicators and dynamically visualize it through the years. Similarly, the interactive portal visualizing.org is “a community of creative people working to make sense of complex issues through data and design.”

Another site worth experimenting with is Many Eyes, by IBM Research, which also provides you with the ability of contributing your own data and creating visualizations such as word trees and tag clouds, charts and maps. In traditional Google fashion, Google Fusion Tables provide an open application that makes it possible to host, manage, collaborate on, visualize, and publish data tables online. Finally (if you haven’t had enough already), this blog post by Vitaly Friedman, author and editor-in-chief of Smashing Magazine, feature a series of  interesting approaches to data visualization.

Enjoy, explore, and contribute!

Share

Math on the web

by Cristián Opazo

Since its inception, the World Wide Web has gradually evolved in order to accommodate user’s needs, particularly in regards to input and output of text and images. What started as very rudimentary displays based on the ASCII character set, has now become expanded, standardized systems like Unicode, HTML4 (and hopefully soon HTML5), CSS and all other web standards in use today. But what about the most universal of human languages, mathematics? The evidence tells us that the ability to display mathematical expressions on the web has evolved very slowly, and is very far from reaching a point of widespread adoption, which is somewhat surprising considering the great amounts of potential users around the world.

Even though a standard for math on the web, MathML, has existed since 1998, with its latest version MathML 3.0 adopted very recently, it is a tool with remarkably little use on the web. There are many reasons for this: the reluctance of users to learn a new coding language from scratch, the availability of “user-friendly” tools like MathType and Microsoft Equation Editor (now bundled into Office 2010), but particularly the widespread, cult-like use of TeX and LaTeX, the gold-standard of typesetting systems, which has been adopted by academics, scientists (and more importantly, publishers) since its development in the late 1970’s. As you may have experienced, the divide between those who are willing to publish some math (that may not look perfect but was generated with little effort), and those whose mathematical expressions must look nothing-less-than-perfect (no matter the effort), is enormous; the first camp prefers limited (but easy-to-use) equation editors, whereas the other favors TeX or LaTeX, and publish math online by rendering their documents into PDFs, in a way avoiding the web altogether.

So, in order to do the right thing we all should learn MathML, right? Wrong. The same way that most of us who publish web content on a regular basis (through blogs, Facebook, Twitter, etc.) do not type HTML code from scratch, there are many ways to generate MathML code from other sources. Here’s a nice list of software tools that will allow you to render (or convert) your math expressions into MathML. Just keep in mind that, in order to be able to display MathML code natively (i.e. without a special plug-in), you must use a good web browser (i.e. one that cares about open standards). Until recently, everybody’s favorite Firefox was the only browser that supported MathML natively, but since August, 2010, Safari and Google Chrome also do. (Perhaps unsurprisingly, Internet Explorer does not support MathML natively -only through the third-party plug-in MathPlayer.)

Now, how can we generate beautiful math expressions in WordPress sites— like this one? Sure, you could reconfigure your WordPress server by hacking into the the PHP, but there are easier ways. Since WordPress is an open-source application, developers are continuously creating new functionality for it: here’s the latest list of all LaTeX plugins for WordPress. We’ve only tried a few of these, but the main difference between them is the fact that most generate math expressions as graphics (GIFs or PNGs), whereas only a few of them generate proper MathML code. (Also, in some cases, the code compilation and rendering of images occurs locally, whereas in other cases, it happens remotely, which is a relevant point to discuss with your systems administrator.)

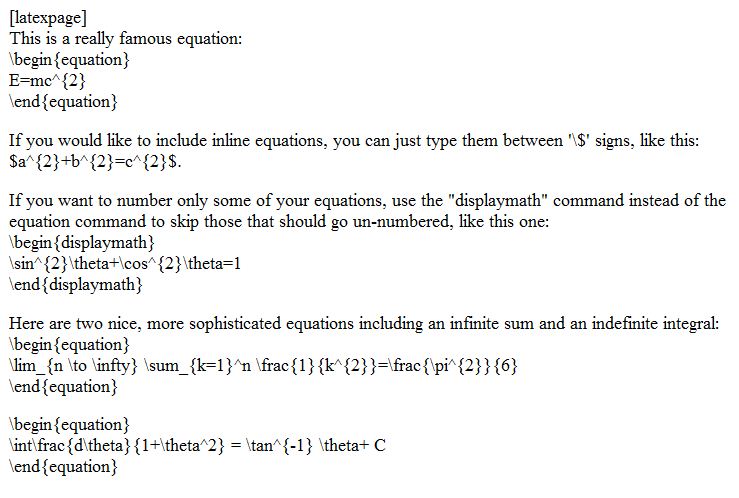
Here at Vassar, we have just installed the QuickLaTeX plug-in and are very happy with its performance— if what you want to do is typing or copy/pasting your good ‘ol LaTeX commands. All you need to do is to start your post with the expression “latexpage” (between square brackets), and then enter your LaTeX code below.

Here’s an example:

This is a really famous equation:

(1)   \begin{equation*} E=mc^{2} \end{equation*}

If you would like to include inline equations, you can just type them between ‘$’ signs, like this: a^{2}+b^{2}=c^{2}.

If you want to number only some of your equations, use the displaymath command instead of the equation command to skip those that should go un-numbered, like this one:

    \begin{displaymath} \sin^{2}\theta+\cos^{2}\theta=1 \end{displaymath}

Here are two nice, more sophisticated equations featuring an infinite sum and an indefinite integral:

(2)   \begin{equation*} \lim_{n \to \infty} \sum_{k=1}^n \frac{1}{k^{2}}=\frac{\pi^{2}}{6} \end{equation*}

(3)   \begin{equation*} \int\frac{d\theta}{1+\theta^2} = \tan^{-1} \theta+ C \end{equation*}

As you can see, the equations are rendered as PNG image files (sure, it’s not MathML, but it’s the next best thing.) Here’s the code that generates the expressions above:

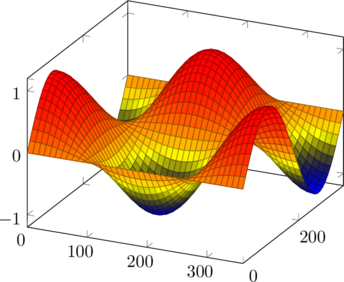
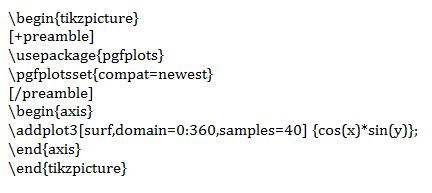
QuickLaTeX can also render graphics on the fly through the pgfplots package. Here’s an example:

Rendered by QuickLaTeX.com

Here’s the code that generated the 3-D plot above:

Here’s a quick start guide to QuickLaTeX, featuring some neat examples.

As you can see from the results above, this plugin is already available on our WordPress production system. Please let us know what you think!

Share

Visualizing Information

by Cristián Opazo

A 3-D visualization of a particle collision event at the LHC

Living in the information age has fundamentally transformed the way we interact with the world around us. In particular, it has transformed the way we digest information from the many sources at our disposal. Understanding diverse, complex sets of data has become a familiar task for all of us to deal with even through the simple process of reading the paper every morning. In other words, information technologies are reshaping our literacy to necessarily include new digital literacies.

The term Scientific Visualization has been used for decades in relation to the use of computer technologies as a way of synthesizing the results of modeling and simulation in scientific and engineering practice. More recently, visualization is increasingly also concerned with data from other sources, including large and heterogeneous data collections found in business and finance, administration, the social sciences, humanities, and even the arts. A new research area called Information Visualization emerged in the early ’90s, to support analysis of heterogeneous data sets in diverse areas of knowledge. As a consequence, the term Data Visualization is gaining acceptance to include both the scientific and information visualization fields. Today, data visualization has become a very active area of research and teaching.

The origins of this field are in the early days of computer graphics in the ’50s, when the first digital images were generated by computers. With the rapid increase of processing power, larger and more complex numerical models were developed, resulting in the generation of huge numerical data sets. Also, large data sets were generated by data acquisition devices such as medical scanners, electronic microscopes and large-scale telescopes, and data was collected in large databases containing not only numerical and textual information, but also several varieties of new media. Advanced techniques in computer graphics were needed to process and visualize these new, massive data sets.

A 3-D sonogram image of a baby fetus

Edward Tufte‘s now classic books on information visualization, The Visual Display of Quantitative Information (1983) and Envisioning Information (1991), encourage the use of visual paradigms with the goal of understanding complex relationships by synthesizing both statistics and aesthetic dimensions. A little earlier, Jacques Bertin, the French cartographer and geographer, introduced a suite of ideas parallel to Tufte’s in his book Semiologie Graphique (1967). The basis of Bertin’s work is the acknowledgment that graphic tools present a set of signs and a rule-based language that allow one to transcribe existing complex relations among qualitative and quantitative data. For Bertin and Tufte, the power of visual perception and graphic presentation has a double function, serving both as a tool for discovery and a way to augment cognition.

In future posts, I will describe in more detail the current landscape of data visualization across the fields of natural sciences, social sciences, humanities and the arts. Stay tuned.

Share

Your homework today: improve Wikipedia

by Cristián Opazo

What would happen if you would attempt to address two of the most controversial issues in higher education today, namely, the use of Wikipedia and the peer-review paradigm– both at once in your classroom? This is precisely what one brave member of the Vassar faculty, Chris Smart, Associate Professor of Chemistry, did with his students in a senior-level course, during the spring semester of 2010.

“Since we know that our students use Wikipedia for academic purposes on a regular basis, as a teacher, you can’t just deny it, prohibit it, or look away,” says Smart. “So I asked myself: what could I do to motivate my students to use Wikipedia in a more constructive way? And the answer is more than obvious: we need to make them active contributors, instead of passive consumers. The problem with Wikipedia in higher education is not Wikipedia itself: it is the use that students make of it. When students use it passively, treating everything they find as truth, especially on topics they have little or no knowledge about, then we all have a problem. But if you make them confront what they read with a critical eye, and take it upon themselves to improve the existing (and non-existing) content, then you have radically turned the situation in everybody’s favor.”

Smart, who was teaching the 300-level course “Chemical Reactions” in the spring of 2010, designed the following assignment: each student would pick one of the many existing Wikipedia articles on chemical reactions tagged as a stub (that is, a very short, poorly written article), and improve it with quality content such as text, chemical diagrams and bibliographic references. “I quickly realized that I needed the help of an experienced Wikipedia user to learn whether this was a feasible idea, so I approached Cristián Opazo from Academic Computing Services, and he was very excited about the idea from the very start. He conducted several hands-on sessions about editing Wikipedia in my classroom, and the students started getting busy right away.”

I could see that perhaps the single most important factor that would motivate my students into doing a good job in this assignment, would be the fact that the whole world was watching,” adds Smart. “The academic world tends to quickly dismiss Wikipedia on the basis of its openness and its lack of formal peer-review by experts, but the way I see it is that this openness is precisely what makes it a great resource: you have this huge community of contributors all over the world that care about particular topics, and many of them are committed enough to criticize existing content, and to go to great lengths to make a certain article accurate and cohesive. In fact, at least one of my students engaged in a very constructive exchange with another Wikipedia contributor somewhere out there, and this exchange was prompted by this student’s work as a Wikipedia editor for this class assignment. He still keeps an eye on the evolution of the article long after the class is over, because he feels proud of his work: now there is this article about a particular chemical reaction that is available for the whole world to read and reference.”

One of the most often-heard criticisms about Wikipedia is “how good can be something that has been created by an unregulated bunch of anonymous people?” What I tell them is: have you heard of Linux? The most robust, efficient and reliable computer operating system in the history of the world, used in the highest levels of scientific research and business enterprise, was created, and is progressively improved, by an unregulated bunch of individuals around the world. The core ideas that fuel the open-access paradigm are not profitability or market appeal; they are creativity and commitment. And that’s the spirit behind Wikipedia.

To learn more about the use of Wikipedia in teaching and research, listen to this interview with Jimmy Wales, co-founder of Wikipedia at the Chronicle of Higher Education site. This excellent article by Patricia Cohen at the New York Times about re-thinking the peer-review paradigm in academia recently generated a lot of interest.

Share