
https://docs.google.com/a/vassar.edu/document/d/1nvyB5giUicIIiCJuKNKTwJagBlepP8J-IOQsMeMgB7Q/edit
Brownian Motion of a Drunkard
Random Unit Vector 2D Motion of a Drunkard
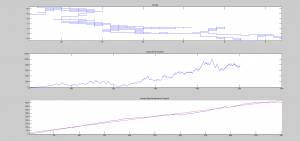
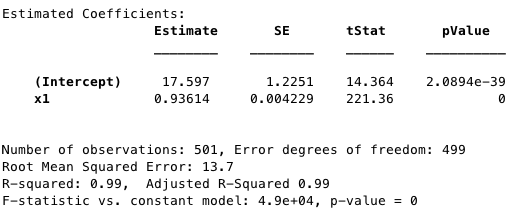
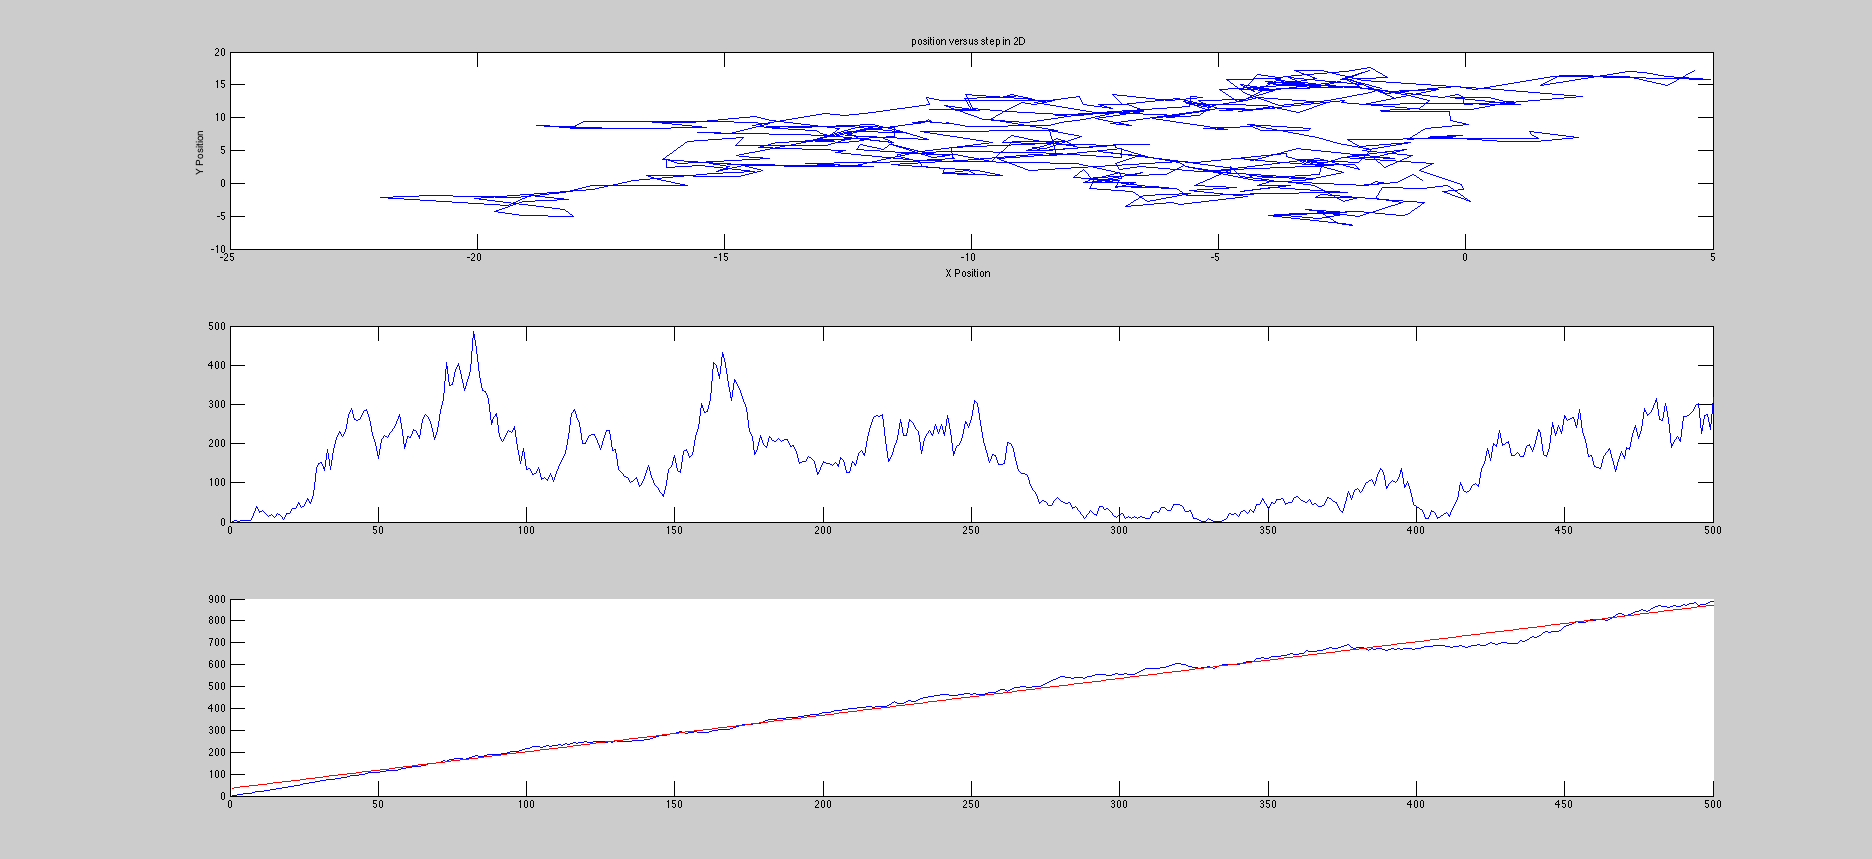
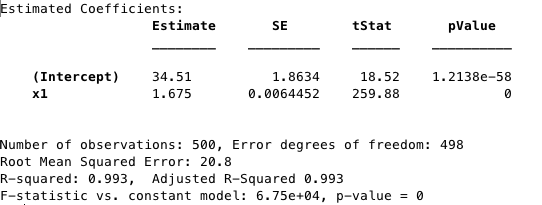
As shown by the standard error of the slope within slopes of the displacement squared, the Brownian Motion has a statistically significant larger displacement squared. This is before I alter the 2D code to account for more drunken chance variables. This will serve as a good baseline to see how the mean displacement changes after each variable is added or combinations of variables are tested. I chose to use brownian motion as the standard since it is purely random in every way (in my code). The direction of a step and length are always randomized. I am very pleased with how my codes came out and the visualizations they provide. I apologize for the poor quality of screenshots but they will not look this way in the final project. The top subplot is one representation of the random movement. The second is a displacement squared of one walk. The final in blue is the mean of all of the displacement squareds. The red is the best fit line with the statistics below.
This will serve as my jumping off point to compare Brownian motion of a drunkard (a gas) to a college student on the weekend with several variables and options besides just taking steps. I am curious to see how much I can alter the mean displacement squared with various variables and different weights. Unfortunately, I still need to collect more data outside of class to correctly weight the variables. I’m still catching up on other work from tech week.

It will also be necessary to label the x-axis of your 2nd and 3rd graphs. How does Brownian motion differ from a simple random walk?