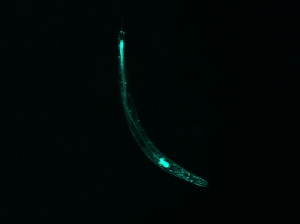
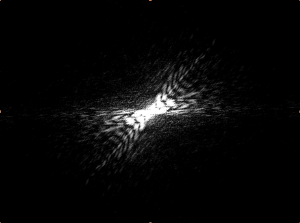
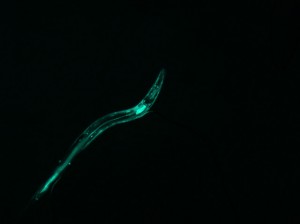
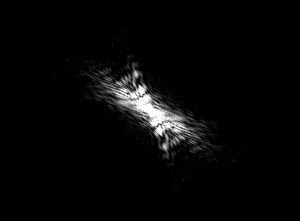
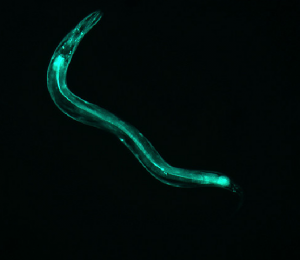
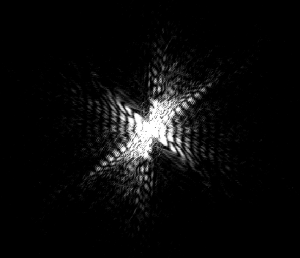
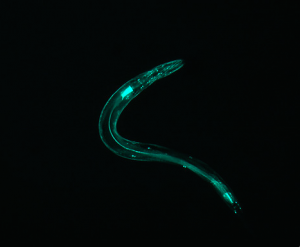
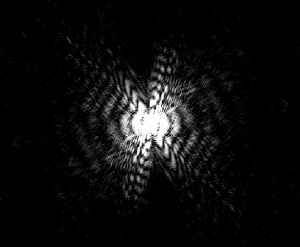
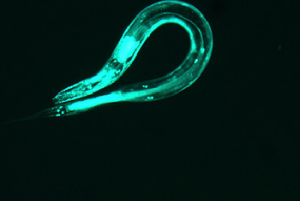
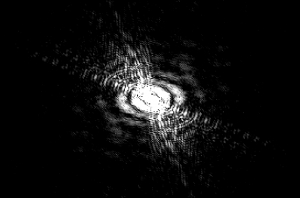
Listed below are five sets of data (3-7), two images each. On the left is the photograph of the fluorescing worm. To the right is its corresponding diffraction pattern, produced with Mathematica.
First, a few comments:
Notice that each worm shape contains a different symmetry (or lack of symmetry). However, every diffraction pattern is symmetrical. The two images tend to share some symmetrical qualities, as noted below each image.
These diffraction patterns are due to the fluorescing parts of the worm (GFP, or green fluorescing protein). I believe that because of my image manipulation (converting to grayscale and brightening the image significantly), the diffraction pattern is approximately due to the entire worm and not just the fluorescing parts.
On that note, I’d like to discuss the parameters I used for image manipulation and Fourier Transforming.
- The Fourier Parameters I chose were {0, 1} . These are the default parameters when using the FT command on Mathematica. I chose them among the three most common by ruling out the other two: {-1, 1} is used for data analysis (which I was not doing), and {1, -1} is used for signal processing (also irrelevant to my project). My choice of parameters specified the conventions I wanted the program to use when applying the transform.
- The command ImageAdjust [image, {a, b}] adjusts the contrast of the image by a and the brightness by b. For most of my images, I adjusted the contrast by the same amount, but changed the brightness differently for each photo depending on my judgement.
- I divided the images by hand and reassembled them according to the image dimensions, rectangles of dimension {col/2, row/2} (where col = the number of pixels in each column of the image, and row = the same for each row). I could have use the command RotateRight, but I did not figure that out until after I developed this equally effective algorithm.
IMAGE 3
This image has axial symmetry perpendicular to the axial symmetry of the worm. The worm is mostly linear, and so is the diffraction.
(complete file for image 3: book 3 )
IMAGE 4
See comment for image 3.
(complete file for image 4: book 4 )
IMAGE 5
Although this does not have an “inversion center” (the worm does not complete a loop), it is significantly less straight than the first few examples. Correspondingly, the diffraction pattern has an axial symmetry perpendicular to the “axis” of the worm. However, it splays out to a higher degree, indicating that the area of the pattern corresponds with the curvature of the worm.
(full file for image 5: book 5 )
IMAGE 6
This further backs up my hypothesis from image 5. The curvature of the worm is great and the area of the pattern is also large. However, this worm does have a sort of “inversion center.” The diffraction image has an eye in the center, which is different than all of the preceding images. The curvature of the worm greatly effects the produced image, which is not surprising, but the overall shape of the image changes dramatically. With more circular worms, an “eye” is formed in the center of the diffraction pattern, and the pattern here has both some rotational symmetry and axial symmetry. With straighter worms, the diffraction is much more linear, containing only axial symmetry.
(full file for image 6: book 6 )
IMAGE 7
See comment for image 6.
(full file for image 7: book 7 )


The images look great! I do have a couple of questions. Here you are calculating the diffraction pattern due to the GFP. Is that the same as the diffraction pattern due to the entire nematode? You should also label every image/graph in a descriptive way. It might also be useful to give some details about parameters used in the process. For example, Did you have to use certain parameters for the Fourier transform, adjust images etc.?