Group 1 Abstract: Cell Phone Radiation

We will use the RF Meter to study how much radiation is emitted by different cell phones during a call. We will record service provider (i.e. Verizon, Sprint, AT&T, T-Mobile), make (i.e. LG, Samsung, etc.), and model (Droid, iPhone, etc.) for each phone and compare radiation levels. We predict that there will be a correlation between the make/model and radiation, for instance Droids may emit higher radiation levels than iPhones, rather than a correlation between service provider and radiation. We’ll compare our collected data against current theories on cell phone radiation and will summarize our conclusions in a commercial/public-works announcement.

Group 2 Abstract

Our project will look at the concept of lasers as a weapon. We will first test the feasibility of laser weapons by figuring out how powerful of a laser would be required (if it is even possible) and then determining the other limiting factors (size, energy consumption, etc.) to see if it would be possible to build a laser powerful enough to weaponize. We will also look at the portrayal of laser weapons in popular culture (like Star Wars) and analyze the accuracy/inaccuracy of their portrayal.

Nuclear Radiation Research [Results and Conclusions]

The results of our research of current radiation levels around Japan’s Fukushimadaiichi nuclear plant leads us to several conclusions about the effects on people who receive contact with nuclear radiation.

We posted the analysis earlier along with your data. Below, are the conclusions we came to based on the data we collected from TEPCO and other sources that recorded radiation levels near Fukushima as well as Tokyo:

How does this compare to average radiation levels? Looking at the most current statistics (April 19):

mircoSv/ day = Reading of the integrated dose (as seen above)

1. Fukushima Monitoring Post

10.8 microSv/hour (242 microSv/day = same as round-trip flight from New York to Los Angeles)

à 242 microSv/day = 88330 microSv/year = 88.3 times annual average dose limit)

2. Tokyo
0.075 microSv/hour (1.8 microSv/day = 657 microSv/year = 65.7% annual dose limit)

As you can see, the levels reported near fukushima are still dangerously high and prove to be very harmful for people who are exposed to it daily. As David posted earlier, we used a  Geiger counter to compare it to levels that we, as Vassar students, experience around campus and with daily technology:

David’s data conclusions:

To give you an idea of just how small these amounts are, here are some facts about radiation exposure (taken from Reuters):

People are exposed to natural radiation of 2-3 mSv a year.

In a CT scan, the organ being studied typically receives a radiation dose of 15 mSv in an adult to 30 mSv in a newborn infant.

A typical chest X-ray involves exposure of about 0.02 mSv, while a dental one can be 0.01 mSv.

Exposure to 100 mSv a year is the lowest level at which any increase in cancer risk is clearly evident. A cumulative 1,000 mSv (1 sievert) would probably cause a fatal cancer many years later in five out of every 100 persons exposed to it.

1 mSv (millisievert) is equal to 100 mR, so we are exposed to 200 – 300 mR/year. A chest X-ray exposes us to 0.02 mSv, or 2 mR. It would take roughly four days of nonstop exposure to a device that emits radiation at 0.02 mR/hr to receive as much radiation as is emitted by an X-ray in one sitting. Even so, this amount is 1/50 of the lowest level at which there is an increase in cancer risk.

On March 26, at Fukushima Monitoring Post 79, radiation was being emitted at a rate of 825 μSv (microsievert)/hr, or 82.5 mR/hr; that’s 0.83 mSv/hr, which means that if you were exposed for four or five days, you would approach the lowest level of radiation for cancer risk.

In conclusion, the distance away from the radiation epicenter and the wind direction relative to your location can prove to be crucial for determining the amount of radiation one is exposed to. However, it seems that residents in Tokyo, the most populated city in Japan, seem relatively safe from such exposure. We hope that this data and our conclusions have given our readers a comprehensive analysis of the often overwhelming nuclear data that is available on the internet from established sources. Thank you.

Creating a Reflection Hologram

Creating a Reflection Hologram


Materials:

  • Helium-Neon Laser
  • Small mirror mounted on block of wood
  • Lens mounted on PVC Pipe
  • Holographic Plate and Developing Kit
  • Lightproof box (Holographic plate should be inside)
  • Sandbox
  • Shutter (can simply use cardboard stock)
  • 4 Inner tubes
  • Sturdy Table
  • A small object

Setup:

  1. Lay the inner tubes on the table so they will align with the corners of the sandbox
  2. Place the sandbox on top of the inner tubes. Doing this will reduce the amount of vibrations within the sandbox.
  3. Place the He-Ne laser inside the sandbox, preferably near a corner and aiming parallel to the long side of the sandbox. You may want to dig it into the sand a bit to reduce possible vibrations or movement of the laser.
  4. Take the lens mounted on the PVC Pipe and dig it into the sand about six inches away from the laser. The laser should be going straight through the middle of the lens. Also make sure the lens is aligned properly as to spread out the laser light.
  5. Place the mirror mounted on wood about six inches past the lens. The mirror should be located in the middle of the spread out laser beam. Turn the mirror 30 to 45 degrees away from the incoming light.
  6. Take the small object and lay it in the sand about two feet away from the reflected laser light. Make sure the object is secure enough to stand while the holographic plate is leaning on it. If not, you may have to build a tiny stand to hold your holographic plate at the corners.

Procedure:

  1. Turn on the laser and make sure the setup is done correctly. The laser light should be covering the entire object you wish to turn into a hologram.
  2. Place a piece of cardboard stock in front of the laser; this will act as a shutter. Make sure there is no laser light leaking out the sides of the shutter.
  3. Turn off all lights in the room. Any light leakage could ruin the holographic image.
  4. Take the holographic plate (should not have been exposed to light yet) and lean it against the object you wish to create an image of. The emulsion of the holographic plate should be facing the object. The face of the plate should be slightly more than perpendicular to the laser light.
  5. Sit still and keep quiet for around 5 minutes to let the vibrations in the room and sandbox to settle. Light waves are very small and the slightest vibration could alter the image and distort the final product.
  6. Carefully but quickly remove the shutter from the laser for about fifteen seconds. Place the shutter back.
  7. Remove the holographic plate from the sandbox and place it back inside the lightproof box.
  8. Take the Holographic plate to the darkroom where you plan to develop it.
  9. Follow the instructions from the Developing kit. Instructions are generally:
    1. Mix chemicals with distilled water to form developing solution and bleach
    2. Dip and jiggle the plate in developer for around 20 seconds
    3. Rinse in water for 30 seconds
    4. Dip and jiggle the plate in bleach for around 20 seconds
    5. Rinse in water for 30 seconds
    6. Dry vertically using a hair dryer (avoid using high heat)

Recent news in mind-reading

My group has already posted our final project, a report on the physics of mind-reading, but I wanted to share a few recent news articles on the subject. Mind-reading research continues to be a hot topic!

Testing Aural Perception through Audio Format: Results and Conclusions

Results:

Correct Source ID by Song Type

Source Preference by Music Type

Correct Source ID by Sex

Conclusions:

At the beginning of this investigation we sought to determine whether or not a person presented with two samples of music––one primarily acoustic and the other primarily electric, and each played in random order in vinyl and MP3 format––can accurately perceive differences in audio quality between music formats. Attempting to answer this question we tested ten male and ten female subjects, each of whom listened to samples of the Pixies’ “Where Is My Mind?” and New Order’s “Blue Monday.” Among the questions we considered during testing:

1) Might males and females demonstrate different preferences in audio format?

– Furthermore, would these differences be reflected when the genre of the music     changes?

2) Might males and females differ in accuracy regarding which source is which?

– As with Question 1, might these differences be reflected when the genre of the   music changes?

3) Might perceived higher quality in a particular genre of music be associated with either the LP (vinyl) or MP3 (computer) format?

Upon completion of our testing we disaggregated the data into the following categories and sub-categories:

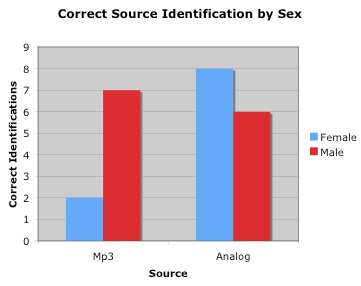
# of people who determined the sound sources correctly for both songs: 7/20.

Of those:

Males: 4/7.

Females: 3/7.

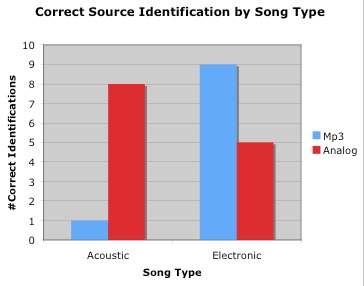
# of people who determined the sound sources correctly for “What Is My Mind?”: 9/20.

Of those:

Males: 5/9.

Females: 4/9.

# of people who determined the sound sources correctly for “Blue Monday”: 14/20.

Of those:

Males: 8/14.

Females: 6/14.

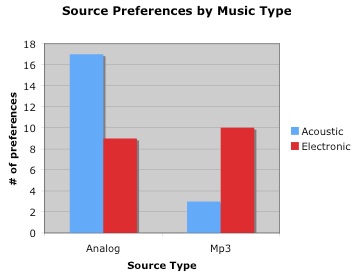
# of people who preferred the LP for “Blue Monday”: 9/20.

Of those:

Males: 3/9.

Females: 6/9.

# of people who preferred the computer for “Blue Monday”: 10/20.

Of those:

Males: 7/10.

Females: 3/10 (One female was indecisive).

# of people who preferred the LP for “Where Is My Mind?”: 17/20

Of those:

Males: 8/17.

Females: 9/17.

# of people who preferred the computer for “Where Is My Mind?”: 3/20

Of those:

Males: 2/3.

Females: 1/3.

From this data we can arrive at the following conclusions:

In response to Question 1:

– Of those who preferred the LP with “Blue Monday,” the majority (6/9) were female. Of those who preferred the computer, the majority (7/10) were male.

– Of those who preferred the LP with “Where Is My Mind,” 9/17 were female. Of those who preferred the computer, 2/3 were male.

– For “Blue Monday,” we can see a clear pattern of males preferring a digital format, whereas females prefer an analog format. For “Where Is My Mind,” there is no decisive margin in either direction. This seems to suggest that, for electronic music, format differences trigger more divided reactions among males and females than with acoustic music.

In response to Questions 2 and 3:

– Of those who correctly determined which source was the computer with “Blue Monday,” only a slim majority were male (8/14). Of those who correctly determined which source was the computer with “Where Is My Mind,” the same was true (5/9). This data, given our small sample size, is inconclusive, but could simply be telling us that males and females are equally adept at perceiving differences in sound quality.

– Interestingly, 14 of the subjects were correct with “Blue Monday,” a 55.5% greater number than were correct for “Where Is My Mind?” The great difference in accuracy between the two songs is interesting when one considers that a very high 17/20 people preferred the LP for “Where Is My Mind?” while preferences were more split for “Blue Monday.” We believe this could reflect a bias among test subjects who believe higher quality in acoustic music such as “Where Is My Mind?” is linked to vinyl, while higher quality in electronic music such as “Blue Monday” is linked to MP3s. This potential bias is reflected in test subject comments about the particular qualities they noticed while listening. For example, “Blue Monday” as an MP3 was frequently cited for better and more distinct bass, while “Where Is My Mind?” as an LP was noted for clearer instrumentation.

– Ultimately it seems that, aside from a statistically significant difference in preferences of format for electronic music, there is little discernable difference in audio perception or preference between males and females. Most apparently, though, it seems that people generally have less than a random coin toss’ chance of guessing both sources in both audio samples correctly (7/20 managed to achieve this). People are more able to do so for electronic music than for acoustic music, but because of the way in which the potential bias toward a specific format for a specific genre may have colored people’s guesses, the electronic/acoustic distinction regarding accuracy is inconclusive. On the whole, however, it seems that the human ear picks up on relatively few differences in MP3s and LPs, formats of definitively varied quality.

Power Consumption of Flash Drives

Historical Introduction to Flash Drive Price Versus Memory Capacity

Flash drive manufacturers typically advertise their products based on memory capacity, not on power consumption efficiency. One might believe that the two necessarily go hand in hand, with newer memory storage devices making considerable gains in both domains every year.

This is certainly the case with memory capacity. $200 could buy you 8 MB of memory in 2000 (year that USB 2.0 flash drives were first introduced to the public), as opposed to 2GB of memory in 2005, and 128 GB of memory in 2010.  Today, the average-sized 4 GB flash drive sells for around $10. Perhaps these increases in memory capacity reflect changes in everyday flash drive use – particularly in the domains of computer maintenance, law enforcement, business, and entertainment, where 4 GB of memory represents optimal balance between cost and desired memory capacity.

However, this does not imply that the power consumption efficiency of flash drives has seen similar gains. Our investigation attempted to establish whether or not larger drives are associated with smaller power consumptions.

Source: www.ehow.com

Results and Conclusions

The graphs in figures 1-3 show the power consumption of the laptop at rest and of the laptop with the flash drive when it is plugged in, as it opens files, and as it is ejected. Tables 1-3 summarize the data (in a previous blog post).

The data does not point to there being a significant difference among the flash drives and the amount of power they consume. Though we believed that flash drives with greater capacity would be more efficient and would consume less power than would smaller ones, especially older ones like the 256 MB, we did not observe a trend in our experiment. The differences that we did observe may be due to normal fluctuations in power consumption of each flash drive and may not be statistically significant. Some background tests in which a file was opened from the same flash drive more than once show that the power consumption reading on the watts up? PRO fluctuates and is not the same each time. It is clear from the data that a computer into which a flash drive has been plugged in consumes more power overall than a computer that has nothing running on it (figure 1). Ejection of a flash drive consumes about the same amount of power regardless of the size of the flash drive, though the 2 GB drive consumed the most power (+7.6 W), and the 2 GB micro flash drive consumed the least (+5.8 W). Whether this is a real trend, however, is uncertain because it was not observed when opening documents from flash drives.

In order to check whether the power consumption recorded when opening files is due to the flash drive or the computer, the same file was also opened from the computer. The data are inconsistent, however, and it is difficult to tell which device is consuming power, or whether there is a trend among different flash drive sizes. Power consumption was greater when opening files from the computer for only some of the files; for others, it was greater when opening them from a flash drive. This suggests that there is no difference among flash drives, and also that we cannot tell which device is consuming power, a confounding variable that must be eliminated in future experiments.

Overall, power consumption increases when a flash drive is plugged into a laptop, but it is unclear whether larger-capacity flash drives consume more or less power, whether they are merely plugged in or opening files. Future experiments should focus on a more rigorous statistical treatment of data, more of which should be collected using many different types of flash drives. Each type of flash drive should be tested multiple times (preferably three or more) and its power consumption should be recorded. Standard deviations should be determined, which can help eliminate or, at the least, pinpoint some of the uncertainties regarding fluctuations in power readings. It would also be interesting to test particular sizes of flash drives and determine if there is a difference in power consumption among different brands.

Final Energy Consumption Conclusions

Total Rooms on campus: 2,458

Energy Cost per kWh: $0.102

kWh per day calculations:

(.25h x  .0139kW) + (.25h x .0236kW) + (9h x .0196kW) + (5h x .0336kW) = 0.353775 kWh/day

Student Average Usage per Day

(0.1491 kWh/day) + (0.353775 kWh/day) / 2 = 0.25144 kWh/day

Student use per academic year

0.25144 kWh/day x 220 days = 55.3168 kWh

Student cost to the college

55.3168 kWh x 0.102 $/kWh = $5.64

All students’ use per day

0.25144 kWh/day x 2,458 rooms = 618.03952 kWh/day

All students’ use per academic year

618.03952 kWh/day x 220 days = 135,968.6944 kWh

Approximate cost to the college

135,968.6944 kWh x 0.102 $/kWh = $13,868.81

Our project attempted to estimate the amount of energy used in the dorm rooms of Vassar students, and the cost to the college for that usage. In order to do this, both Irene and I measured the wattage of the electronic devices in our rooms, which can be seen here and here. We then tracked the time these devices were active over the course of three days to determine our average energy usage in a day. This average was then used to calculate the cost to the college for this use over the course of an academic year, which amounted to a surprisingly low total of total of $5.64. Given our original premise to determine what percentage of our room and board fees goes towards electricity, we found that our actual usage costs amount to 0.054%.

We then used the same average to approximate the cost of all the students on campus, which amounted to 135,968.6944 kWh at a cost of $13,868.81. While these numbers do not take into account the energy consumed by the original overhead lights in place on the dorm rooms, the cost to the college is still less than expected. An interesting feature that developed out of our study was the realization that refrigerators do not use a constant amount of energy to maintain their temperature. While initial readings gave extremely high wattage values (many times greater than all other electronics totaled), this level was not constant. Had the highest level of wattage been the energy used by the fridge constantly over a 24 hour period, we would have seen a staggering 2,162% increase in energy use! While we didn’t get the opportunity to study the refrigerators over a longer period of time, it would be interesting to see how often the high level of energy output is keep constant temperature.

Overall, our project demonstrated the extremely high energy usage at Vassar College. Without even measuring the light bulbs in our own rooms, let alone the lights in every room of campus (many of which are on 24-7) we approximated that we consume 135,968.6944 kWh in an academic year. While the cost of this usage may seem manageable, especially given the high cost of room and board, it does shed some light on how much we’re costing on the grand scale.