Molecular Dynamics Project Summary
Sushant Mahat and Mohammed Abdelaziz
Over the last few weeks, we have been working on a computational project on molecular dynamics. This post below summarizes the details of this project, and the overall goals we achieved.
Initial Goals and Motivations:
We wanted to do an experiment in molecular dynamics as it connects to several things we have studied in our previous physics classes. We used our knowledge on Newton’s second law which we learned in classical mechanics; we used Boltzmann’s distribution and the concepts of temperature from thermodynamics and statistical mechanics; and we used the Lennard-Jones potential which has its root in quantum mechanics. All these features made simulating molecular dynamics an attractive, challenging, and a very educational project.
We had several goals when we started this project. We wanted to be able to simulate a 2-D gas system, and be able to study several of its properties like temperature, energies, speed distributions, and visualization at equilibrium. We then wanted to build up on this system to make it into a 3-D system. We were also thinking about making it possible to increase the temperature of the system and observe how long it takes to come back to equilibrium. This was supposed to be a simulation of periodic heating of gas particles with a laser beam.
Goals We Completed
Due to time constraints, we were unable to fulfill some of our initial goals. However, we were able to finish most of the goals. The goals we met for this project include:
- Simulating the motion of a dilute sample of gaseous Argon atoms in two dimensions.
- Calculating the mean velocities of each atom and plotting their speed distribution in each simulation.
- Determining the temperature of the sample based on initial and equilibrium speeds of each atom, which required a determination of the kinetic energies of all atoms at each time step.
- Comparing the calculated speed distribution with the Maxwell-Boltzmann speed distribution curve.
- Completing the simulation and the above calculations in three dimensions.
- Introduced possibility to simulate temperature change in the system.
Methods
Section 9.1 of Giordano and Nakanishi’s Computational Physics was our primary reference for this project. We used MATLAB for the simulations, dividing our code into several functions (subroutines) instead of using one script. The codes and their purposes are outlined below.
TheInitiator.m
This function initializes an evenly spaced grid in 3-D space (2-D in the old version of the program). This grid serves as the basis for the location of each atom, because we want the atoms to start at roughly the same location for each simulation. Two further steps are taken to make sure the simulations are not fully deterministic: each atom was displaced slightly from a point on this evenly spaced grid, and it was given a random velocity (within some limits) in each dimension. This function also allows an option to have different limits of the initial random velocity which can produce an effect similar to starting with gas particles with different temperature.
TheEnforcer.m
This function calculates the force on each atom due to every other atom, based on the Lennard-Jones potential, which is ineffective at large distances, attractive at moderate distances, and repulsive at very short distances. This calculation takes exponentially longer for additional particles, because each particle interacts with each other particle.
TheUpdater.m
This function uses the forces from the previous function and each particle’s positions to calculate each particle’s position and velocity at the next time step. It feeds these positions back into TheEnforcer.m and iterates until the positions and velocities of each particle for each time step are calculated. This function also enforces the periodic boundary conditions (that a particle leaving one side of the “box” comes back through the other side, with its velocity unaffected). Particles that are closer to each other through these boundary conditions than they appear must interact as though they were at this close distance. To clarify this, consider a one-dimensional system, ranging from x=0 to x=10. Two particles at x=1 and x=9 should interact as if they are 2 units apart, not 8 units apart. Implementing this system properly was one of the most difficult tasks we faced.
SpeedDist.m
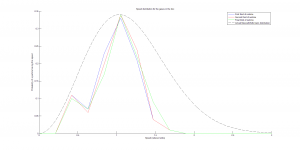
This function takes in each velocity component of each particle at each time step, and first calculates a speed for each particle at each time step. It plots three speed distribution curves by averaging each particle’s speed over each third of the runtime, placing these speeds into bins, and plotting a histogram that is visualized as a curve. The function is configurable to plot any integer D speed distribution curves by averaging each particle’s speed over each 1/D of the runtime instead, but D = 3 effectively showed that the system had reached equilibrium (signified by when two successive speed distribution curves are fairly similar).
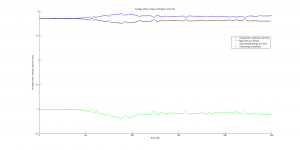
This function also plots the kinetic, potential, and total energy averaged for all particles at each time step in the simulation. The kinetic energy was needed to calculate temperature, since the product of Boltzmann’s constant and the system’s temperature is equal to the average kinetic energy of all particles in the system.
MainBody.m
This script simply initializes the spatial dimensions of the system and how many atoms will be simulated. This is the code that is directly run by the user to visualize the simulation and look at the speed distributions and energies.
All of these MATLAB files can be found in this Google Drive folder.
Results
We succeeded in producing visualizations of the Argon atoms in two and three dimensions. Even with 100 atoms, the script does not take more than thirty seconds to run, so more particles could feasibly be simulated. Additionally, our speed distributions matched up relatively well with the actual Maxwell-Boltzmann distributions in terms of horizontal location (this shows that our determination of temperature was accurate, since this is what affects the horizontal position of the peak (most common particle speed). However, our generated speed distributions were more narrow than the Maxwell-Boltzmann distribution. It is possible that they could be widened by decreasing the density of the atoms (simulating fewer particles or making the dimensions of the “box” bigger). It is also possible that increasing the maximum initial velocity would increase the width of the speed distribution, since it would give each particle a wider range of initial velocities to have.
We were mostly satisfied with our energy plots; they showed a fairly constant total energy, which we expect (it is not completely constant because the total energy is calculated from averages of kinetic and potential energy of all particles). Kinetic and potential energies became steady as the system reached equilibrium, which takes longer for lower gas densities.
One example of a speed distribution plot (click for full-size):
One example of an energy plot (click for full-size):

Conclusion and Future Potential
Based on the Boltzmann’s distribution plots of our data, we are fairly confident that our simulation is useful at approximating systems of gas molecules. The fact that the total energy of the system remains around a fixed value is also promising. However, the fluctuations in the total energy when the particles start interacting is still not ideal.
One limitation of our problem would be that the system destabilizes when the initial density of our gas molecules are very high. This is a direct result of the steep increase in the Lennard-Jones potential at low distances between particles.
We want our readers to see this code as a work in progress rather than a complete program. The program still has a lot of unrealized potential. For example, the energy graph produced by the simulation for cases with different initial velocity limits could potentially be used to calculate time taken by a system with gases of different temperature to equilibrate. Similarly, with some changes to the initiator and the enforcer function, the program could also be used to simulate a collection of different gases as opposed to a single type of gas molecule. Although we were unable to simulate it, increasing the density and lowering the initial velocity should also make it possible for future users to simulate materials in solid and liquid phases. Since the program already has method to change temperature built into it, some changes could be made to make these temperature changes periodic. This could potentially be used to simulate a laser beam heating the gas particles.
Overall, we are very satisfied with the progress we were able to make throughout the semester. Apart from learning a great deal about different physical concepts, we also developed a deeper appreciation and knowledge of computational approaches towards studying physical systems. We also think that we have developed a fair understanding of the limitations and the potential of the computational tools available to us, and we are confident that this project has prepared us for many more simulations that we are likely to encounter in our careers as physicists.


