
Introduction
As a fairly precise branch of physics, as well as one of the oldest, there are many problems in celestial mechanics for which an analytical solution is well known. Still, some problems exist for which an analytical solution is either very difficult or impossible to obtain. For the former, a computational analysis serves to verify analytical theory; for the latter, simulation may be the best way of understanding a problem other than with direct observation. The goal of this project is to examine two celestial mechanics problems with a computational model: the precession of the perihelion of Mercury and Kirkwood Gaps.
Precession of Perihelion
For centuries astronomies had a prediction of Mercury’s orbit from Kepler’s laws which measurably differed from observational values. What astronomers found was that Mercury mostly obeyed Newton’s inverse square law for its motion, but deviated because the orientation of the orbit’s axes was rotating over time. This is referred to as the precession of the perihelion, because the perihelion (the point in the orbit at which Mercury is closest to the Sun) lies along the semimajor axes. The source of the deviation from theory was a mystery until Albert Einstein released his paper on general relativity in 1915, in which he claimed his new theory explained the precession of the perihelion of Mercury due to the relativistic gravitational effects from the other planets (particularly Jupiter). Einstein’s adjustment to the inverse square force law is as follows:
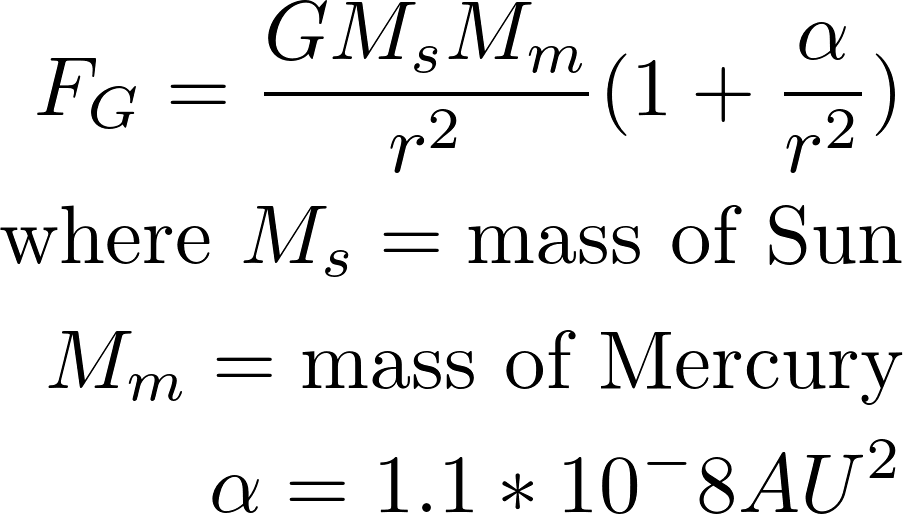
The value for alpha shown above is the value calculated from general relativity; for this simulation, a much larger value of alpha is used so that the simulation doesn’t have to run as long to show precession. The value used in the main code of this program is .0008.
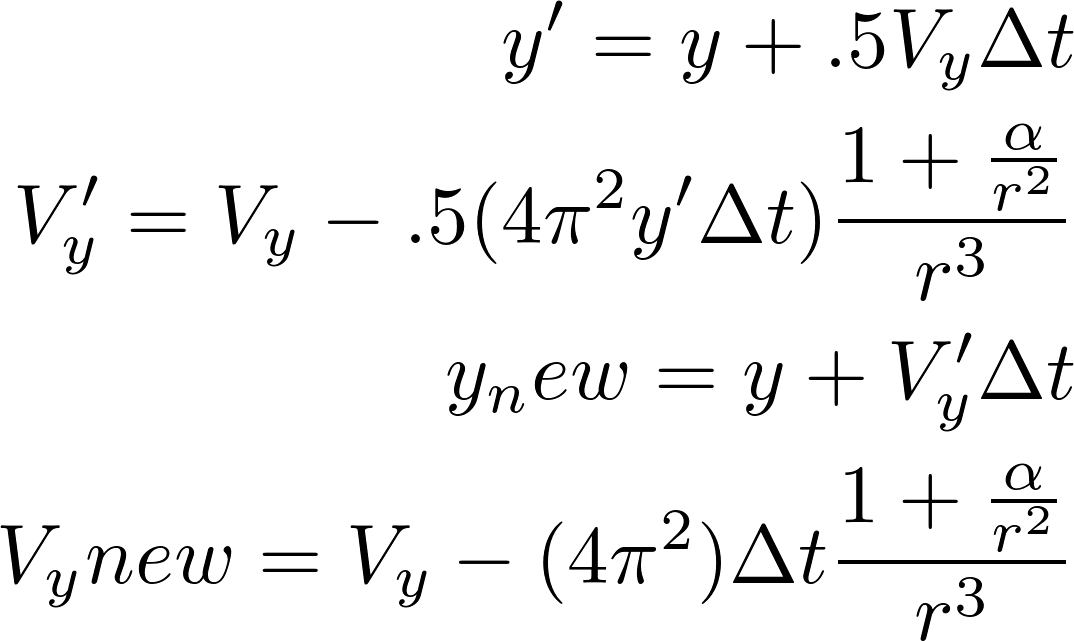
We then use the force law to calculate the velocity and position of Mercury. The derivation for the position and velocity with respect to x is as follows:
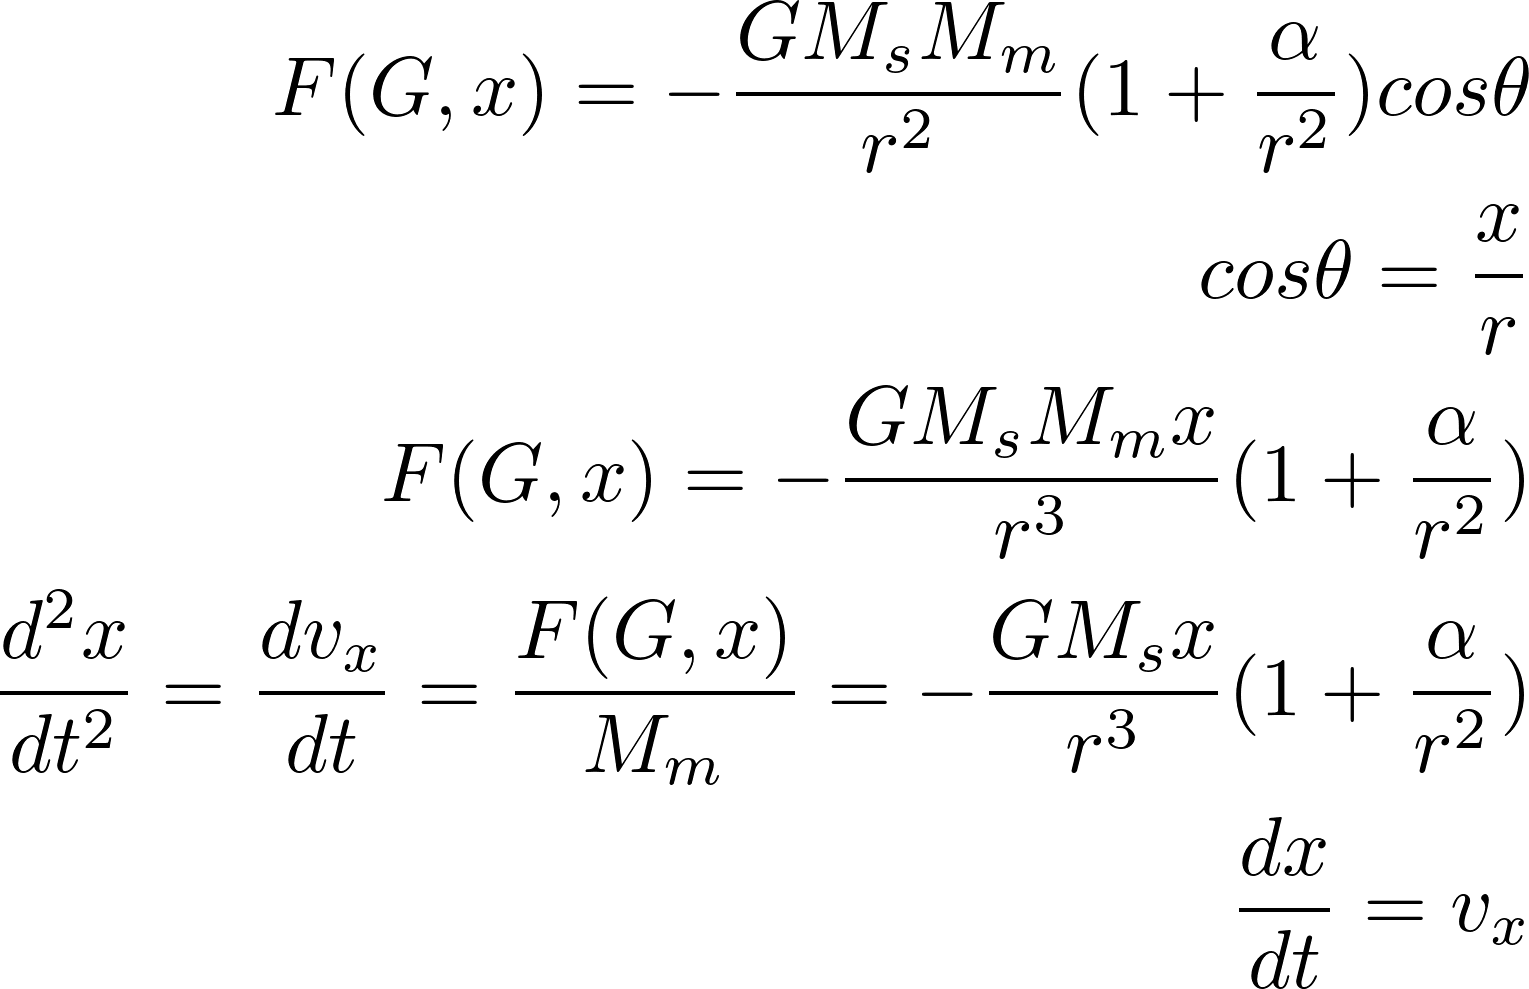
The derivation is virtually identical with respect to y. We then use these differential equations to create a computational algorithm; I chose to use the Runge-Kutta method because I felt that updating the values within the orbit computation loop would lead to a more accurate simulation.
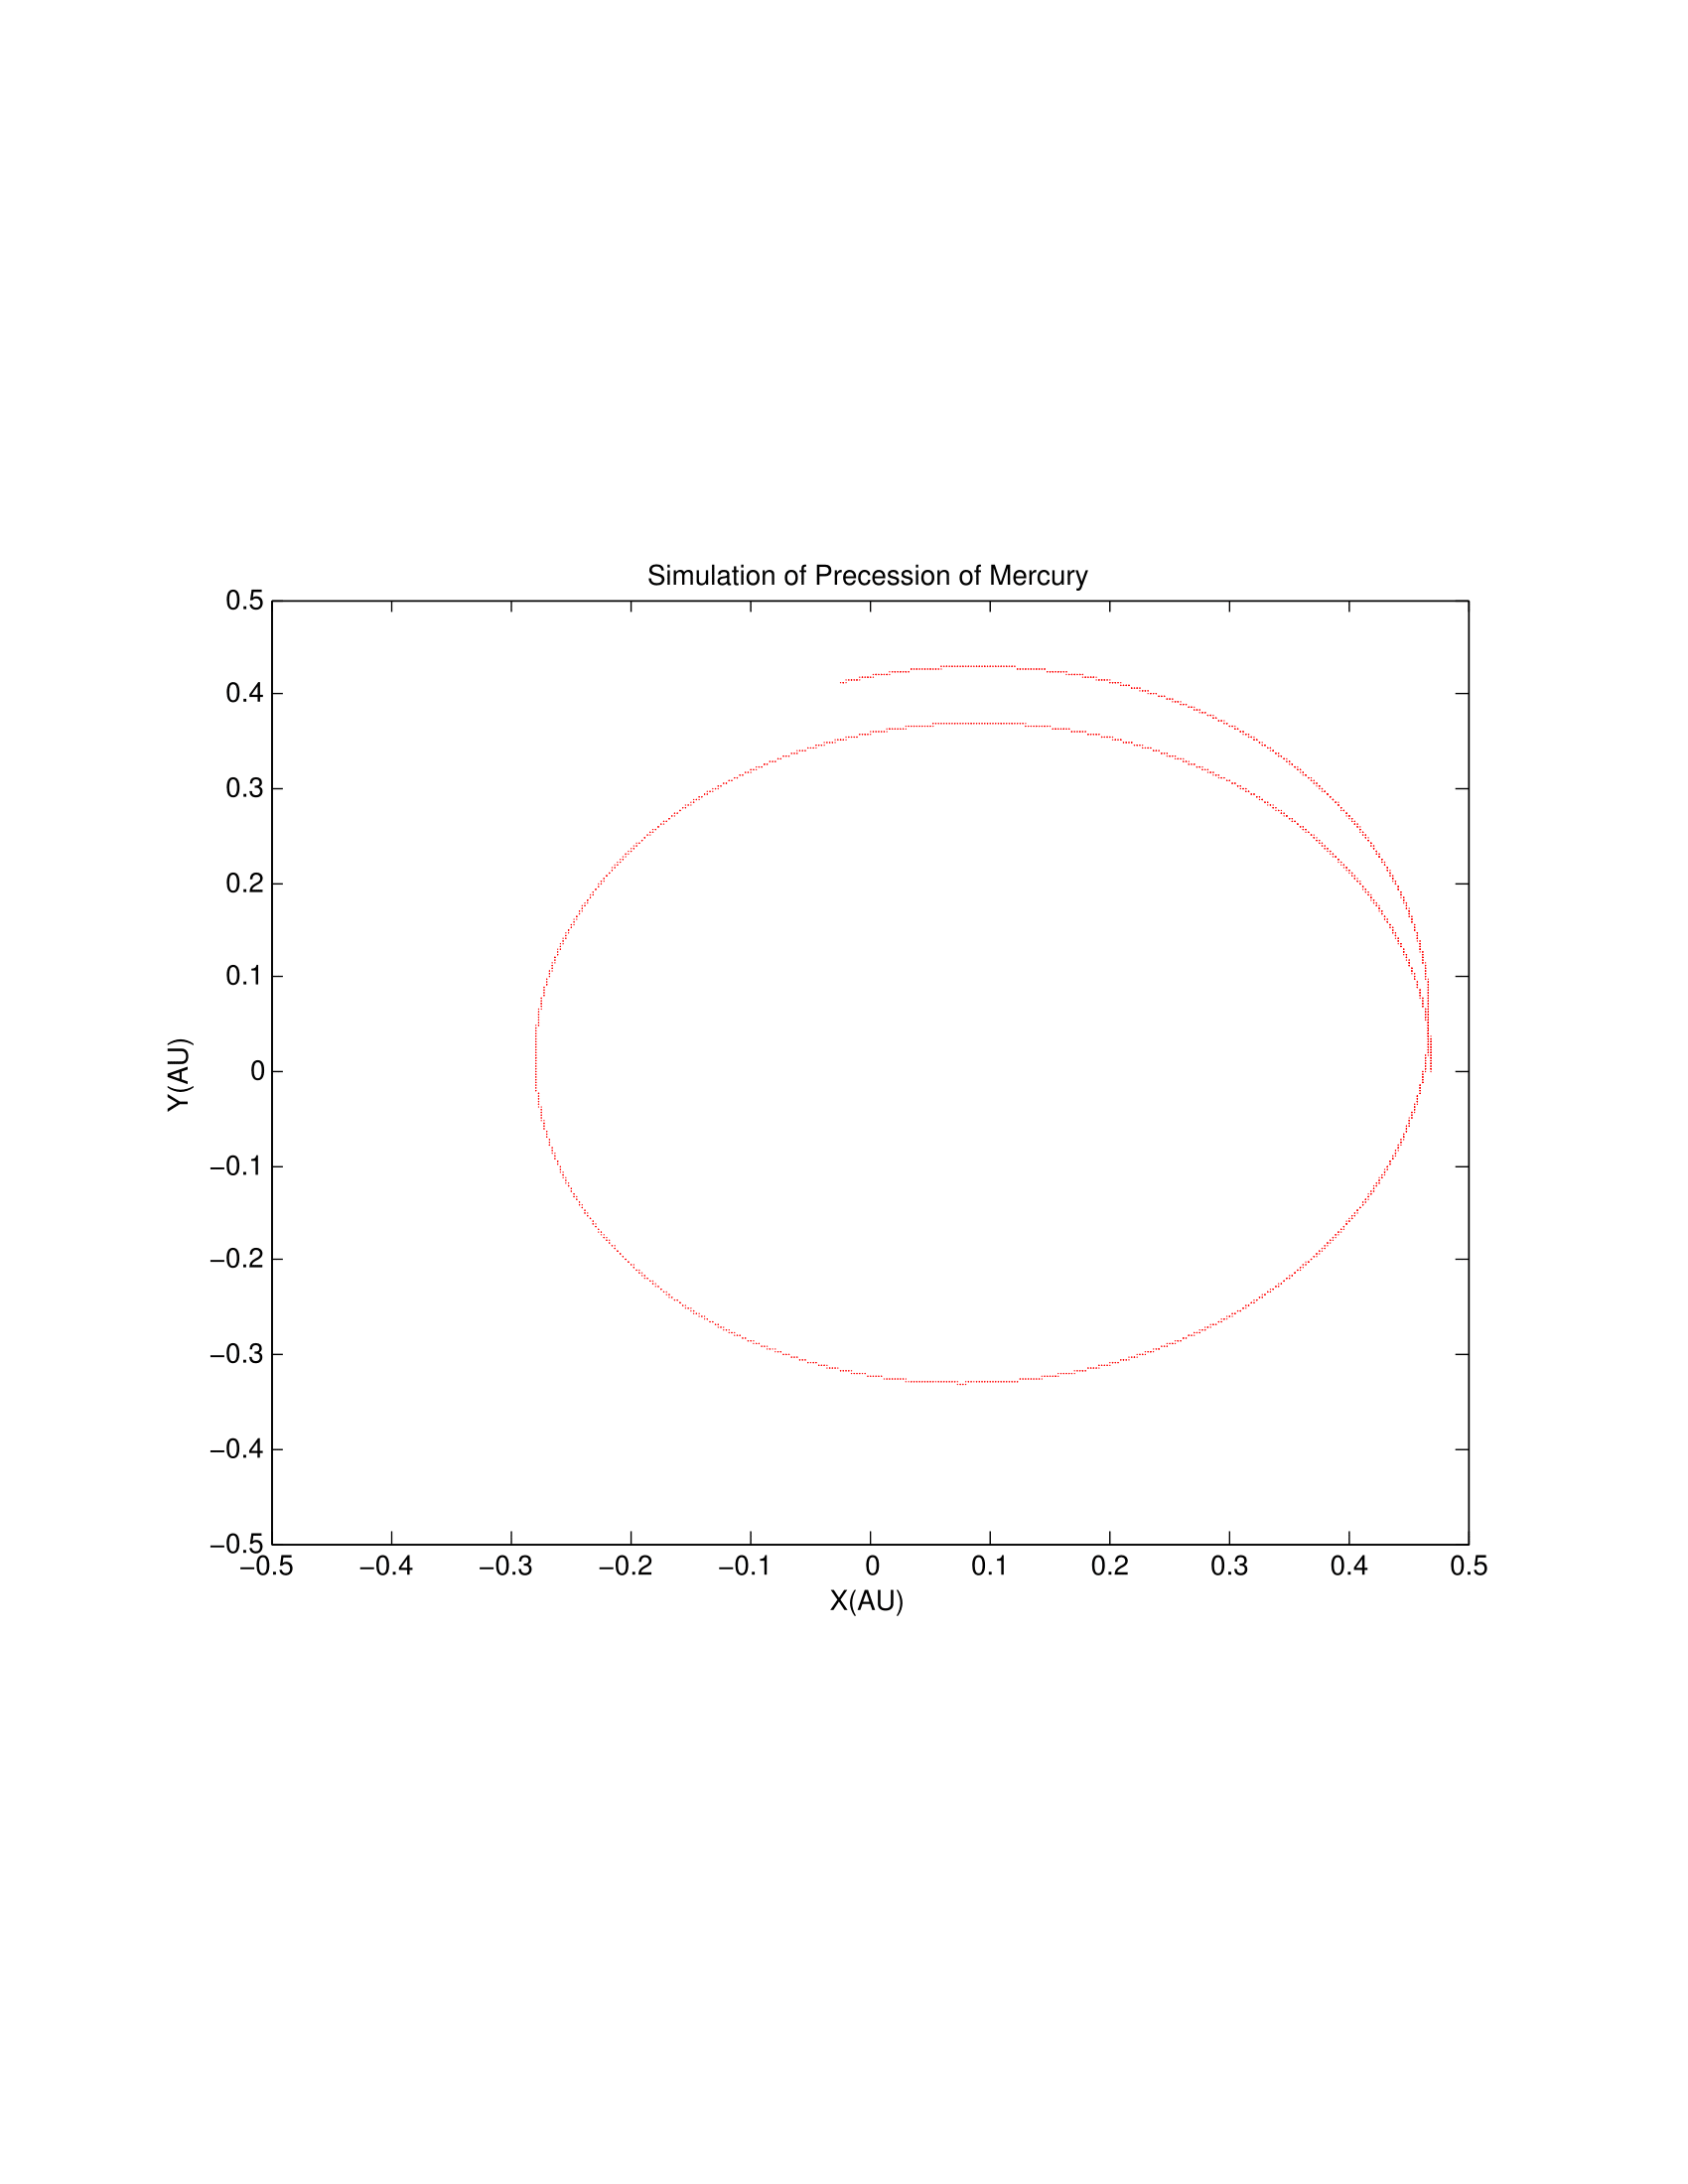
A representative graph is also included to show how the orbit changes over time.
Now that we have a code for the movement of Mercury, the next step is to find where the perihelions of each orbit lie. I did so by first conceptualizing what happens at the perihelions. Because the perihelions are the most rounded parts of Mercury’s orbit, the change in the distance from the Sun will be very small or slightly negative as Mercury moves closer to the Sun. Using this knowledge, I then find the position at these points and convert it to an angle. Angle is then graphed against time to show how the perihelion precesses over time.
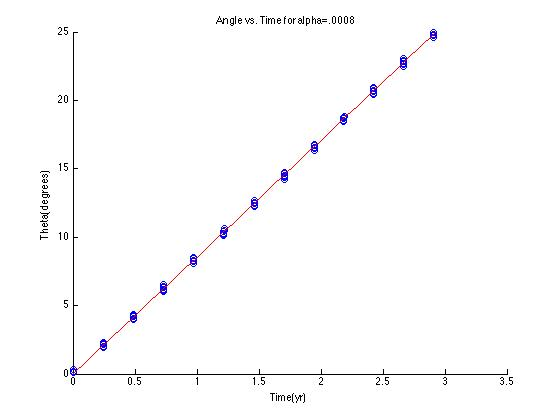
The goal of this graph is to find the fit slope of our angles so as to compare our computed precession rate to the analytical precession rate per unit alpha, 1.1 * 10^4 degrees per year per unit alpha. Using this value, we should be able to multiply it by the value of alpha predicted from general relativity to find a precession rate of about 1.2 * 10^4 degrees per year, or 43 arcseconds per century.
Continuing the program, I ran the precession simulation for values of alpha from .0001 to .004. I then created arrays to hold these alphas and their corresponding precession rates per alpha and plotted both with a fit line. The slope of this graph multiplied by alpha from general relativity is compared to the analytical values.
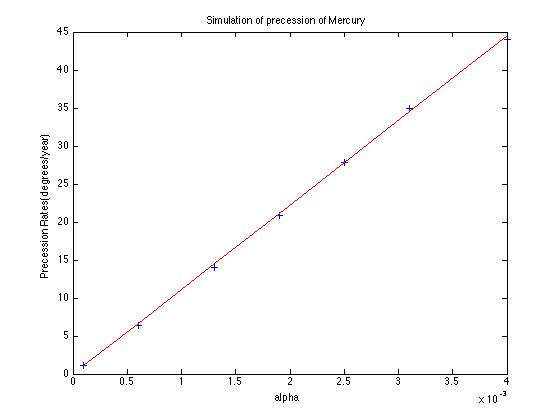
The slope calculated from the angle vs. time graph was 8.4516 with an r value of .749. Therefore the precession rate per alpha here, calculated by slope/alpha, is 1.067*10^4 degrees/year/unit alpha, which compared to the analytical value is a relative error of 2.9%. This precession rate per alpha is then calculated again in the slope of the second graph, which comes out to 1.1139*10^4 degrees/year/unit alpha, a relative error of 1.9%. Multiplying by Einstein’s alpha, we find a precession rate of 1.2253*10^-4 degrees/year or 44.11 arcseconds/century, with relative errors of 2.1% and 2.6% respectively.
Kirkwood Gaps
When astronomer Daniel Kirkwood plotted the number of known asteroids against their orbital radii, he found significant “gaps” of asteroids- orbital radii at which few or no asteroids were found to exist. Eventually he discovered that these orbital radii were in resonance with Jupiter, the largest planet and, as seen by the precession of the perihelion of Mercury, therefore the most likely to perturb the orbits of other objects in the solar system. This resonance is a ratio of the orbital periods for two objects rotating around the same central body of mass, and is related to the orbital radii of the object. So in this example this project, the orbital period of an asteroid located at the 2/1 resonance point with Jupiter will be one half that of Jupiter’s, so it will complete two orbits for every one Jupiter completes. The relation between orbital period and orbital radii is given by Kepler’s Third Law:
where P is orbital period and a is orbital radius; this proportion holds for all objects orbiting the Sun. Knowing that Jupiter’s orbital radius is 5.2 AU, we can calculate the position of asteroids at resonance points by this ratio; i.e. at the 2/1 resonance, the orbital radius is 3.27 AU, 2.5 AU at the 3/1 point, and so on. We can also use the calculated radius to find the initial velocity by the equation for orbital speed:
The reason why Jupiter perturbs the asteroids so much at these radii is due to resonance- because the object in resonance is closest to Jupiter at the same several points in its orbit (for example, twice in the orbit of the 2/1 resonance), the perturbations from Jupiter will be largest only here and cause highly erratic orbits over time. The same phenomenon doesn’t happen at other radii because Jupiter’s perturbations occur at random points on the asteroid’s orbit and altogether cancel each other out over time.
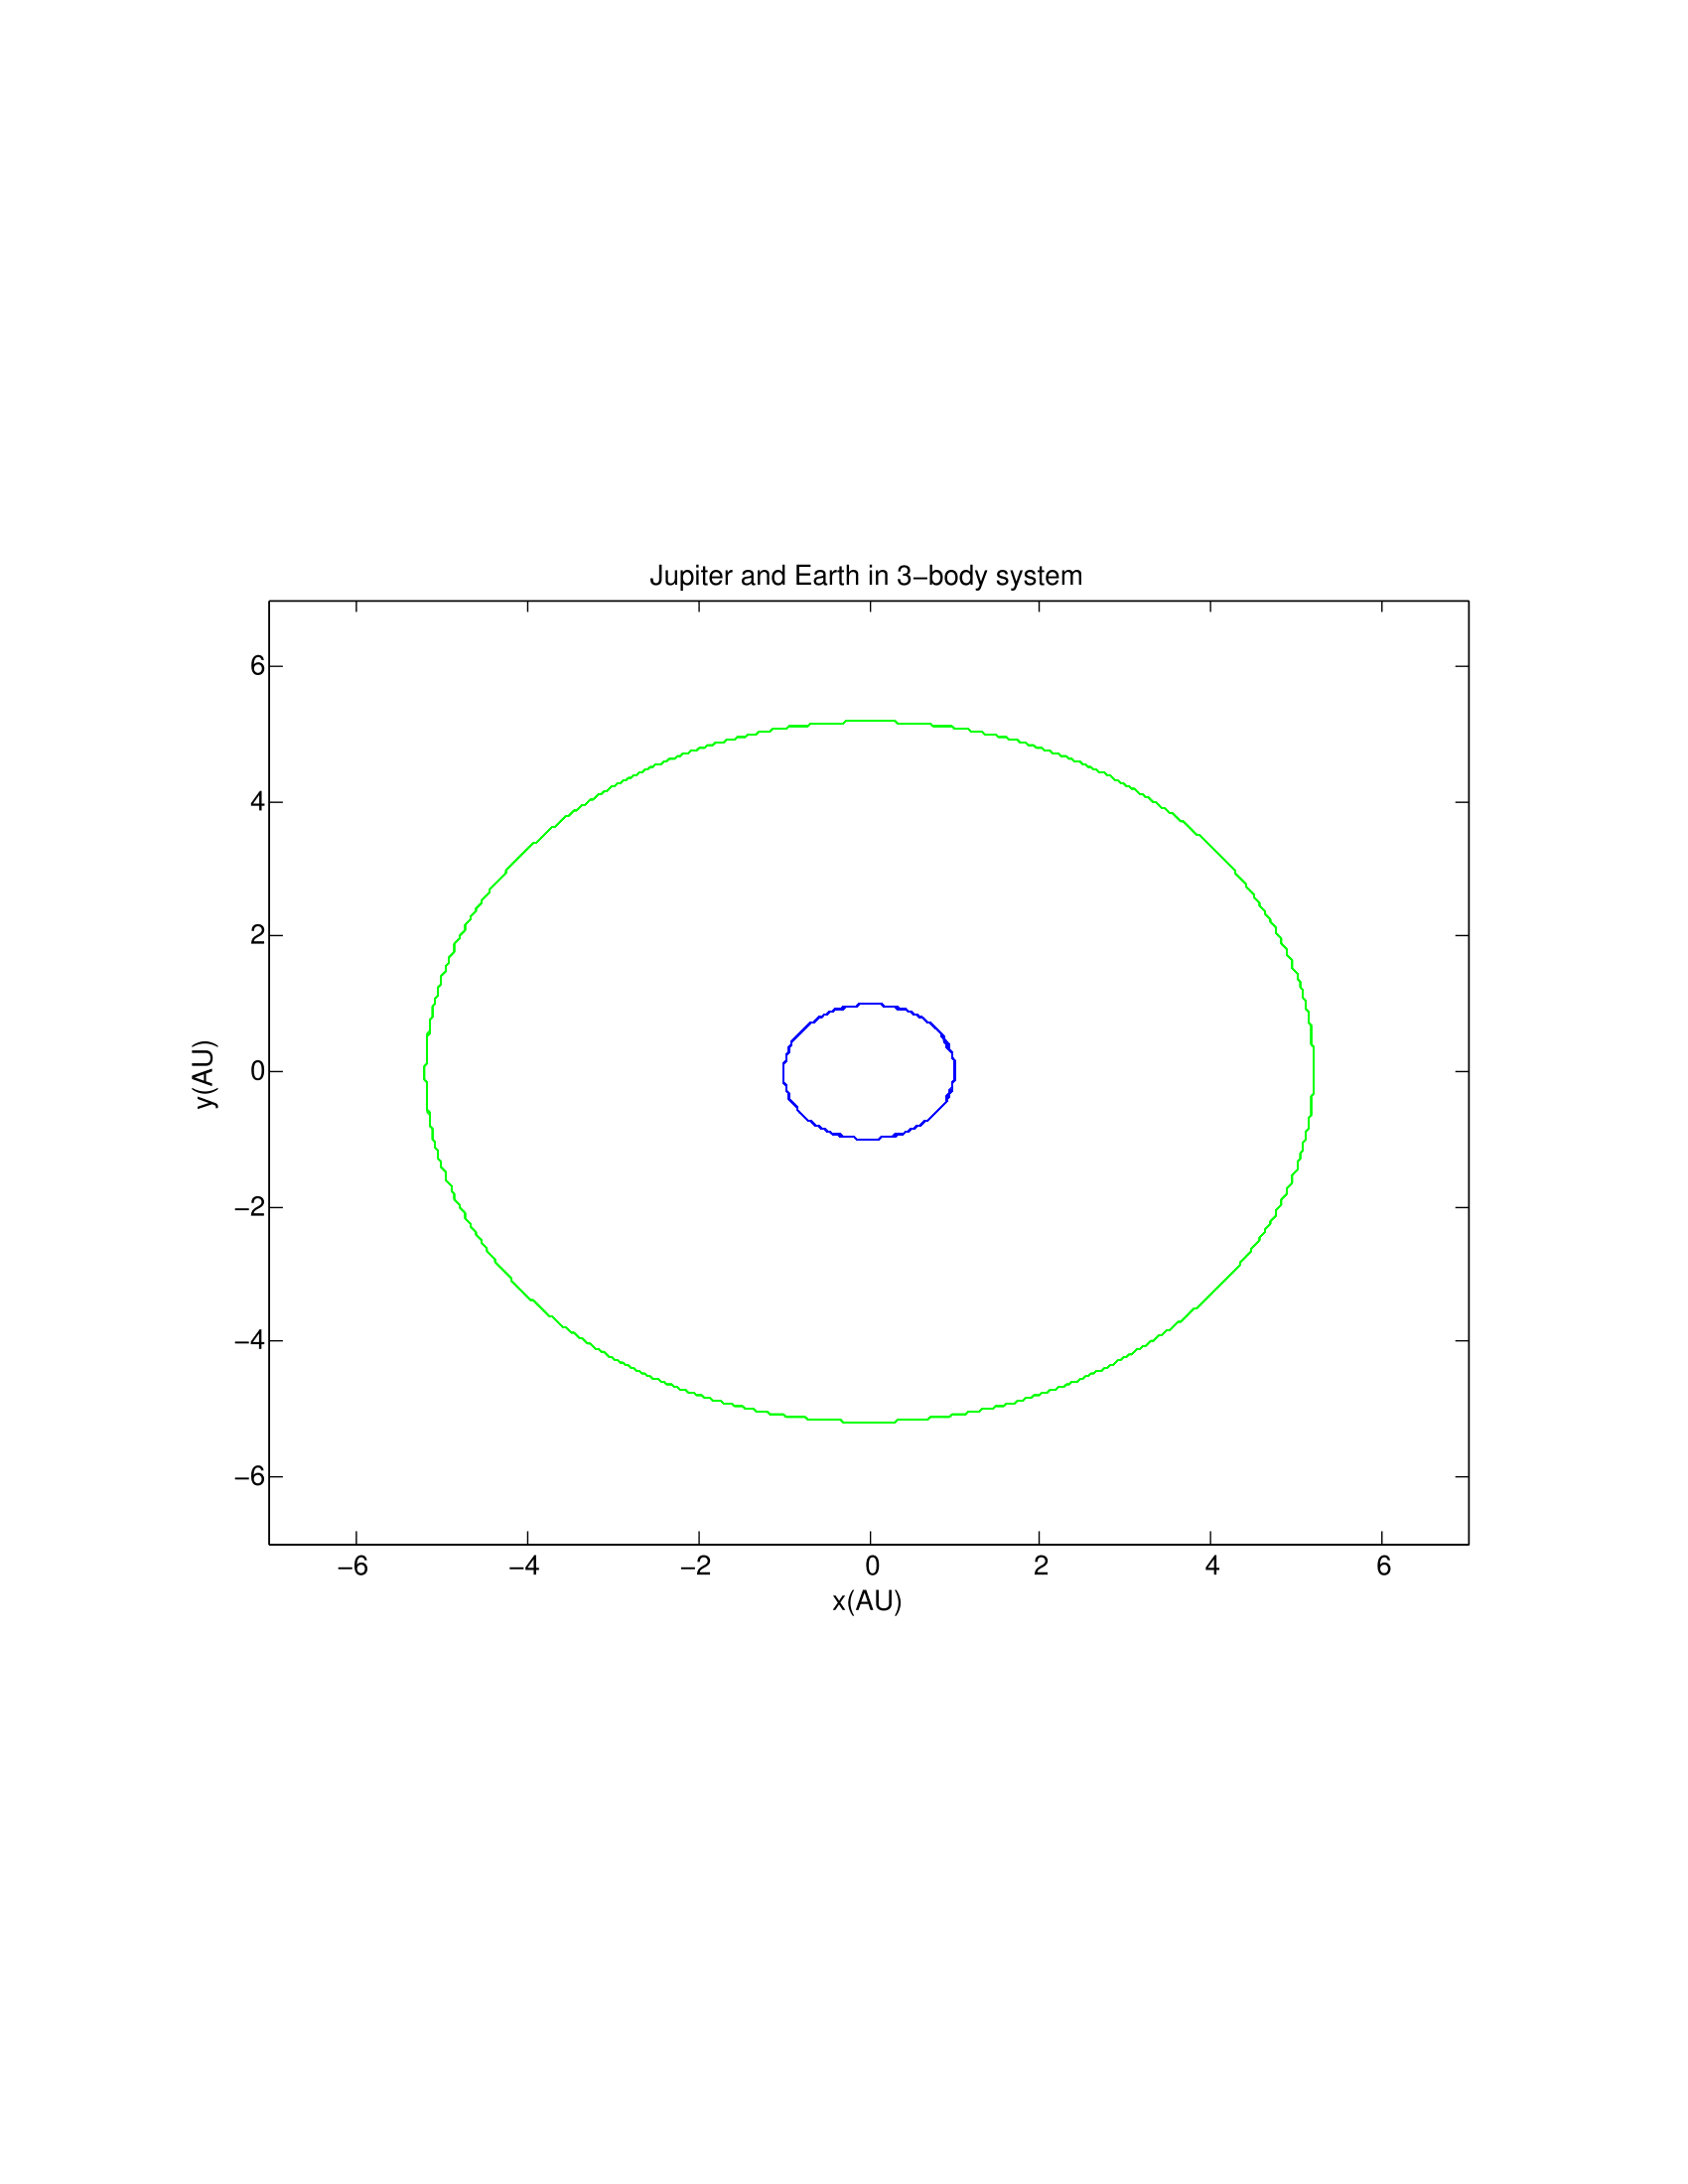
My code begins with the 3-body system as described on page 115 of Giordano and Nakanishi using the Euler-Cromer method. First I tested my code to demonstrate it worked without adding any asteroids:
Then I added asteroids at and around the 2/1 resonance point. Normally when adding more bodies to such a system, the new bodies interact with and change the orbits of the original objects, but because the mass of the asteroids is negligible as compared to all 3 objects already in the system (the Sun, Earth, and Jupiter), this effect can be ignored. The highly erratic 2/1 resonance is shown in blue:
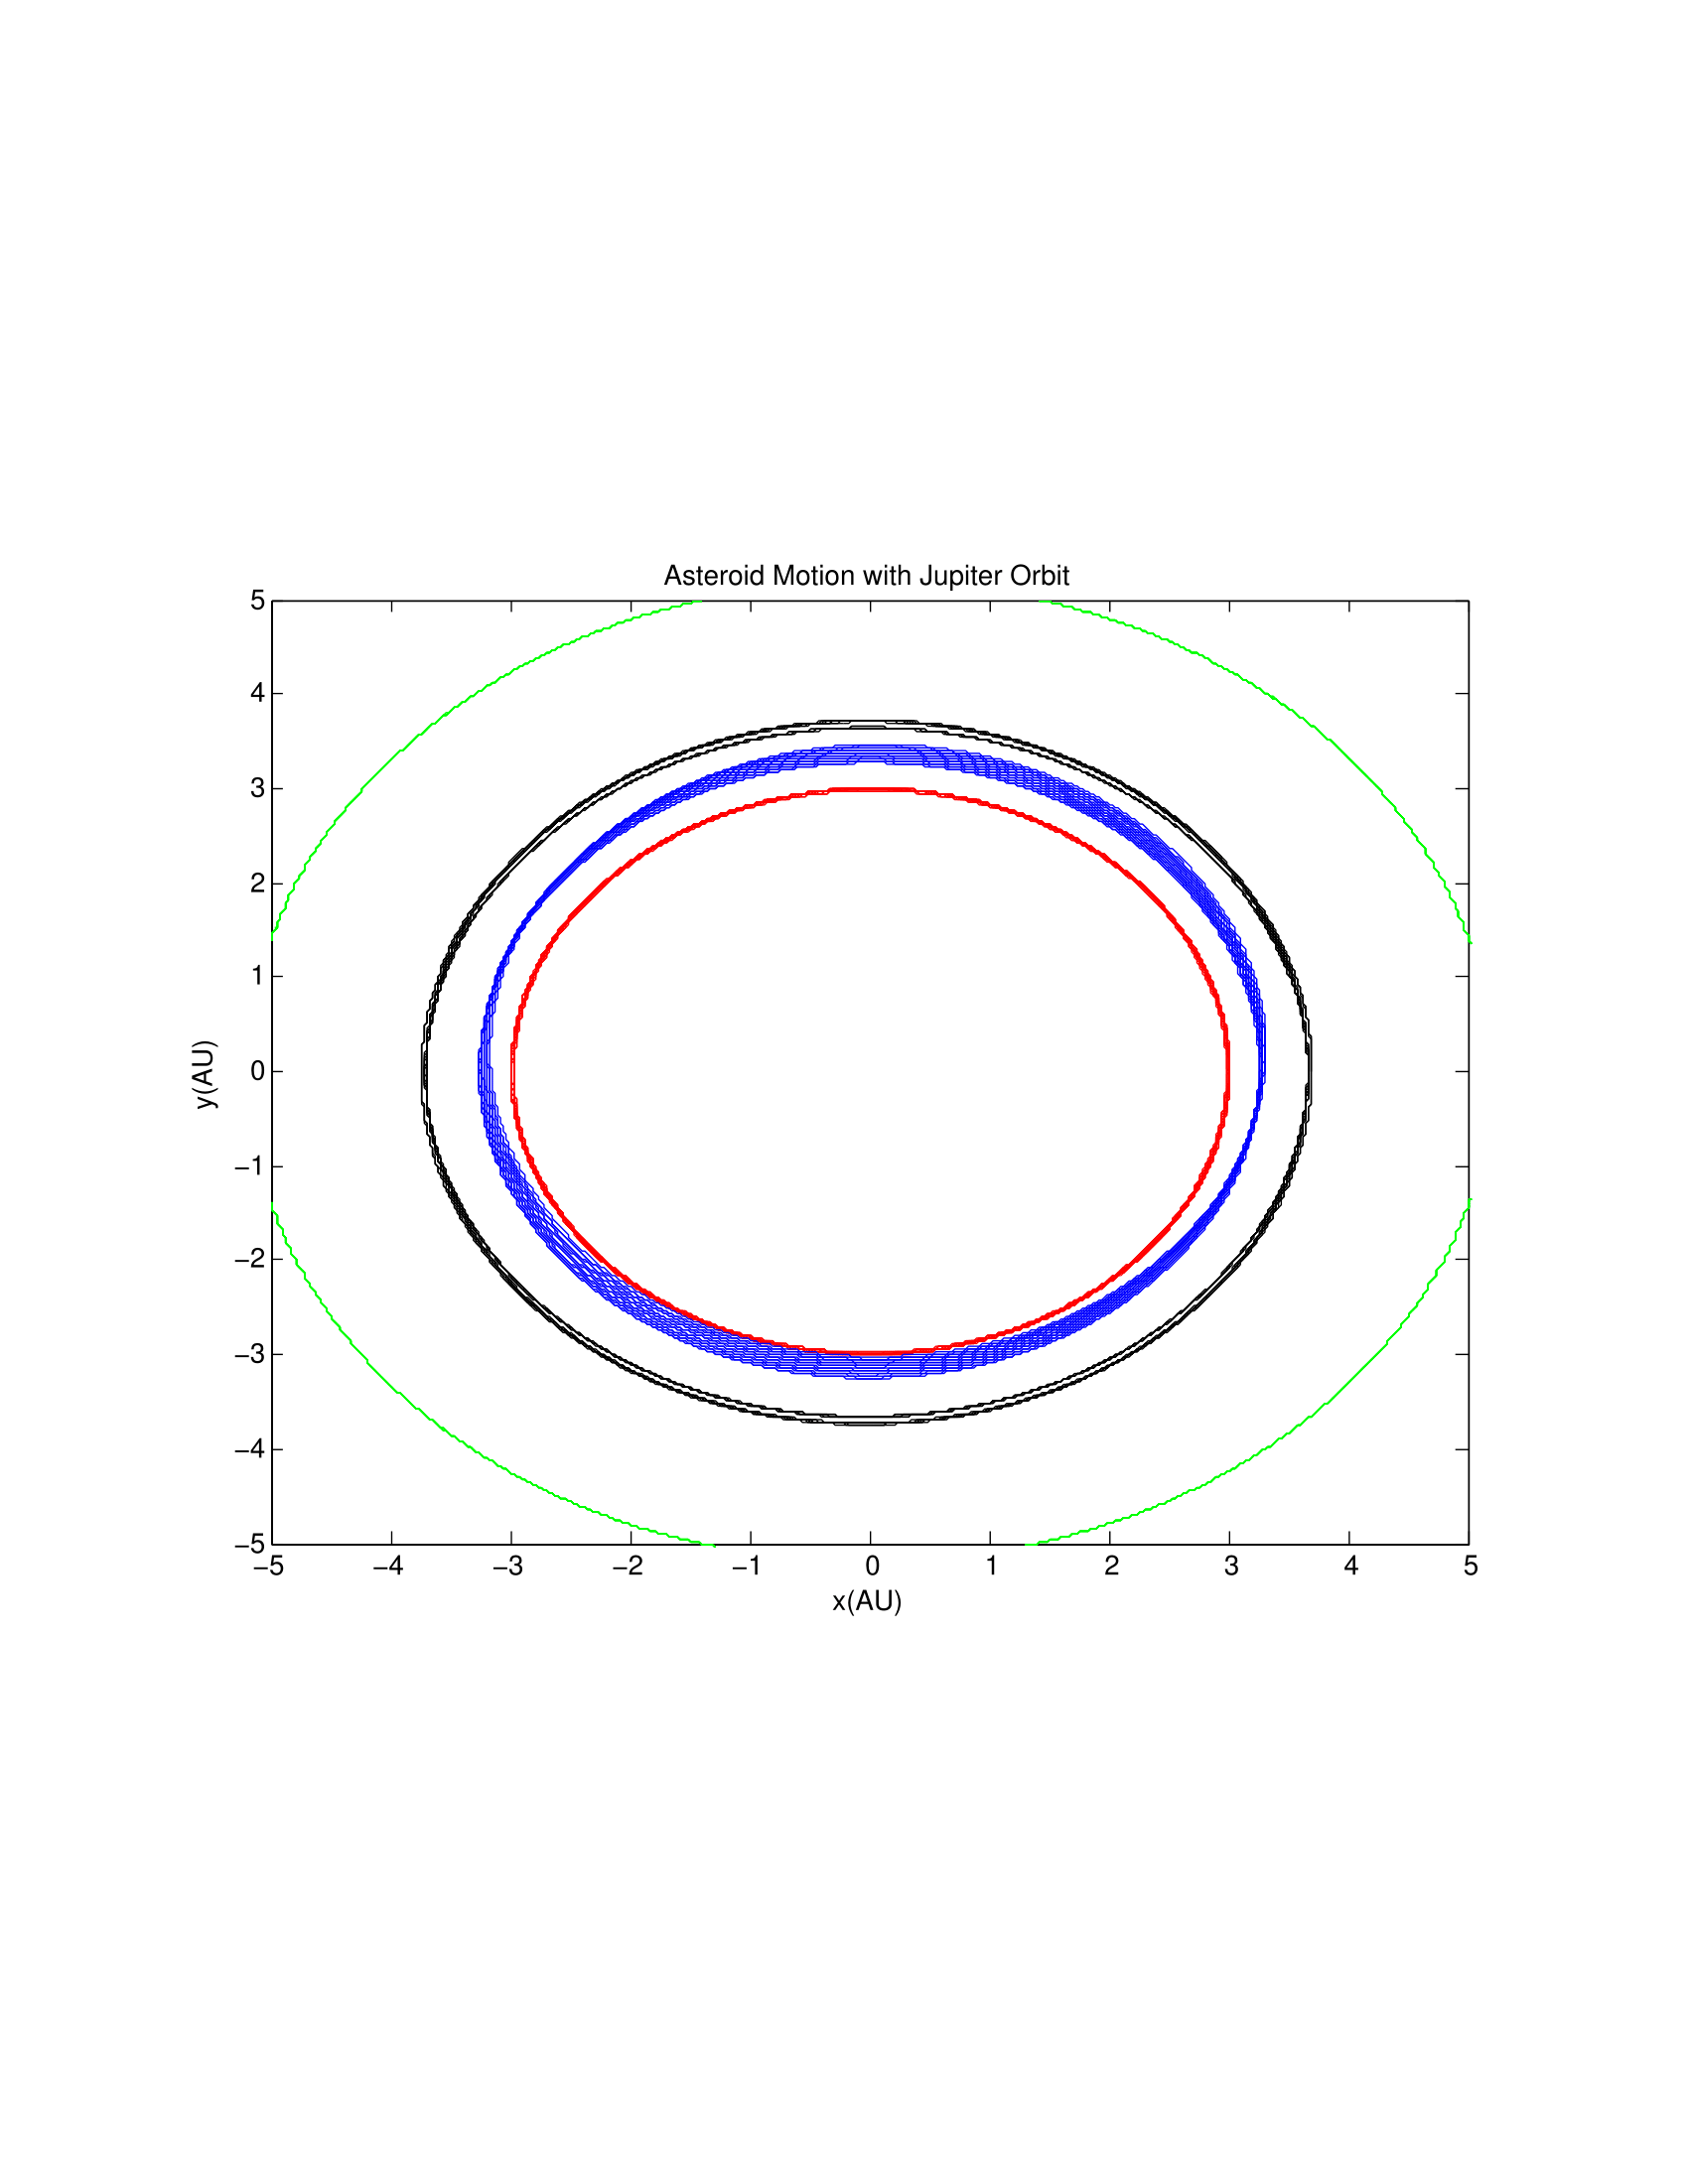
The other two asteroids demonstrate how little Jupiter perturbs their orbits. I then added asteroids at the 3/1, 7/3, and 5/2 resonance points, but found a very different effect:
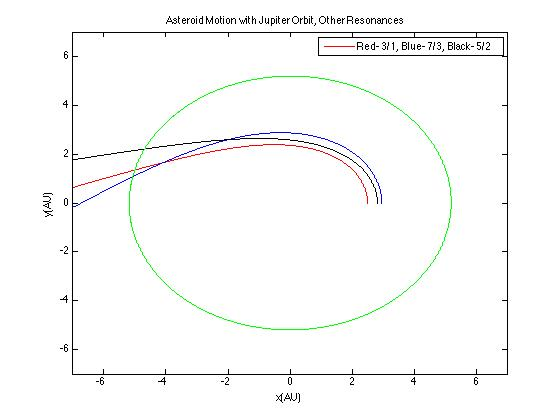
I originally thought that this was an error in the simulation, most likely caused by too many objects in the system, but I am now confident this is an accurate approximation of the involved physics; the explanation is in the following section.
Conclusion
Because the precession rate of Mercury has already been found analytically, it hardly comes as a surprise that the computational solution closely matches both theory and observation. The small relative errors compared to the analytical values shows the program is successful. While figuring out how to find the perihelion as it rotates was difficult, the rest of the program is straightforward because it follows from the known force equations. The program also demonstrates how known physical values can be altered to make computation easier, such as using a much larger alpha than in reality so as to speed up the calculation. While it might be more physically realistic to calculate the precession rate using a system with more massive bodies, at least including the largest perturber Jupiter, the calculated values are good enough to conclude the current simulation is sufficient in verisimilitude.
The program for the Kirkwood Gaps demonstrates how one very particular physical property, resonance, can have a very large effect when massive bodies are concerned. The first asteroid graph demonstrates this quite effectively, as the asteroid found in the 2/1 gap is perturbed much more than the outermost asteroid which is significantly closer to Jupiter. The graph of the other resonance points demonstrates exactly why it is that the Kirkwood gaps exist: eventually the perturbations from Jupiter become so large that the orbiting object is ejected entirely. The asteroid at the 2/1 resonance point isn’t ejected because it has the lowest frequency of interaction with Jupiter. At the other resonance points, Jupiter perturbs its orbit enough to eject it, because of the higher rate of encounter- the asteroid at the 3/1 resonance point is effected by Jupiter one more time than the 2/1 asteroid per orbit, a difference which has significant consequences over time. This program serves as a successful example of how a computational simulation can lead to greater understanding of the underlying physics even when an exact answer isn’t possible or even necessary. It is also worth noting that a phenomenon similar to Kirkwood gaps occurs with the rings of planets; for a real-life example, the rings of Saturn have gaps in them because the gaps are in resonance with one of Saturn’s moons.
Code:
https://drivenotepad.appspot.com/app?state=%7B%22ids%22:%5B%220B0gZLI_X8KZXWkxEbHVEVHlLbjQ%22%5D,%22action%22:%22open%22,%22userId%22:%22116986450796621489073%22%7D
https://drivenotepad.appspot.com/app?state=%7B%22ids%22:%5B%220B0gZLI_X8KZXSHNTaWlLQkhfZE0%22%5D,%22action%22:%22open%22,%22userId%22:%22116986450796621489073%22%7D
https://drivenotepad.appspot.com/app?state=%7B%22ids%22:%5B%220B0gZLI_X8KZXWlV3aDZFQThhaFk%22%5D,%22action%22:%22open%22,%22userId%22:%22116986450796621489073%22%7D

Matt,
I like how you solved the problem of Mercury’s Precession as caused by the Sun. Your errors are much smaller than mine, though I’m not entirely sure if you should be counting the theta “guesses” you make in your code as part of your error. (Just because there appear to be multiple “guesses” for each point of perihelion, and the spread could be thought of as a sort of “error bar”.)
Unless I’m mistaken, the positions xa1, ya1, xa2, ya2, xa3, and ya3 in lines 191-196 of your Kirkwood gap code should be replaced by xa4, ya4, xa5, ya5, xa6, and ya6. When I made these changes the 7/3, 5/2, and 3/1 became more stable (the asteroids were no longer ejected from the system, but still experienced a visible perturbation). I’m not completely sure if this is more physically sound, but at least that error is there and would be fixed by taking these steps.
Otherwise, I have a few minor suggestions for improvement: some of your code comes in blocks, I would put more spaces in between to break it up and make it more readable to someone who is not familiar with the code. Also, include more legends in your plots: put the r-value on fits make sure all asteroid and planetary bodies are labeled. (Some of your plots had legends, just be more consistent)
Also for your Kirkwood gaps code, I’m fairly certain you could reduce the number of lines significantly by making the asteroid arrays into 6xN arrays for the positions and velocities, instead of calculating each asteroid’s position and velocity separately. Again this is just in the interest of readability.
Where would you take this knowledge if you had to continue from here? In other words, does this project have a future and other applications? Who might use your program?