
Goal:
Our final program takes an acoustic wave signal, strips out all audible frequencies using a Fourier transform, then shifts a range of the ultrasound frequencies into the audible range in order to qualitatively investigate the properties of the audio signal. Our initial goal was to record our own ultrasound frequency signals for analysis, but we were not able to procure a microphone sensitive enough to record ultrasound. Instead we choose an online video claiming to repel rodents by emitting an audio wave with ultrasound frequencies that effect rats (found here: https://www.youtube.com/watch?v=l5x1Bb9UTT0). On first inspection, the signal seemed to only play what resembled white noise, but we needed an accurate representation of the frequencies present in the audio file before making any more assessments. We hypothesized that the video did not contain ultrasound frequencies capable of repelling rodents.
Investigation:
Using the frequency analysis methods we implemented earlier in our project we found that the video actually contained frequencies above 20 kHz. But we were still skeptical because these higher frequencies were about 80% less powerful than the frequencies present in the audible range. This may have been a tactic used to trick the user in believing that high frequency sounds were playing. We wanted to examine what the high frequencies sounded like so we took a 5 second clip from the audio file to scrutinize.
(Please find the 5 second clip here: https://drive.google.com/file/d/0B4quZV7NVNf7YU16blYwcUxXYXc/view?usp=sharing)
We started by removing any audible frequencies from the clip then shifted the ultrasound range into the audible. The resulting sound was again white noise, but at a lower volume.
(No audible frequencies: https://drive.google.com/file/d/0B4quZV7NVNf7clBFTlJIT1I5bzQ/view?usp=sharing , Shifted signal: https://drive.google.com/file/d/0B4quZV7NVNf7amhqVkZ6NjBtUXc/view?usp=sharing)
A qualitative analysis of this new wave does not lead us to believe this video would repel anything. White noise is not an abrasive sound unless played at extremely high volumes, but anything played at a high enough volume can be found abrasive. White noise is generally considered to be the exact opposite and there are white noise generators that are sold on the premise that they are calming and relaxing, and are used to help people focus or sleep. The video we analyzed is not exactly what we would expect in a rat repellent, it seems like this video aims to be more of an aid that would assist in rat mediation.
(code here: https://drive.google.com/file/d/0B4quZV7NVNf7cldUbG5WQUFWTXM/view?usp=sharing)
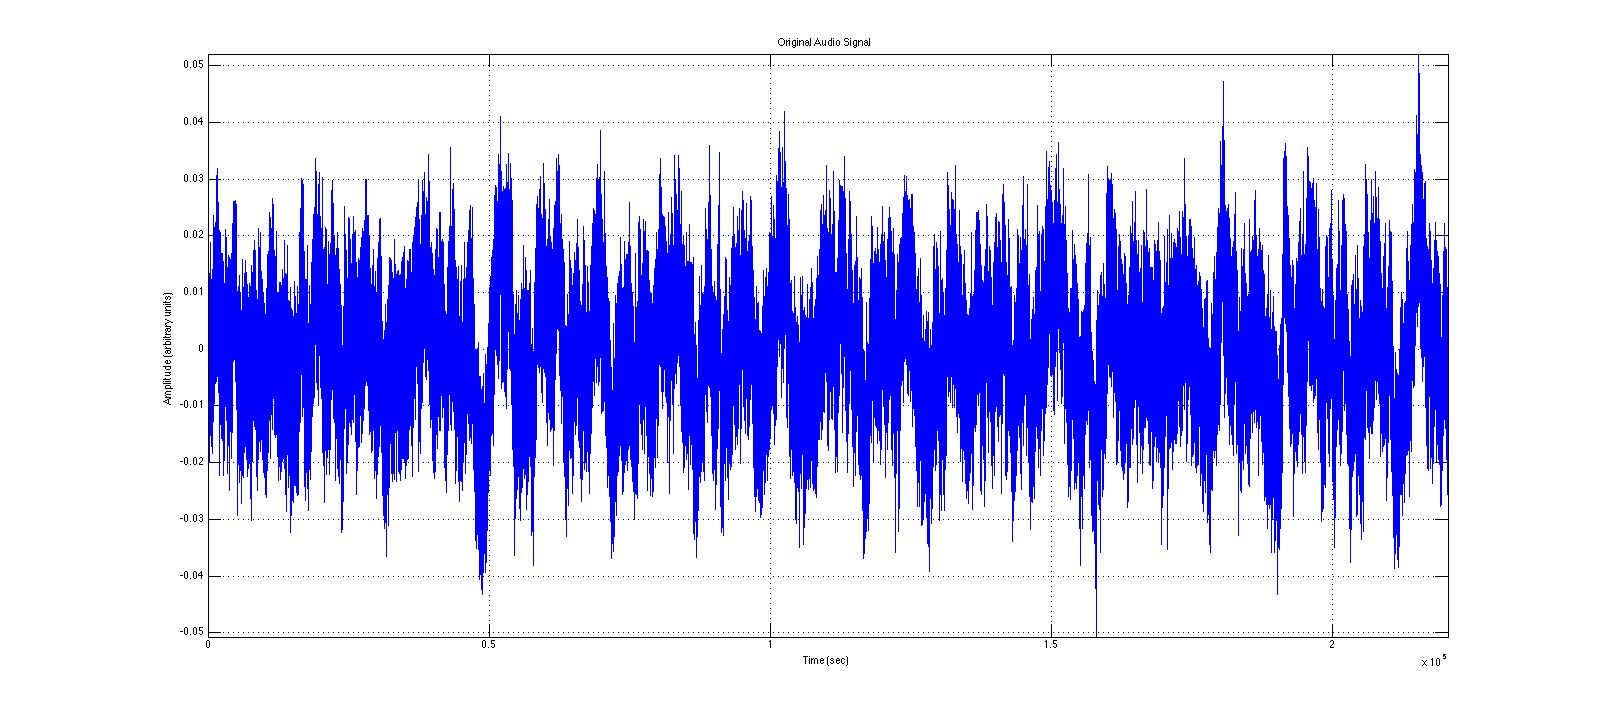
Here is the clip from the original 5 minute video. Notice the amplitude of this signal.
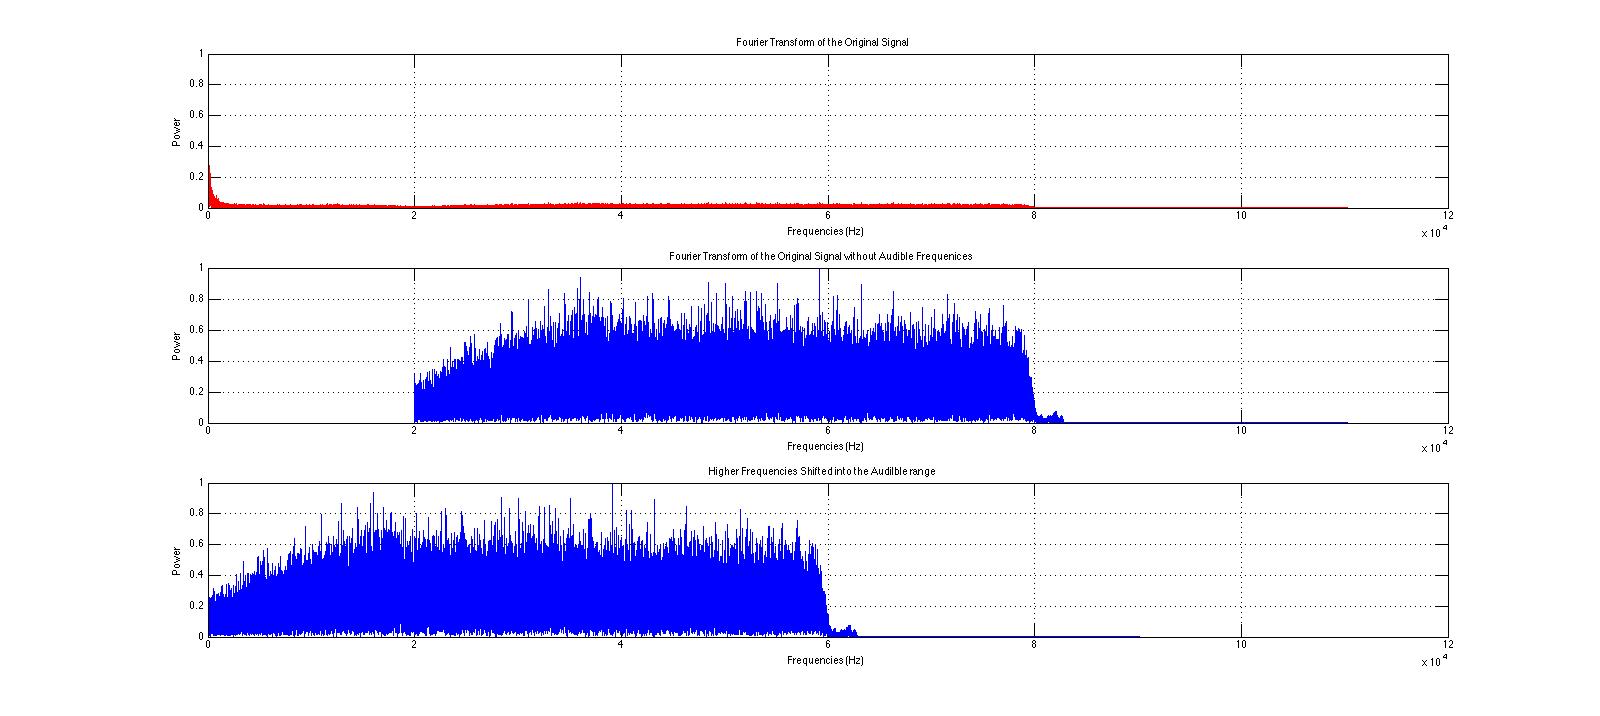
Here are the various operations we performed on the Fourier transform of the clip.

No audible frequencies are present in this new signal. Please note the difference in amplitude in this signal from the original signal.
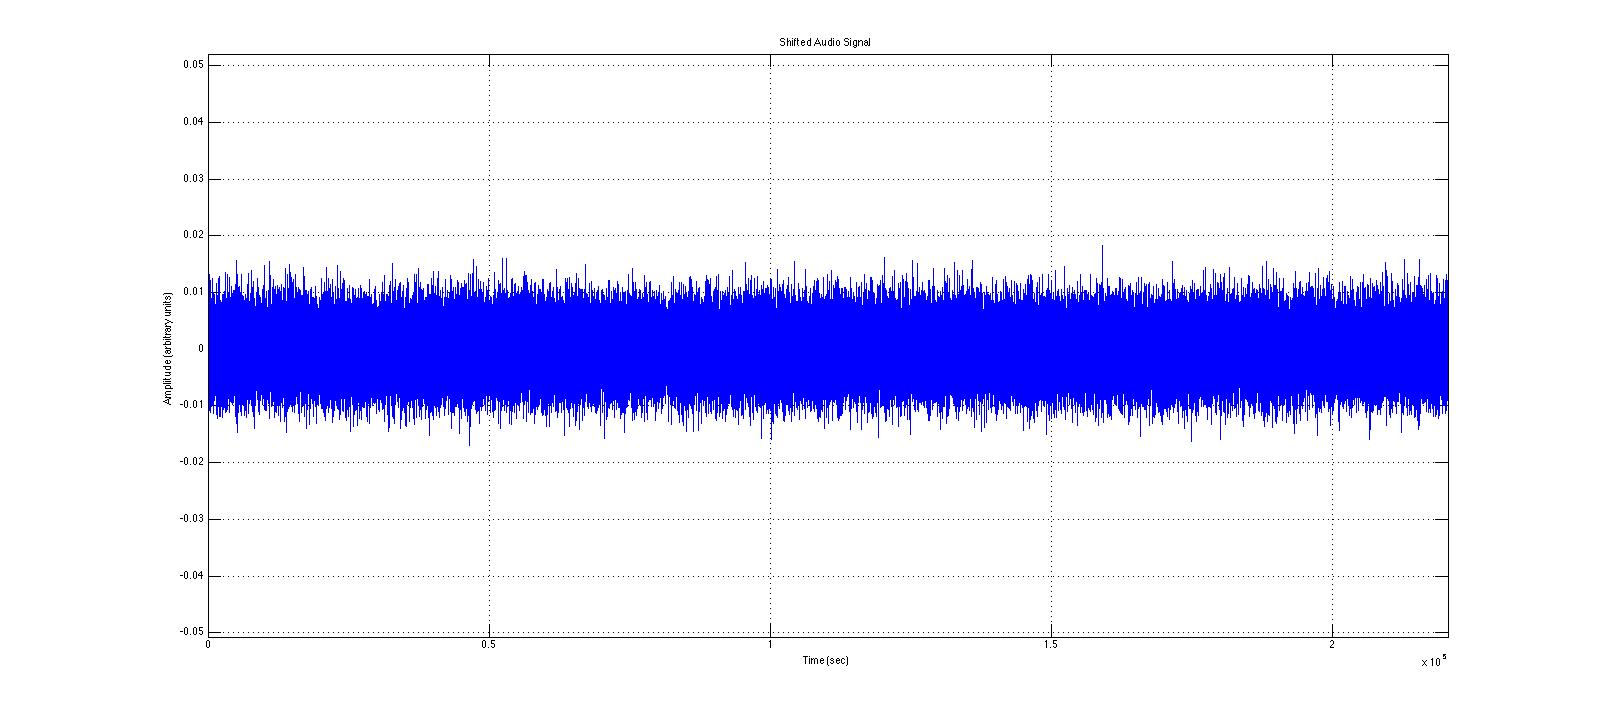
The new, shifted audio signal.
We then decided to make a code to demonstrate what a real rodent repellent signal might sounds like. We start by assuming that sounds that are irritating to humans are also irritating to rodents. A sound that is often considered to be annoying to us is a pair of high frequency sinusoidal waves that are similar in frequency but not identical. This is a very dissonant sound, and even at low volumes can grab the negative attention of someone around you (which can happen if you accidentally sound them in a public space while coding a rat repellent). So we also built a code that generates what we consider to be an abrasive sound, but is well above the audible range so we cannot hear it. We decided on the frequencies of a distressed rat baby (http://www.ratbehavior.org/rathearing.htm). Unfortunately, Matlab’s audiowrite function was not able to save this as a .mp3 file, so please download the code play and use the sound command found to play it on your machine.
(code here: https://drive.google.com/file/d/0B4quZV7NVNf7OW1kQld5QW1KVkk/view?usp=sharing)
Future Work:
If we were to continue to research methods and applications frequency shifting we would write a code that transposes frequencies. Transposition maintains the harmonic ratios of the frequencies present in the wavefunction by multiplying them by a constant instead of linearly shifting them. Changing the sampling frequency at playback also maintain these ratios but in doing so, distorts the audio signal by stretching or compressing the wavefunction. Out next code would have been to transpose frequencies without changing the length of audio sample. We would also like to to detect our own ultrasound frequencies with an ultrasound microphone for qualitative analysis.

Before I comment, let me apologize for getting this done somewhat late. I’m at a conference in Pittsburgh right now and it’s been crazy!
To begin, I found the goals of the project to be quite clear: to perform frequency shifting on recorded or computed sound signals, specifically ultrasound signals. I’ve personally often wondered about this problem, and the ramifications of trying to fix it (i.e. with respect to a record player which, when spinning at the wrong frequency, either plays back sound too low and slow, or too high and quickly).
Next I move to your “Ultrasonic Analysis” post.
Your explanation of “ultrasonic” is crystal clear, though I suppose the name is pretty straightforward. Next, however, you mention that it is necessary to sample at a rate slightly higher than the Nyquist frequency—why is that? I suppose it’s because you have ultrasonic (above 20000 Hz) signals, but when I first looked through this that fact wasn’t immediately clear. Also, what was, all in all, your higher frequency bound (at least at the outset, before you realized you couldn’t measure ultrasonic sound)?
So you’ve changed from shifting high frequencies down to shifting low frequencies up, since you couldn’t detect ultrasound. Are there any major differences, that you know of, in the two approaches? Is one more difficult than the other? It seems like you have to worry less about aliasing errors in the low frequencies, which is nice. Also, the frequency difference between octaves (or other harmonically “nice” steps) is much smaller than an high frequencies. Does this mean that techniques that preserve harmonic qualities are easier to implement?
Now I’ll discuss your “Preliminary Data” post
The inclusion of several examples is quite well done here. With respect to audio, it’s not too cluttered, but gives enough context for those who may be unfamiliar with the basic concepts. However, I do think some visual examples could be beneficial. I think that a combination of sight and sound can really make what you’re doing clear to the reader/listener.
You’ve explained up- and down-sampling really well—I’m just curious how the algorithm is put into practice. Did you experiment with removing different points, and compare the results? Would there even be a noticeable difference?
I’m a little confused when you talk about phase shifting… is this just shifting in the frequency domain? I was always under the impression that “phase” had a different meaning for acoustic waves, which is extracted from the imaginary sound data in the frequency domain.
Now I’m discussing your “More Results” post.
About halfway down, you mention the “harmonic quality” situation—this would be the perfect place for an image (perhaps show it logarithmically so that you don’t bunch up the high frequencies in the graph), to help those of us who prefer to learn visually. Or, perhaps a better way would be to come up with a pretty universally understandable analogy that makes the comparison/conceptualization easier for the viewer. I’m not sure what this would be, but maybe you could think of something.
I like that you again included several sound files, since it gives listeners that perhaps couldn’t perceive differences during your presentation another chance to go back and listen for some subtle differences, especially with regards to harmonics characteristics (or if anyone decided to listen before your presentation).
Now I’ve moved to your “conclusions” post
Again you’ve shifted—back to high frequencies. Why is this?
Conceptually, your methodology makes a lot of sense to me; it’s pretty straightforward to imagine what’s going on. However, I’m still a little confused as to the actual algorithm you used. Did you use the down-sampling technique you mentioned earlier? It looks like, from your graphs, that you performed a “circshift” in the frequency domain.
You say “rat mediation”… I wonder, did you mean “rat meditation?” Silly rats.
What you mention right before your future work—making an abrasive sound from two sinusoids—is super cool. I’d love to see some results there. Future work sounds cool—so, say you were to multiply your signal by 2 in the frequency domain. Is that what you mean by “transposition?” Were there any big problems that made it difficult to do this analysis? I imagine that a little more than just multiplying by a constant goes into it.
Other remarks:
I also wanted to mention that during your talk, you mentioned the “harmonic relations” between frequencies, and how such relations (since they are ratios) are not conserved. You explained that this could lead to dissonance and other sort of unpleasant sounds, which I think you demonstrated superbly both with your description and with your audio example. Well done.
Overall, this project was very interesting, and relatively easy to follow conceptually. I appreciate the focus on sound and demonstrating sound behavior to the audience. As I mentioned periodically, I think your work could benefit from some more visuals (that is not to say that the images you do have are not good; I think they are actually quite appropriate).
This topic is a great choice for a computational physics final project. The use and study of MatLab’s Fourier Transform functions, shifting functions and sound playback commands are all very relevant and well explained in the blog posts. I think overall you chose a great topic—not a “typical” physics topic, but very engaging and a great excuse to apply computational methods in analyzing the subject. My two suggestions are: I wish you found another method of visualization other than the classic line plot, or maybe a second visualization in addition to the line plots, and secondly, maybe a bit more in-depth analysis of the rat repellant project: what are the audible frequencies of rodents? What were you expecting to find? Other than that, the explanation of your processes and the explanations of the physical situations were pretty clear and well organized. I appreciated the suggestions in the “future work” section, and the acknowledgement of the discrepancies between your original goals and end results (it is super typical for those to change, and I appreciated the fluidity of the project). Overall, very well done.
What is the audible range of rodents? I like your conclusion that it is not enough to play a sound in the audible range of rodents but out of the audible range of human beings. The idea that it is also volume and structure of sound that counts makes your reasoning sound. I am not sure how you would change the frequency without changing the overall length of the audio signal.