The previous presentation of results was very limited–limited in the scope of the actual results that were presented, and limited in the scope of analysis. Here, I present further results with a greater analysis of implications, limitations, etc.
First, let us consider why we care about such a scenario. A sphere is a relatively simple object, but also a very interesting one. Many other objects can be modeled as spheres, or as a combination of several. For me personally, I have been working with a spherical microphone, and since I wish to understand how the sound behaves on the surface of this microphone, I need to take into account how the sound is scattering from the microphone. This is the main practical application I am familiar with, though there are bound to be others.
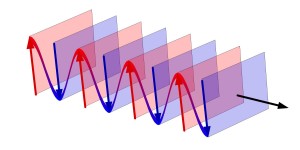
An acoustic plane wave is very simple and is best shown with an image rather than an equation. Note it is very much like it sounds (no pun intended): a plane (in the mathematical sense) traversing through the air.
Source: commons.wikimedia.org
Now, to understand how this plane wave interacts with a sphere, we need several things: 1) for convenience and simplicity, a way of describing the plane wave using spherical coordinates; 2) a series of functions known as spherical harmonics; 3) and to meet a couple of boundary conditions called the Dirichlet Boundary Condition and the Sommerfeld Radiation Condition.
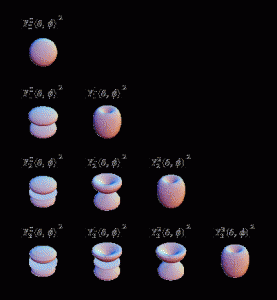
I won’t go into detail here about 1) and 3), but shall simply show results below. As for spherical harmonics, they are to 3 dimensions what Fourier Series are to 2 dimensions: they allow us to break apart 3D shapes or fields into an infinite series of functions. For more on spherical harmonics, see the end of this post.
The equation describing the pressure field at the surface of a rigid sphere (after being struck by plane wave) is as follows:
Where i is the complex unit, n is a term representing the sum index as well as the spherical harmonic order within the sum, k is the wave-number of the acoustic plane wave, a is the radius of the rigid sphere, m is the degree of the spherical harmonic, Θ_k is simply the (theta, phi) pair representing the direction of incoming sound, Θ_s are the (theta, phi) pairs of every point at which we’ve chosen to evaluate the pressure field (or the “sampling points”), and Ynm is the spherical harmonic of order n and degree m. Finally, bn(ka) is given by:
where jn and hn are the type one spherical Bessel and Hankel functions, respectively, and the apostrophe (‘) denotes their derivatives. Note that this pressure field is the very solution we want–that is, the equation of very near field scattering and diffraction all in one. In fact, it is actually a superposition of incident energy and reflected energy (for more on this, see reference [1] below.
Now, in principle this first equation is exact; it yields perfect solutions with no errors. In practice, however, we must approximate this solution on several levels:
- We must truncate the sum in the first equation, as finite computing power only allows finite calculation of spherical harmonics and bn,
- The Spherical harmonics, spherical Bessel and Hankel functions (jn and hn) must be approximated, as they do not have a simple analytical form,
- The number of points at which we can evaluate the pressure field on the surface of the sphere must be finite (e.g. would could choose 64 evenly spaces points, or 128, etc.); ideally we could choose infinite points
Our main priority here are bullet points 1. and 3. Matlab does a very good job of approximating the Spherical Bessel and Hankel functions, and the error attributable to them is small in comparison with the other two errors. Let’s discuss points 1. and 3. in detail (they shall be discussed together since they are related):
Let N be the maximum spherical harmonic order, or the maximum order of our sum (replacing the infinity in equation 1).
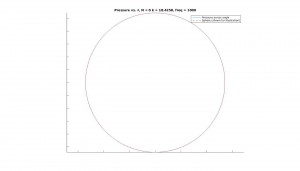
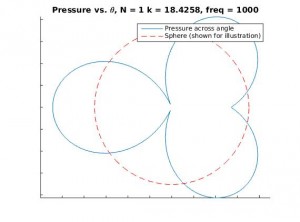
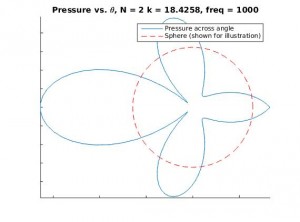
For small N, there are huge errors in the calculated sound field because the spherical harmonics fail to truly estimate the shape of the sound field. They simply can’t produce the detail fine enough. Let’s illustrate the point graphically. Below are the cross-sectional graphs for N=0, 1, 2, and 10 for the sound pressure field at the surface of the sphere, for a plane wave of frequency 1000 Hz.
Notice how the first few graphs fail entirely to capture the true detail of the sound field, whereas the final graph is quite detailed. Spatial errors of this sort, due to the truncation of the sum of spherical harmonics, are called spatial Aliasing Errors.
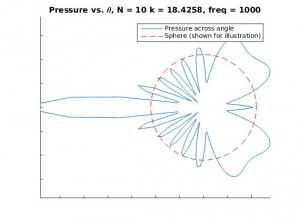
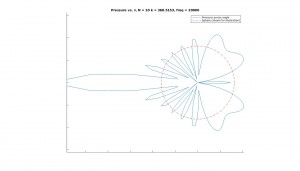
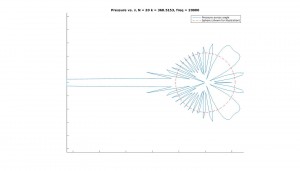
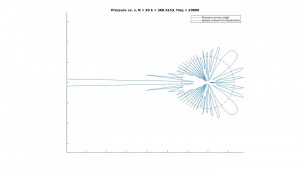
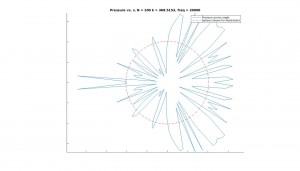
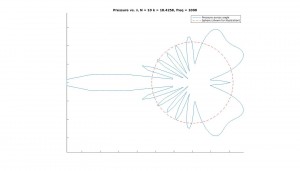
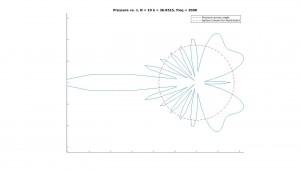
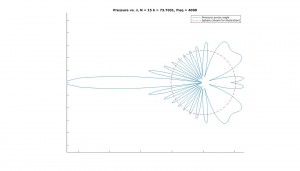
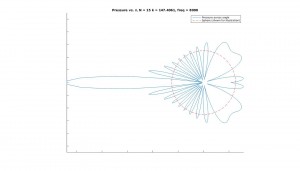
Another type of spatial aliasing occurs when we try to examine high frequency sound. Since we only have a finite number of points to work with, higher frequency sound tends (or shorter wavelength) to be harder to model. The reason is this: as the wavelength gets shorter, it begins to approach the distance between our samples (if we’ve chosen 64 evenly spaced points, for example, there is finite distance between each point). Once this happens, we no longer have enough samples to reconstruct the sound field. This behaviour is akin to the Nyquist Frequency and sampling rate: signals with a frequency higher than the Nyquist Frequency simply can’t be reconstructed accurately. Let’s look at this graphically as well. Below are the cross-sectional graphs for N=10, 20, 30, and 100 for the sound pressure field at the surface of the sphere, for a plane wave of frequency 20000 Hz. 128 Sample points have been used.
It’s looking good, it’s looking good… and it fails. We’ve maxed out our capability to model the sound at 20000 Hz, and further addition of spherical harmonics, after a certain point, actually gives us worse results.
So, it was seen in practice that choosing a maximum order of approximately N = sqrt(M)-1, where M is the number of sampling points, was ideal for most cases. Addition of higher orders may lead to frequency related spatial aliasing as shown above, though in practice it has been observed that somewhat higher values of N may (a few orders more) may also be acceptable [3].
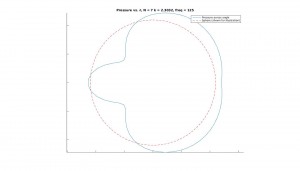
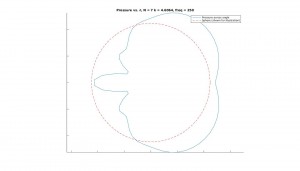
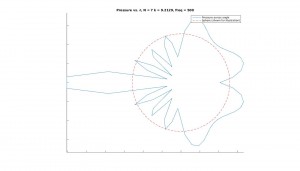
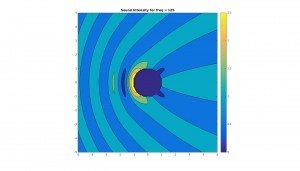
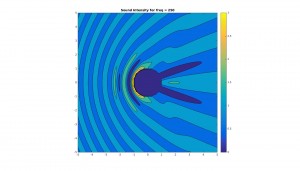
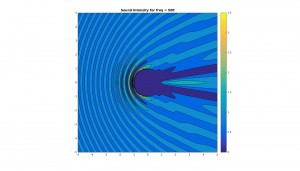
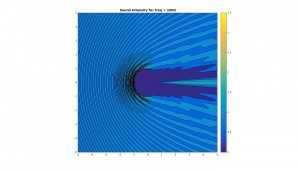
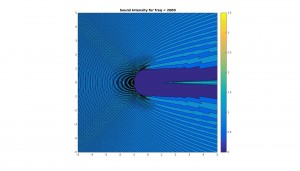
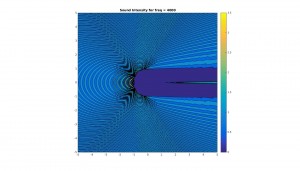
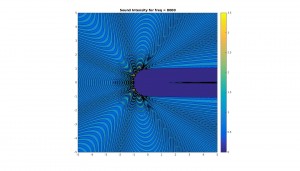
Below are graphs for the 2D cross sectional area of the sound pressure at the sphere, and the corresponding sound field around the sphere. Results are shown for octave bands between 100 and 8000 Hz (125, 250, 500,1000, 2000, 4000, 8000), the frequency range most important for human hearing. Number of sampling points and N have been adjusted periodically to improve resolution.
Sound field on sphere:
Contour plot of sound field in vicinity of sphere (x and y axes are simply xy-coordinates in meters):
Notice how, for low frequency (long wavelength) the scattering is actually quite low. This should make a lot of sense physically, since the larger the wavelength with respect to the sphere, the more likely the sound is to simply diffract around the sphere and “ignore” it altogether. On the other hand, for higher frequency (shorter wavelength), the scattering becomes quite large, especially at the front of the sphere. This should also make sense, because the spherical boundary becomes more and more like a flat surface to a smaller and smaller wavelength, and hence reflects sound approximately back in the incident direction. Note too that for high frequency there much less diffraction than for low frequency.
TODO: more in depth analysis of error, especially numerically. Clean up code. Comparison to limiting case of Rayleigh scattering.
—————————————————————————————
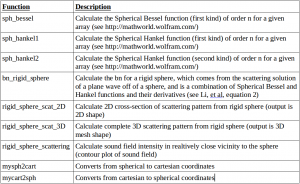
NOTE: Here is a table describing the function of the code. Below the table is a link to the updated code, which have vastly improved commenting to facilitate use. I would recommend using rigid_sphere_scat_2D over its 3D counterpart, simply because the 2D is so much easier to visualize, and since the scattering is symmetric, it tells essentially the same info.
Link to code:
https://drive.google.com/a/vassar.edu/folderview?id=0B3UNwnkM9fLrfkRlb05LdEVOTzhCQWRuRHRCVVFjUDJIMHBpWlF2V3ZKd3UwWXNwVWRua28&usp=sharing
Spherical Harmonics [2]:
Note that spherical harmonic order starts at 0, not 1.
References:
[1] http://ansol.us/Products/Coustyx/Validation/MultiDomain/Scattering/PlaneWave/HardSphere/Downloads/dataset_description.pdf
[2] http://mathworld.wolfram.com/SphericalHarmonic.html
[3] O’Donovan et al. Imaging concert hall acoustics using visual and audio cameras.
[4] Li et al. “Fast time-domain spherical microphone array beamforming.” IEEE Workshop on Applications of Signal Processing to Audio and Acoustics. 2007



Nice work on the modeling. Could you share more why you chose this model? Why have the sound diffract of a sphere and not another shape? How do you determine how many terms to include? Is there another computational model that could be used? A table with your different MatLab programs and a description would be really helpful to the user.