Student Web Mapping Projects

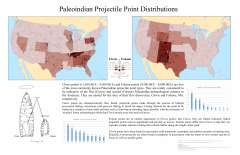
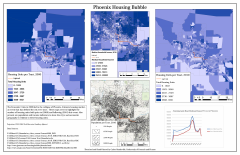
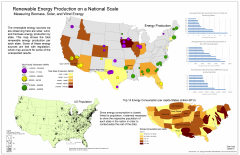
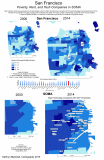
Students enrolled in GEOG 228 – Web Mapping: Advanced Approaches to Publishing recently completed their final projects for the semester.  Students in this course create web maps, map apps, story maps using ArcGIS Online,  which offers new opportunities to publicize and share spatial data. Other applications such as ArcGIS Collector app and Open Street Map promote group sourcing of data, which are explored as well.  Students’ final projects were published on Vassar Maps and Apps and can be viewed at the class page

Posted in Student Work | Comments Off on Student Web Mapping Projects

Solar Projects in New York State

Nearly 10,000 solar projects have participated in New York’s open enrollment solar incentive programs over the past 10 years.  The data was made publicly available on Open NY, New York States open data portal.  (See Environmental Leader’s story about the initial release of the data for more information and background.) The data was acquired and organized by Vassar student Toscane Clarey as part of a project for GEOG 228 – Web Mapping: Advanced Approaches to Publishing. This project was intended to increase visibility of solar projects in New York State.  

The points in the map illustrate aggregated solar installations by zip code (or “City”, as is listed in the pop-up window when clicking an individual point.) The total number of solar projects associated with each point, total nameplate capacity in kilowatt hours (kWh), and the total expected output in megawatt hours (MWh) are also listed in the pop-up window. 

Use the zoom buttons (+/-) and pan around the map and explore local installations. Click the button in the upper-left corner [>>] to view the legend, which indicates the aggregated expected output associated with the relative size of the point symbols. 

Note that southern New York contains a higher number of installations and output, and that rural areas appear to be under-served. 


Posted in Student Work | Comments Off on Solar Projects in New York State

Alumni Mapping Work

The Geospatial Mapping at Vassar blog is proud to showcase alumni work when available.  If you wish to share examples of your geospatial mapping and analysis work, please email necurri@vassar.edu.  

insetlocatormap

In her first week at Michael Baker International, an Engineering firm headquartered in Pittsburgh, PA, Emily Webb (Geography-Anthropology, ’16) had already worked on two mapping projects in which she called upon the cartography skills she learned at Vassar.  In her role for the company, Emily explained, “I work with ArcMap to research spatial statistics and to put together maps for project reports.” She also explained that she started using a vector graphics program for fine-tuning labels in her maps — something she picked up on-the-job. Continue reading

Posted in Student Work | Comments Off on Alumni Mapping Work

Beaver Herbivory at the Vassar Farm Ecological Preserve

By Annie Greene (Biology ’19), Dylan Finley (Urban Studies ’17)

This semester in Lynn Christenson’s ecology class (BIOL-241), we mapped the locations of trees affected by beavers near the beaver dam at the Vassar Farm and Ecological Preserve. Our studies revealed preferences in beaver foraging in regards to species, tree size, and distance from water.  We used Vassar’s “Maps & Apps” ArcGIS Online implementation and the ArcGIS Collector App on a GPS-enabled Apple iPad to map the location of the trees based on their geographic coordinates.

Continue reading

Posted in Student Work | Comments Off on Beaver Herbivory at the Vassar Farm Ecological Preserve

Community Choice Aggregation (CCA) in the Hudson Valley

Renewable_Hudson_Area_of_Focus

Renewable Hudson Area of Focus

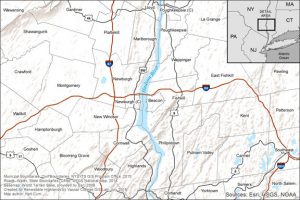
Renewable Highlands is working to help transition the Hudson Highlands region towards environmentally conscious energy consumption by informing local municipalities of the benefits of Community Choice Aggregation (CCA) and asking for their support.  With enough municipalities involved, Renewable Highlands will provide assistance in obtaining and reviewing proposals from qualified energy suppliers, choosing a contract, and implementing the program.  By choosing to participate, municipal leaders give their constituents an option for saving money, stabilizing rates and supporting renewable energy.  At Renewable Highlands’ request, the Vassar GIS Lab recently created a custom map of the region in which the organization intends to appeal to communities (shown above).  Other CCA initiatives in the Hudson Valley include Citizens for Local Power in Ulster County, and Sustainable Westchester.   Continue reading

Posted in Projects | Comments Off on Community Choice Aggregation (CCA) in the Hudson Valley

Vassar Arboretum Web Map

During the summer of 2015, URSI student Samuel Short ’16 and Prof. Mark Shlessman (Biology) used GPS to inventory the specimens based on past maps of the campus Arboretum. With the recent data collected, a new pamphlet map of trees on Vassar’s main campus will soon be available to all members of the Vassar Community, as well as visitors to the campus. The data collected is also being used to prepare the arboretum collection for certification by ArbNet, an international arboreta organization.

Continue reading

Posted in Cool Stuff | Comments Off on Vassar Arboretum Web Map

Maps for Publications

Walker_SRP_web_colorMaps can provide geographic context for academic studies in which location plays an important role.  However, existing maps may not provide information at the scale, extent, and level of detail needed. Custom-designed maps are often required to highlight the specific features, patterns, and processes relevant to the study at hand.  Resources for geospatial mapping available through the Vassar College GIS lab can be leveraged to produce custom maps that serve this purpose. Featured here are some recent maps created in the GIS Lab for articles written by Vassar College professors.

Continue reading

Posted in Cool Stuff | Comments Off on Maps for Publications

Got demographic and socioeconomic data?

At this point in the Spring semester students in Geog/Esci 224: GIS begin to ramp-up work on their final projects, and many of them are looking for data related to a topic or question they will be mapping and analyzing in GIS. While there’s a lot of data to be found, getting familiar with it once you have it – enough to make some useful and interesting maps – can take some time. Different data providers create and organize their data in different ways, which can be difficult to understand at first. Users should also understand something about the methods used to collect and assemble the data. This may have important implications for how the data could and should be used.

Students often want to work with demographic and socioeconomic data, and one of the richest sources of this type of data (at least, in the US) is the U.S. Census and American Community Survey (ACS) data. The purpose of this article is to provide students with a brief introduction to the U.S. Census and ACS GIS data available, and how and where to get it. Continue reading

Posted in Cool Stuff | Comments Off on Got demographic and socioeconomic data?

Final Project Posters: Cartography: Making Maps with GIS (GEOG/ESCI 220)

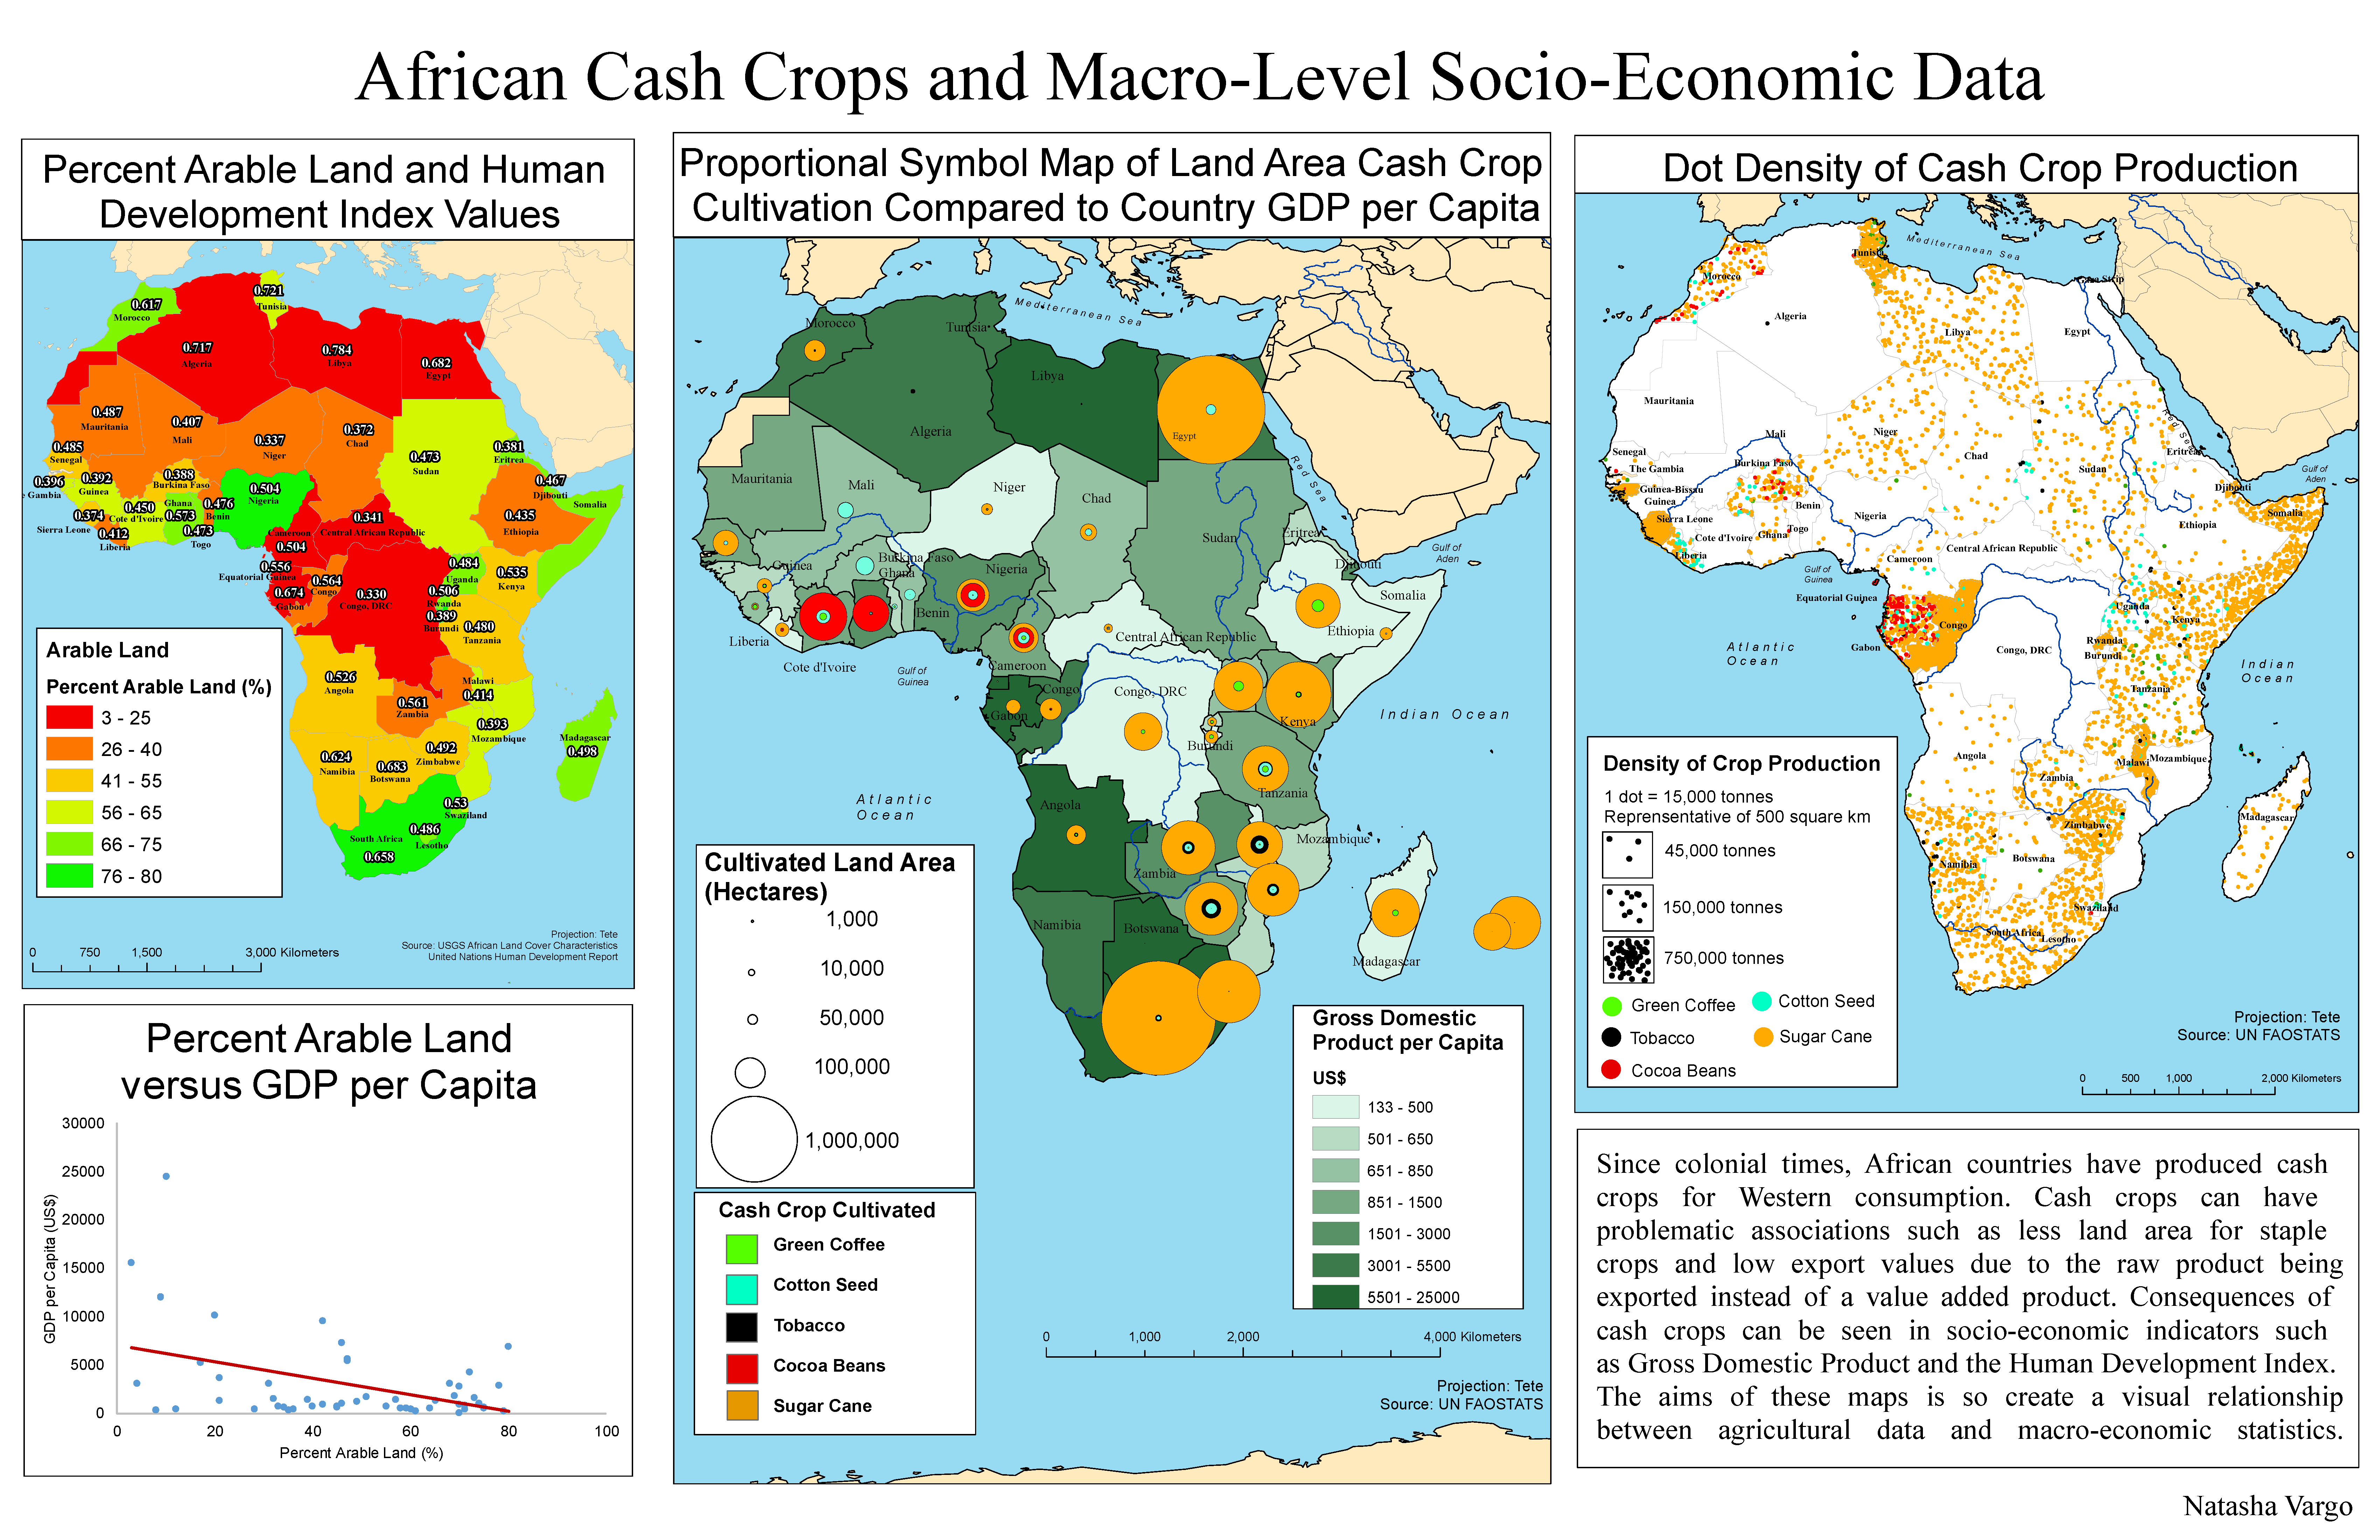
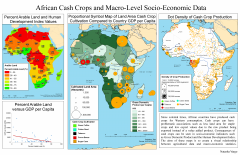
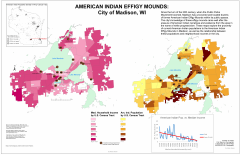
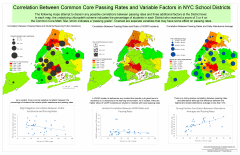
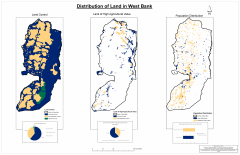
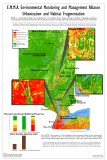
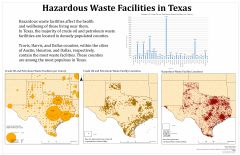
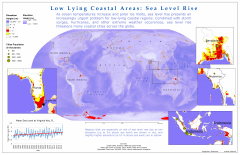
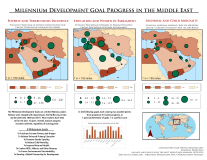
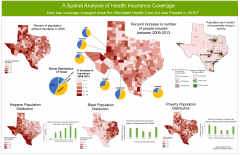
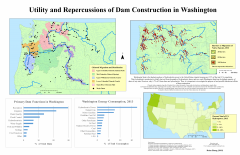
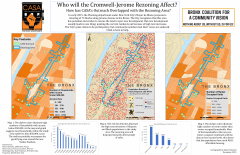
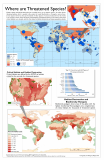
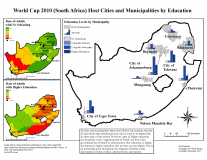
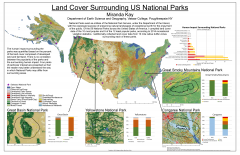
Students in GEOG/ESCI 220 (Cartography: Making Maps with GIS) presented their final projects last week using their cartographic and analytical skills to map features and phenomena ranging from cash crops in Africa to sea level rise in the US to the distribution of land in the West Bank. See the gallery below to view each student’s final poster.

Posted in Projects, Student Work | Comments Off on Final Project Posters: Cartography: Making Maps with GIS (GEOG/ESCI 220)

Mapping the UNDP Human Development Report 2014

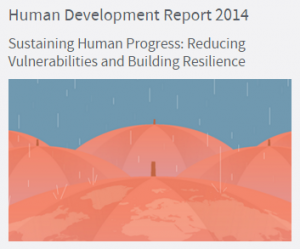
UNDP Human Development Report 2014For 25 years the United Nations Development Programme (UNDP) has been compiling information about human capabilities (opportunities and the availability of choices) that contribute to the The Human Development Approach, rather than simply the richness of the economy in which human beings live into an annual report called the UNDP Human Development Report (HDR). The data from the 2014 Human Development Report was compiled into GIS format for a Geography class mapping exercise, and is available to any Vassar student or faculty member who wishes to use it.  Continue reading

Posted in Cool Stuff | Comments Off on Mapping the UNDP Human Development Report 2014