 Maps can provide geographic context for academic studies in which location plays an important role. However, existing maps may not provide information at the scale, extent, and level of detail needed. Custom-designed maps are often required to highlight the specific features, patterns, and processes relevant to the study at hand. Resources for geospatial mapping available through the Vassar College GIS lab can be leveraged to produce custom maps that serve this purpose. Featured here are some recent maps created in the GIS Lab for articles written by Vassar College professors.
Cayuga Land Claim
The purpose of this map was to illustrate the area of Cayuga land claim in central New York. Because the accompanying article was being submitted to an international journal, it was important that an inset map be included to illustrate the location in the context of New York State and the northeastern U.S. It was also important to show the locations of certain municipalities and NY-90, which would be referenced in the article text. Click image below to view full size version.

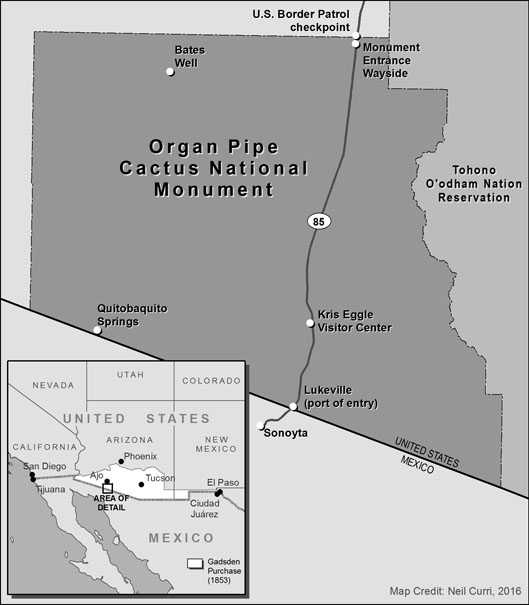
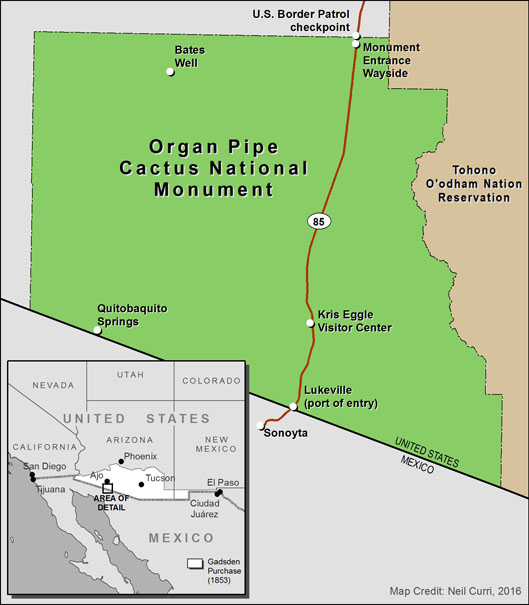
Organ Pipe Cactus National Monument
In this map, the Organ Pipe Cactus National Monument in Arizona is shown in the context of the Gadsden Purchase of 1853, which expanded U.S. territory south to the present-day borders of Arizona and the panhandle of New Mexico. As in the Cayuga Land Claim map, certain geographic features were included in the map, as they were referenced in the text of the article. These features provide the reader with the geographic context needed to better understand the article’s story. Grayscale and color figures were created for print and digital versions of the journal. Click the images below to view the full size versions.
 |
 |
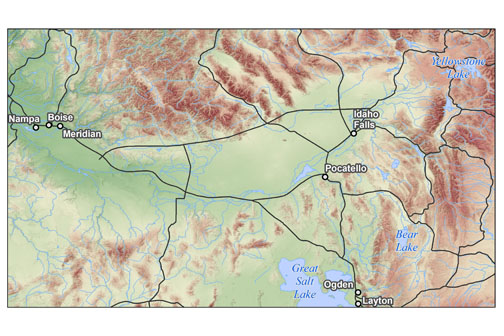
Snake River Plain
This map illustrates the topography of the Snake River Plain in Idaho, with features like roads, cities, and lakes included to provide geographic context. Note that political boundaries are not included, as they would crowd the map with detail not necessary to understanding the article’s story.
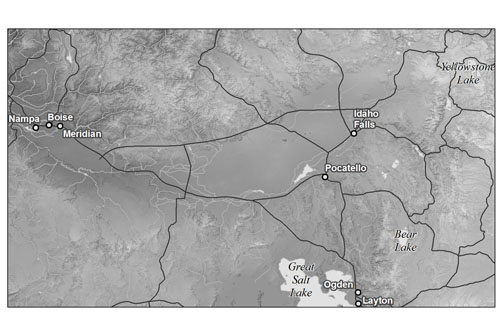
Exported map from ArcGIS Desktop
Additional graphics work needed to complete the figure was performed by ESCI/GEOG Lab Technician and Collections Manager, Rick Jones. As was the case for this figure, final edits to a map created in GIS are sometimes better suited to graphics programs, such as Adobe Photoshop or Illustrator.
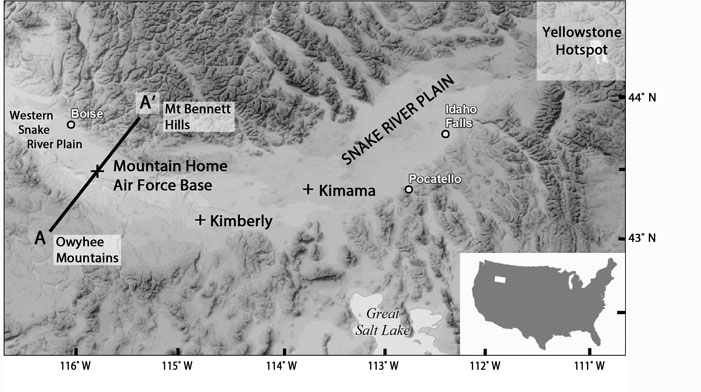
Exported map edited in Adobe Photoshop
The GIS Academic Computing Consultant worked closely with the articles’ authors to ensure that the maps included the required information, that they were produced according to specifications of the journals to which the articles would be submitted, and that the product was finished ahead of the submission deadline. If you are interested in creating maps for journal submissions or other publications, contact the GIS Academic Computing Consultant at necurri@vassar.edu.