 R is becoming the most widely used statistical software in academic science and it is rapidly expanding into other fields. R is a free language and environment for data manipulation, calculation, graphics and much more. It runs on all of the major platforms, including Windows, Mac and Linux. While it is command line driven, several good graphical user interfaces (GUIs) exist that open it up to a wider group of users with differing technical abilities.
Popularity
When various metrics for the most popular data analysis software packages are compared (Muenchen, R.A., 2013), R demonstrates a dramatic increase in popularity over the previous 5 to 10 years. A plot of posts to email discussion lists, shown below, illustrates a rapid growth in discussion of R. And over the past few years, R has become the most discussed software by nearly a two-to-one margin. However, one must be careful when interpreting these results. For example, the consistently low level of discussion for SPSS may be reflective of the fact that it has a simple interface leading to less of a need for discussion. However, there are also fewer variations in analysis offered in SPSS than those that exist in R and other applications with somewhat less user-friendly interfaces.
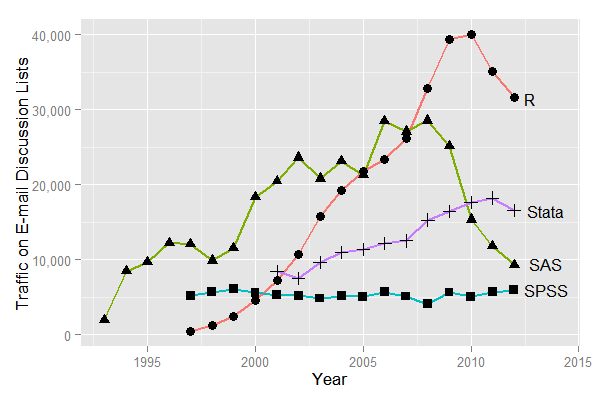
Sum of monthly email traffic on each software’s main listserv discussion list. From “The Popularity of Data Analysis Software”, http://r4stats.com/articles/popularity/.
User Friendly Interfaces
Over the past few years, a number of GUIs for R have been developed that make R more accessible to a wider group of users. RStudio, a popular GUI for advanced users, is what is known as an integrated development environment. This interface is similar to MATLAB, is designed for programmers, and provides syntax highlighting and integrated help among other features.
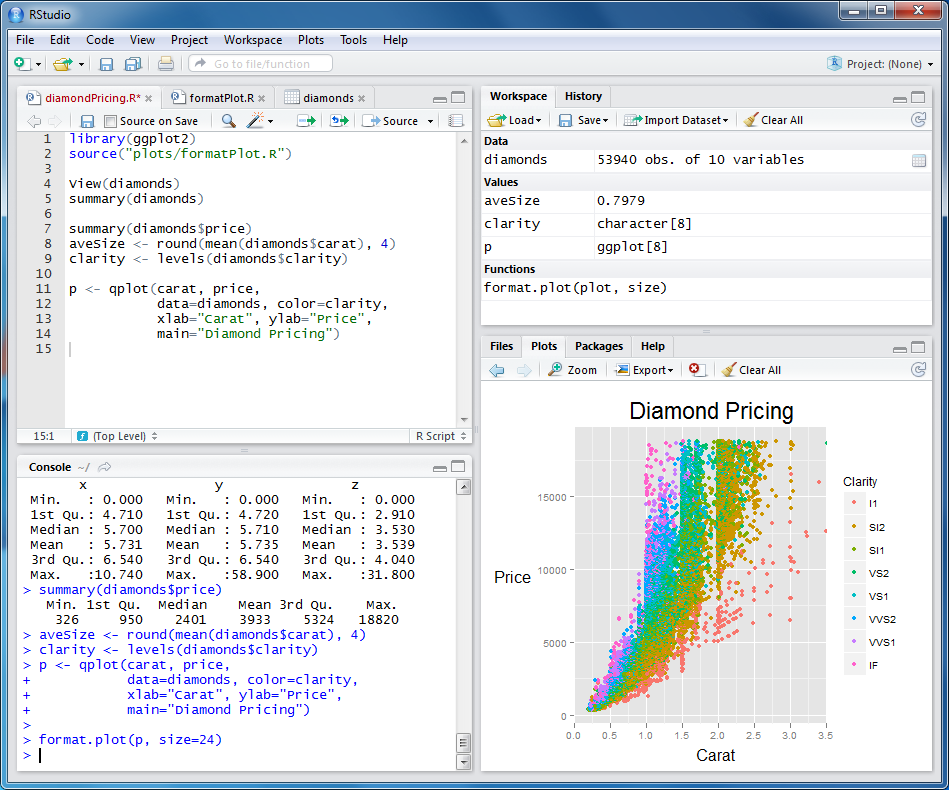
Screenshot of the popular Rstudio graphical user interface.
Rcmdr, pronounced Rcommander, is a basic-statistics GUI that offers menus, buttons, and dialog boxes to simplify usage for those with less advanced technical skills. The commands that are generated via the user’s actions are shown in an output window. They can be edited and resubmitted, if desired, helping to familiarize the user with the R language. This is useful for those with moderate technical ability who are interested in learning basic R commands. A third R GUI, Deducer is designed to be a free, easy-to-use alternative to proprietary data analysis software such as SPSS, JMP, and Minitab. It has a menu system to do common data manipulation and analysis tasks, and an excel-like spreadsheet in which to view and edit data frames.
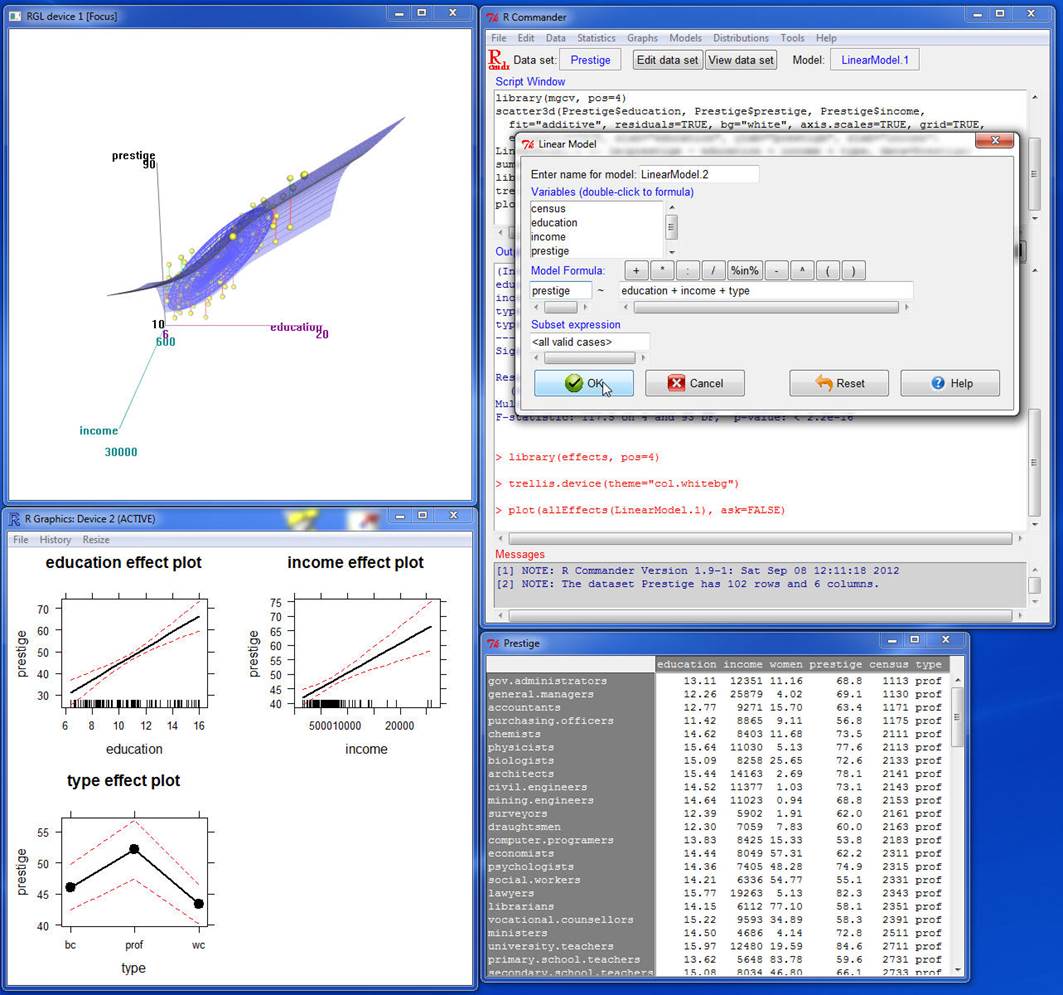
Screenshot of the Rcmdr graphical user interface.
Availability
R and RStudio are installed in the SciVis Lab located in the Mudd Chemistry Building. Additionally, both R and the GUIs mentioned above are freely available and can be easily installed on your personal computer. RStudio also offers a web-based version that can be used in lieu of the desktop version. The availability of a web-based server means that one doesn’t have to install software on a personal computers or go to a computer lab. It can be accessed anywhere there is an internet connection. Our system administrators are in the process of evaluating whether it is feasible to host an RStudio web server on campus, and we are hopeful that this convenience will soon be available to the Vassar community. If you would like to learn more about R, please contact ACS liaison Shelly Johnson.
