Hunter-Gatherers: The San People of Africa

Hunter-gatherer groups, also referred to as “bands,” are the first classification level of societies. In general, hunter-gatherer societies are mobile communities comprised of approximately 100 members. These communities are defined by their patterns of movement. These patterns of movement are directly tied to the seasons thereby allowing them to better hunt for food. Large areas of land are essential for this nomadic way of life. The large sums of land support and supply them with a diverse array of wildlife which they can then use to feed the members of their community. Additionally, the bands live in temporary, movable shelters as they do not settle in one area for a long period of time (National Geographic, n.d.).

One particular group of hunter-gatherers has been identified as the San people of Africa. The San are the earliest known hunter-gathers and established themselves within the region of the Kalahari desert. Within their bands there was no established hierarchy. Disputes between individuals or families were settled through open discussion. Additionally, no single individual had sole ownership of any track of land. Instead, the land that they settled was held by the community who resided on it for the common good (KrugerPark, n.d.).

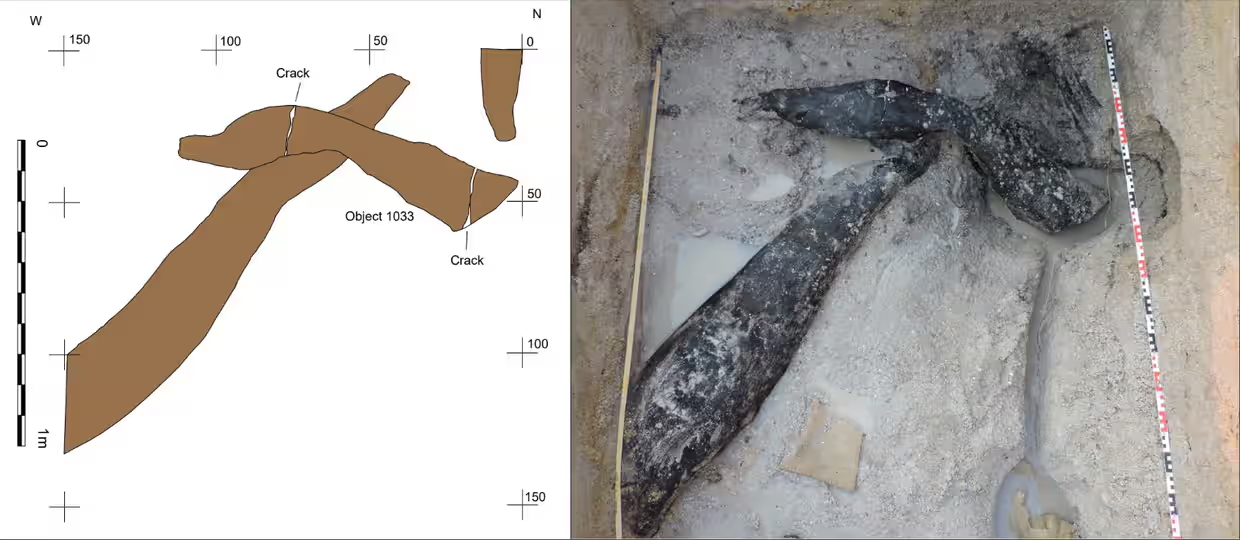
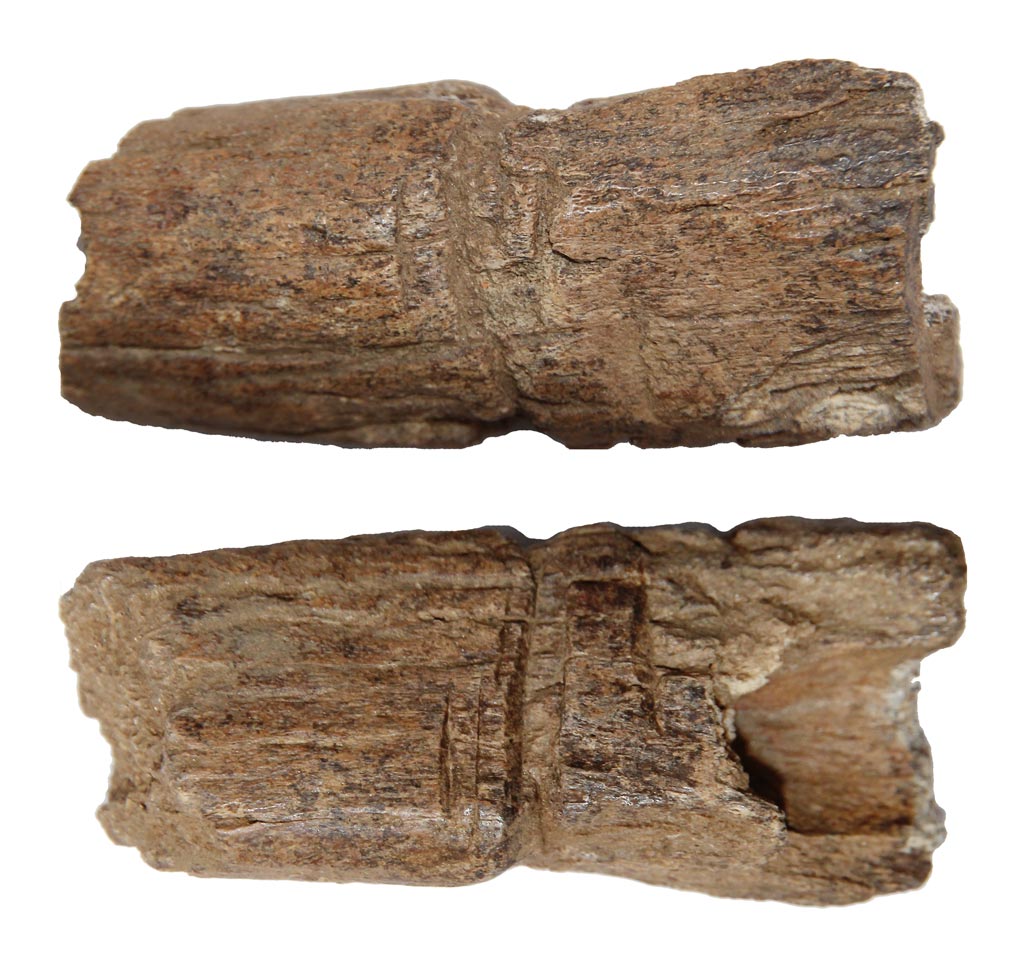
The primary tool that the San used in hunting was the bow and arrow, seen in Figure 1. The arrow did not directly kill the animal. Instead, a portion of the tip of the arrow was coated in poison (Marshall, n.d.). This poison was a neurotoxin that took some time to incapacitate the prey. It should be noted that the poison did not spread throughout the animal but remained in the area closely associated with the arrow strike. This area was cut out and excised so that the remainder of the animal could be used to feed the San. The poison did not spread throughout the animal (KrugerPark, n.d.).

Figure 1: bow and arrow kit of the San people, found by Johannes Lombard in 1962 in the Mhlwazni Valley of Drakensberg. Photographed by Marlize Lombard. (Marshall, n.d.)

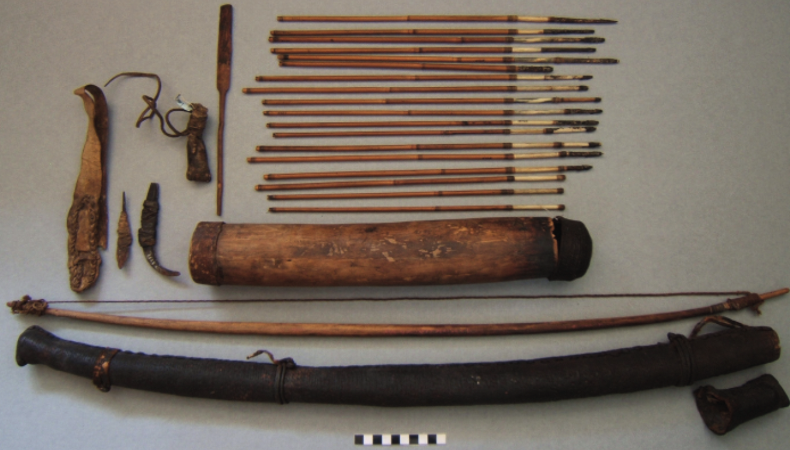
The San’s diet was very diverse and consisted of anything that provided sustenance. It ranged from vegetable matter to meat from zebras, fish, lions and even insects. No part of the animal went to waste. The meat was eaten, the hides were used for clothing and everyday life. And even the bones were consumed for their marrow (KrugerPark, n.d.).

Figure 2: rock painting of an eland with a human figure. (Vea, 2011)

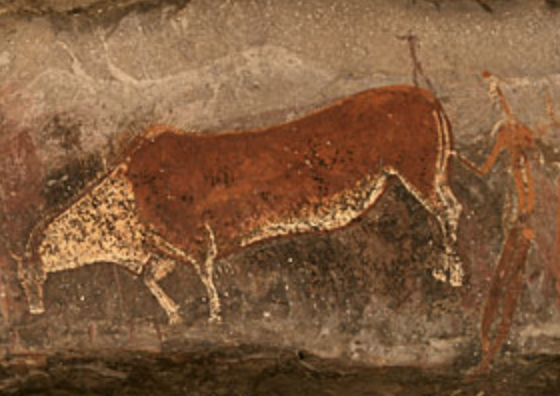
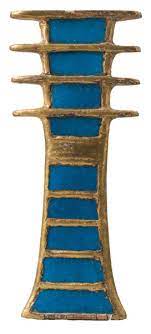
The San rock art, seen in Figure 2, has been discovered in the KwaZulu-Natal, Eastern Cape and the Western Cape provinces (KrugerPark, n.d.). Much of the art depicts bodies in motion whether they be animal or human. The art holds deep spiritual and religious meaning and does not symbolize day to day life. Instead, their art is a vehicle that is used to communicate with the spirit world (Vea, 2011). The primary color employed in the rock art was red. This was interspersed with a spattering of yellow, white, brown and black (KrugerPark, n.d.).

While not a complete description of the many facets of San society, the within provides a small window into important aspects of the San’s everyday life.

Further Research Links:

https://blog.sa-venues.com/provinces/san-rock-art-in-south-africa/ 

https://www.zmescience.com/science/news-science/bushmen-poison-hunting-052543/

References:

“Hunter-Gatherer Culture.” n.d. https://education.nationalgeographic.org/resource/hunter-gatherer-culture.

Marshall, Micheal. n.d. “First Poison Arrows May Have Been Loosed 70,000 Years Ago in Africa.” New Scientist. https://www.newscientist.com/article/2250799-first-poison-arrows-may-have-been-loosed-70000-years-ago-in-africa/.

“San – Bushmen – Kalahari, South Africa…” n.d. https://www.krugerpark.co.za/africa_bushmen.html.

Vea, Tanner. 2011. “Drakensberg: Barrier of Spears ~ San Rock Art of the Drakensberg | Nature | PBS.” Nature. March 2, 2011. https://www.pbs.org/wnet/nature/drakensberg-barrier-of-spears-san-rock-art-of-the-drakensberg/4634/.

New Finds in Zambia: A Different Perspective on Early Hominids

On the banks of the Kalambo River in Zambia, a team of archaeologists have made a new discovery that reframes the way experts think about early hominid societies. The discovery in question are two wooden logs, overlapping at a right angle, and held together by a carved notch, and with additional markings believed to have been made by sharp, stone tools. This find is now possibly the oldest known wooden structure in the world, dated by experts at the University of Aberystwyth to 476,000 years ago. The site, a hard to access beach strip upstream of a 770 foot waterfall that flows into Lake Tanganyika, first hosted archaeological activity in 2006, that was later continued in 2019 by this team of archaeologists from universities and other organizations across the United Kingdom, Belgium, and Zambia. In addition to the remarkable wooden structure, the team also discovered more wooden artifacts, including a digging stick, a log cut on both ends, a wedge, and part of a trap. These finds were dated to around 390,000 years ago. This dates the artifacts as before homo sapiens, leading archeologists to speculate that these were created by an early human species, homo heidelbergensis (Sample 2023).

The Kalambo Falls, near where the artifacts were discovered


One of the factors that make this find so notable is the rarity of wood this old. In this case, these ancient wooden artifacts were preserved due to the waterlogged, oxygen-deprived sediment they were found in. The pieces were dated using a method called luminescence dating, as the finds were too ancient to be analyzed with radiocarbon dating or dendrochronology. Luminescence dating measures the energy of photons being released, and dates the last time the artifact was exposed to sunlight or extreme heat.

The find: the oldest known wooden structure in the world


An additional factor in this artifact’s significance is what it reveals about ancient hominids. The fitted wood is theorized to have once been part of a larger structure, perhaps a walkway, raised platform for storing food, keeping fire off the wet ground, or a base for a house. No matter the purpose of the structure, the implication is the same: early hominids had the capacity to create plans for complex structures, and theoretically a language to communicate about these plans. Geoff Duller, a team member and co author of the study published about the find, remarked “It’s completely changed my view of what people were capable of that time” (Hunt 2023). This also calls into question the belief that early hominids were completely nomadic if they were creating structures such as this one. Furthermore, it also opens up the possibility that more structures like this existed, as the wood used to create them likely would not have survived. As of today, the artifacts are currently being conserved in the United Kingdom, but will be returned to Zambia for analysis. Finally, the archaeological team, along with the Zambian government are working to get the area acknowledged as a UNESCO World Heritage Site.

References:

Harris, Gareth. “World’s Oldest Wooden Structure Discovered in Zambia.” The Art Newspaper – International art news and events, September 21, 2023. https://www.theartnewspaper.com/2023/09/21/worlds-oldest-wooden-structure-discovered-in-zambia

Hunt, Katie. “Archaeologists Unearth Oldest Known Wooden Structure in the World.” CNN, September 21, 2023. https://www.cnn.com/2023/09/20/africa/oldest-wooden-structure-zambia-scn/index.html

“Luminescence Dating Laboratory.” Luminescence Dating Laboratory | U.S. Geological Survey. Accessed September 23, 2023. https://www.usgs.gov/labs/luminescence-dating-laboratory/luminescence-dating-laboratory

Sample, Ian. “‘Oldest Wooden Structure’ Discovered on Border of Zambia and Tanzania.” The Guardian, September 20, 2023. https://www.theguardian.com/science/2023/sep/20/oldest-wooden-structure-discovered-on-border-of-zambia-and-tanzania.

Further Reading:

MUSONDA, FRANCIS B. “100 YEARS OF ARCHAEOLOGICAL RESEARCH IN ZAMBIA: CHANGING HISTORICAL PERSPECTIVES.” The South African Archaeological Bulletin 67, no. 195 (2012): 88–100. http://www.jstor.org/stable/23631395

Barham, L., Duller, G.A.T., Candy, I. et al. Evidence for the earliest structural use of wood at least 476,000 years ago. Nature (2023). https://doi.org/10.1038/s41586-023-06557-9 

Nefertari’s Tomb: A Reflection of Ancient Egyptian Life, Culture, and Religion

A legend in her own right, Nefertari has left a significant mark and her burial has provided archaeologists with invaluable information. Queen of Egypt from 1295 BC to 1256 BC (Encyclopedia.com, n.d.), Nefertari was married to Ramesses II, the third pharaoh of ancient Egypt’s 19th Dynasty; she wielded significant power, working alongside her husband in political affairs (Popular Archaeology, 2019). After her death in 1256 BC, her influence lived on through the people of ancient Egypt who honored her with a magnificent tomb located in the Valley of Queens, a burial site for all the wives of pharaohs. 

Nefertari’s tomb was discovered and excavated by Ernesto Schiaparelli, an Italian archaeologist, in 1904 (Minerva Magazine, 2021). Though her tomb had been looted of many precious artifacts, there were still a good number of artifacts left behind, including: fragments of a pink granite sarcophagus lid, fragments of gilded wood coffin, wall paintings, well-preserved sandals, parts of a gold bracelet, shabti figurines, an amulet, and two mummified knees (Popular Archaeology, 2019). These artifacts alone show how highly revered Nefertari was, reflecting not only her wealth but powerful influence.

Archaeologists can derive many aspects of ancient Egyptian life, culture, and religion through the artifacts in her tomb. For instance, Nefertari was buried with an djed-pillar amulet with her name inscribed on the back. Made of gilded wood and blue vitreous paste, the amulet represents the spine of Osiris, the god of death and the afterlife; the necklace serves as a symbol of stability and eternal life, important aspects of ancient Egyptian religion (Minerva Magazine, 2021). 

Figure 1. The djed-pillar amulet found in Nefertari’s tomb (Minerva Magazine, 2021). 

Another artifact that tells us more about the afterlife is the Book of the Dead. In ancient Egyptian belief, life continues after death in the afterlife. They developed a set of funerary beliefs and practices to make sure the deceased reached spiritual paradise. The most commonly known practice is mummification, which helps preserve the body. Following this process, the ancient Egyptians put the body in a coffin, which was then placed into a tomb with provisions for the afterlife. One of the provisions was burying the dead with funerary books, which contained spells and utterances to help them reach the afterlife safely. Nefertari was discovered buried with the Book of the Dead, the most well-known Egyptian funerary text (Noma, 2022).

Figure 2. A papyrus page from the Book of the Dead (Britannica, 2023).

Nefertari’s tomb is “Egypt’s best artistic documentations of elite culture and the life and ways of one of its greatest queens” (Popular Archaeology, 2019). We know that burials are used to symbolize and serve the dead, but we often forget that burials are made by the living people; therefore, burials are expressions of the living people’s relationship with others still alive. They reflect people’s thoughts and attitudes toward the deceased; hence, they are not the most accurate representation of who that person was (Renfrew). Nonetheless, burials, like Nefertari’s, are excellent resources to uncover what life, culture, and religion was like during a certain time period. 

Reference List

Britannica. “Book of the Dead: Ancient Egyptian Text.” June 16, 2023. https://www.britannica.com/topic/Book-of-the-Dead-ancient-Egyptian-text.

Encyclopedia.com. “Nefertari (c. 1295-1256 BCE).” n.d. https://www.encyclopedia.com/women/encyclopedias-almanacs-transcripts-and-maps/nefertari-c-1295-1256-bce#:~:text=Nefertari%20(c.-,1295%E2%80%931256%20bce),beauty%2C%20judging%20from%20contemporary%20paintings.

Minerva Magazine. “Nefertari: into the Valley of the Queens.” The Past. January 10, 2021. https://the-past.com/feature/nefertari-into-the-valley-of-the-queens/.

Noma. “Queen Nefertari’s Egypt Highlights Ancient Egyptian Masterpieces.” February 3, 2022. https://noma.org/queen-nefertaris-egypt-highlights-ancient-egyptian-masterpieces/#:~:text=Presented%20in%20six%20sweeping%20sections,around%20death%20and%20the%20afterlife.

Popular Archaeology. “Nefertari’s Tomb.” July 19, 2019. https://populararchaeology.com/article/nefertaris-tomb/.

Renfrew, Colin, and Paul Bahn. 2018.  Archaeology Essentials: Theories, Methods, and Practice. Fourth edition. Thames & Hudson. 

Read More:

Hoon Shin, Dong. “Queen Nefertari, the Royal Spouse of Ramses II: A Multidisciplinary Investigation of the Mummified Remains Found in her Tomb (QV66).” National Library of Medicine. November 30, 2016. https://www.ncbi.nlm.nih.gov/pmc/articles/PMC5130223/.

Osirisnet. “Nefertari – QV 66.” n.d. https://www.osirisnet.net/tombes/pharaons/nefertari/e_nefertari_03.htm.

Clovis-First Theory: The Sites That Disprove it

The Clovis-First theory of human migration, a once widely accepted theory of human migration to the Americas, states that human inhabitation of the continent began between 12,900 and 13,100 years ago (Lovgren, 2021). A basic overview of the Clovis-First theory is that the Clovis people—named for Clovis, New Mexico, where lithics were uncovered in 1934—were the first to migrate to the Americas, coming over an ice bridge in Beringia during the later stages of the last glacial maximum. Over time, these mammoth hunters would disperse across the continent with their distinctive lithics being discovered at several archeological sites.

Fig 1: Map of Clovis Sites Across north America

Though there is evidence to support the idea that Clovis people migrated from Asia (Gilbert, 2008), there is little evidence to prove that they were the first. Furthermore, over recent years the discovery of further sites around the country lends credence to the theory that many different groups of humans migrated to the Americas over several periods of time. Though there are many to choose from, I am going to examine only two different archeological sites, both of which predate the Clovis people.

Fig 2: University of Oregon Archeology Field School excavation of Rimrock Draw where 18,000+ year old artifacts were found.

The first site to catch my attention while I was researching dates back 18,000 years, in what is now Oregon. Back in 2012, archeologists uncovered teeth belonging to a—since extinct—species of camel, which had been buried by the eruption of Mount St. Helens over 15,000 years ago (Pettigrew, 2023). As the researchers dug deeper, they also discovered a blade which had bison blood residue on it; due to stratigraphic position, it is thought to be even older than the camel’s teeth. Upon carbon dating the teeth, researchers discovered that the teeth themselves dated back to over 18,200 years ago, confirming that this site pre-dates the Clovis peoples by over 4,500 years at the low end.

Fig 3: Map Showing Coopers Ferry Archaeological Site

The second important site that caught my attention was Coopers Ferry, a site in Idaho dating back over 16,000 years. At Coopers Ferry, over 200 artifacts were found, including stone tools, lithics, and bone fragments (Davis, 2019). Based on the fact that an opening in the ice caps across Canada would not appear for up to another millennium, it is likely that the people of Coopers Ferry arrived from the Pacific (Wade, 2019). Further credence is given to this theory based on the position of the site along a river, where humans likely came upstream from the ocean. Due to those facts, Coopers Ferry and Rimrock Draw fundamentally contradict the Clovis-First theory, and redefine the dynamics of human dispersal across the Americas.

References

Erlandson, J. M. (2013). After Clovis-first collapsed: Reimagining the peopling of the Americas. Paleoamerican odyssey, 127-131.

Lizzie Wade, Ancient site in Idaho implies first Americans came by sea. Science 365,848-849(2019). DOI:10.1126/science.365.6456.848

Fiedel, S. J. (2014). Did pre-Clovis people inhabit the Paisley Caves (and why does it matter)?. Human Biology, 86(1), 69-74.

Goebel, T., Waters, M. R., & O’Rourke, D. H. (2008). The late Pleistocene dispersal of modern humans in the Americas. science, 319(5869), 1497-1502.

Gilbert, M. T. P., Jenkins, D. L., Gotherstrom, A., Naveran, N., Sanchez, J. J., Hofreiter, M., … & Willerslev, E. (2008). DNA from pre-Clovis human coprolites in Oregon, North America. Science, 320(5877), 786-789.

Hutcherson, E. (2023, July 15). Archaeologists find new evidence in southern Oregon that suggests human habitation 18,000 years ago. OBP.

Stastna, K. (2012, July 13). Clovis people not 1st to arrive in North America | CBC News. CBCnews. CBC.

Pettigrew, J. (2023, July 11). Possible proof of oldest human-occupied site found in Oregon, dating back over 18K Years. KOIN.com.

Lovgren, S. (2021, May 3). Clovis people not First Americans, study shows. Science. Article

Waters, M. R., Stafford Jr, T. W., & Carlson, D. L. (2020). The age of Clovis—13,050 to 12,750 cal yr BP. Science Advances, 6(43), eaaz0455.

Davis, L. G., Madsen, D. B., Becerra-Valdivia, L., Higham, T., Sisson, D. A., Skinner, S. M., … & Buvit, I. (2019). Late upper paleolithic occupation at Cooper’s Ferry, Idaho, USA,~ 16,000 years ago. Science, 365(6456), 891-897.

Fig 1: Waters, 2020

Fig 2: Hutcherson, 2023

Fig 3: Davis, 2019

Further Reading

Understanding Human Relationships with Animals and Environmental/Climatic Shifts – Faunal Analysis

Analysis of animal remains preserved on archaeological sites can tell us a lot about humans’ relationship with animals. Faunal analysis, a research device used in Zooarchaeology, can tell us whether an animal was domesticated and died naturally or wild and was killed for meat or its hide. For example, tooth eruption in a deer can tell archaeologists what season a deer may have been killed in and tooth wear can tell how old a deer may be, or markings on fish bone can suggest the catching methods (e.g. spearing, netting, or fish hooks). Faunal analysis can also be helpful in tracking environmental and climatic shifts.

Two sides of a horn fragment. Markings on the bone suggest the incisions were done by humans. (Fig. 1)

So how does faunal analysis work?

With a collection of bones from the same species of animals, either from the same site or from other sites close by, archaeologists can analyze the bones and compare the findings. Wear on the teeth can suggest domestication as domesticated and wild animals have different diets. Anatomical changes in bone structure may be present in domesticated animals as they may not require the same physical structure as their wild counterparts. The distribution of these animal remains can tell us what animals ancient humans were eating and farming. Ancient human involvement with animal bones, either direct or indirect, is often referred to as cultural modification. Cultural modifications can be burn marks, butchery marks, or any sort of modification that relates to bone tools, ornaments, or similar items. These modifications provide great insight into the culture and living style of the settlement, band, or tribe that happened to modify these bones. A great example of these cultural modifications is seen in Fig.1. Marks on a horn fragment suggest human involvement with this animal, however, the incisions happened to go all the way around the bone meaning that it wasn’t simply a butcher’s knife that made these incisions. Reasons for incisions remain unknown but it’s a great example of human modification.

The change in migratory patterns of fish due to climatic shifts (Fig. 2)

In regards to environmental shifts, faunal analysis can also be helpful. Water temperature affects the environment where fish live as certain species migrate to cooler waters for summer and warmer waters for winter. Distribution of fish bones can alert archaeologists where certain species of fish may live. As the waters warm, most warm-water species will spend more time in their summer migration patterns as cold-water species will have to travel farther to find the environment they need to survive, as seen in Fig. 2. Analysis and distribution of these fish bones can indicate ancient migration patterns due to environmental changes and how that affected human settlement.

Faunal analysis is a fascinating topic that’s been a huge aid in archaeological finds. Telling us more about ancient human diets, and environmental changes, and even furthering the knowledge of early agriculture and domestiction, this method of analysis will continue to be one of the greater methods in zooarchaeology and the field of archaeology itself.

References:

https://climatechange.chicago.gov/climate-indicators/climate-change-indicators-marine-species-distribution#:~:text=Changes%20in%20water%20temperature%20can,migrating%20back%20during%20the%20winter.

https://www.uwlax.edu/mvac/process-of-archaeology/lab-analysis/faunal-analysis/

https://textbooks.whatcom.edu/tracesarchaeology/chapter/ancientfoodways/

https://www.researchgate.net/figure/The-changing-coastal-residency-patterns-of-migratory-fish-species-in-Narragansett-Bay_fig13_346719749

Read More:

https://www.sciencedirect.com/topics/social-sciences/zooarchaeology

https://en.wikipedia.org/wiki/Zooarchaeology

The Father of Egyptian Pottery Seriation

Sir William Matthew Flinders Petrie was an influential archaeologist who primarily worked in Egyptology. He published around 1,000 pieces on ancient through medieval Egypt, but is most well-known for his work on ancient Egyptian pottery seriation. He is credited with inventing seriation as a whole, which is the practice of organizing artifacts in chronological order. In 1901, Flinders Petrie created a revolutionary pottery seriation chart based on predynastic burial sites at Abadiyeh and Hu, which organized pottery into different classes and ages. These classes include incised black, polished red, wavy-handled, and so on. His methodology combined stratigraphy and visual cues, but unfortunately, he often included personal biases and wild theories in his findings. Much of Flinders Petrie’s findings have been revised or debunked. However, his invention of seriation has been adopted by most archaeologists, and is still used today. It was the best form of dating before modern methods, such as radiocarbon dating.

Flinders Petrie’s pottery seriation

Using seriation, Flinders Petrie aimed to determine the ages of various burial sites. He had assistants draw the pots he found, then he organized them into types and ages. He noted that though form stayed the same, styles varied, which allowed him to further narrow down the age of the graves. Because of the unique style of the burials (not mummies, positioned bodies, etc), Flinders Petrie actually decided that he had discovered a new race, rather than the graves being Egyptian. This demonstrates that although seriation can provide relative ages for sites, it does not determine what the content actually means.

Drawings of the graves excavated by Flinders Petrie

Other than Egypt, Flinders Petrie worked on sites in Palestine and Britain, and made discoveries concerning Greece and Israel. On many of these occasions, he applied seriation. Aside from pottery, he conducted research on homes, the pyramids, ancient cities, papyrus scrolls, and much more. His life consisted of numerous important contributions to archaeology (he was even knighted for them), and he died at age 89 in Jerusalem.

Of course, seriation is not only used for pottery. It can be used for almost any artifact, at any site, and anywhere in the world. It can even be applied to disciplines such as art history. In the textbook, the example given was about gravestones in Massachusetts and how their design indicates what time period they were made. They are extremely far removed – physically and temporally – from predynastic Egypt, yet the same technique can be applied to both burial sites. Though Sir William Matthew Flinders Petrie had his fair share of strange ideas, his invention of seriation has, and will, remain a staple of archaeological dating methods.

Sources:

https://the-past.com/shorts/the-picture-desk/flinders-petries-sequence-dating-chart/ (info + photo)
https://fitzmuseum.cam.ac.uk/explore-our-collection/highlights/context/patrons-donors-collectors/william-matthew-flinders-petrie (info)
https://www.whipplelib.hps.cam.ac.uk/special/exhibitions-and-displays/conflicting-chronologies/establishing-predynastic-egypt (info + photo)
https://www.britannica.com/biography/Flinders-Petrie (info)

Other references:

https://www.youtube.com/watch?v=xwYk9-U8H5k

https://www.britishmuseum.org/collection/term/BIOG62763

Stratigraphy in Archaeology and The Grand Canyon

Friday, September 16th, my group of classmates finished our fieldwork at the Kimlin Cider Mill and the remains of its horse-drawn cider press. The old mill served as a popular café destination for Vassar students of the early 1900s—our class returned to the mill to search for any signs of its historical mill or any material that would have pointed towards life in the early 20th century. We used methods of stratigraphy and other archaeological survey systems to do so, recording our observations in each 10 cm increment we created below the sod. After a while, we could see how the layers slowly began to change in soil makeup and earth density, as well as the age of artifacts we found. This method of layered ground work that we performed at the old cider mill was especially interesting to me, as it felt like a direct representation of the readings in our class textbook, and also made me question other areas of stratigraphic surveying and the history revealed beneath our feet. Our combined reading and layered ground work reminded me of the ancient sedimentary layers of the Grand Canyon, which stuck out to me when I visited the national park as a child. 

Sedimentary Layers

The Grand Canyon’s ancient and distinct layers of rock are some of the world’s clearest examples of prehistoric sedimentation. The canyon’s strata is separated into various ages and subgroups, which formed on top of each other over millions of years of erosion and sediment build up, creating the sharp lines seen in the image above. According to the Grand Canyon’s National Park services, the oldest of the Canyon’s visible rock layers are up to 1,840 million years old (Mathis, Bowman). The Grand Canyon’s rock stratification is significant because of its visual representation of archaeological and geological site history. Just by viewing the Canyon’s rock features, one is looking hundreds of millions of years into the past. 

Grand Canyon’s Sedimentary Layers & Age Groups

Apart from the Canyon’s Geological stratification, the National Park is home to an extensive amount of human history and ancient relics. Up to eleven Native American groups have been associated with the Canyon over thousands of years. Among the remains of ancient Native American living spaces and stone houses, artifacts of pottery, tools and small animal figurines are among the most interesting of the Grand Canyon’s hidden relics (“Archaeological Resources”). I was reminded again of our fieldwork which brought us face-to-face with forgotten objects hidden below ground. 

Completing my fieldwork by observing layers of the ground below us helped me better understand some of our world’s most important examples of geological history. My connection with our class fieldwork and the Grand Canyon helped me connect our textbook definitions of archaeology to real world examples, and encouraged me to look deeper into the archaeological history of one of America’s most famous natural sites. After our fieldwork and my research on the Grand Canyon’s ancient sedimentary layers, I was able to put value to the phrase, ‘the deeper you dig, the older things get.’

Works Cited

“Archaeological Resources – Grand Canyon National Park (U.S.” National Park Service, https://www.nps.gov/grca/learn/historyculture/arch.htm. Accessed 17 September 2023.

Mathis, Allyson, and Carl Bowman. “Telling Time at Grand Canyon National Park (U.S.” National Park Service, 25 April 2018, https://www.nps.gov/articles/age-of-rocks-in-grand-canyon.htm. Accessed 17 September 2023.

Additional Resources:

“Grand Canyon Geology”

“Whose Land Am I On? Native American Tribes in the Grand Canyon”

Use-Wear Analysis: How it Works and What it Can Tell Us

Use-wear analysis is a technique employed by archaeologists, more specifically lithic analysts, to help understand the function of found tools. It is performed through macroscopic and microscopic analysis of these tool’s surfaces and edges in order to determine what the tools might have been originally used for. It is most commonly utilized for stone or rock tools but can be used on other materials as well, such as flint and bone. The term wear is generally defined as “the progressive loss of substance from surfaces as they move against each other”. (Adams, 2017.) and by studying this wear archaeologists are able to understand what purpose the tool served. Through use-wear analysis, questions such as “what material were these stones used on?”, “how were they used?’, and “why were they used?” are all able to be answered. (Texas Beyond History.)

An example of findings determined through use-wear analysis is the difference between pottery polishers and stone polishers. In a blog published by the Desert Archaeology Inc, Dr. Jenny Adams discusses how she was able to determine these slight differences using use wear techniques. “The stones selected for polishing pottery or stone are fine grained, meaning that the stone burnished the surface being polished rather than abrading it.” (Adams, 2017.) In contrast, “The shiny surface on a well-used pottery polisher has numerous abrasions caused by temper and other particles in the clay.” (Adams, 2017.) Archaeologists are even able to tell which parts of the tool were held in the hand of the person using it through microscopic analysis and studying the abrasions as seen below in Figure 1. When you compare Figure 1 and Figure 2, it is easy to see that Figure 1 is clearly much more rounded and smooth than the granular appearance in Figure 2. Hence, Figure 1 displays the area in which the used held the tool, whereas Figure 2 displays an unused area of the tool.

Figure 1: Granular, unused part of the tool (Adams, 2017.)

Figure 2: Rounded and smoothed part of the tool held in hand (Adams, 2017.)

The process used to conduct use-wear analysis varies for each study, but typically the artifacts are examined using “bright field microscopy” (Adams, 2017.) in their unwashed condition so that potential residues left over such as animal hair, blood, plant grains, wood fragments, can be identified and used as possible clues to help further understand the purpose of the artifact. Next, the scientists look at the striations on the rock as well as the bumps and abnormalities or smoothness on the edges of the rocks to understand where the rock bore the most force, and in turn how that translates to its use. By using residues as well as examining the striations imprinted on the tools, archaeologists can usually come to a conclusion and determine the tools’ use-actions which include “scraping, planning, slicing, whittling, boring, and cutting”. (Texas Beyond History.)

Reference List:

Adams, Jenny. November 30, 2017. “The Tell-tale Art: Recognizing Use-wear on Stone Tools.” Desert Archaeology, Inc. https://desert.com/use-wear/ 

Texas Beyond History. https://www.texasbeyondhistory.net/varga/images/use.html 

“Use-wear Analysis.” Newcastle University, The Cutting Edge. https://research.ncl.ac.uk/thecuttingedge/aboutourproject/use-wearanalysis/ 

Tree Rings Warn of Megadrought for Western U.S. and the Americas

Dendrochronology is the scientific method of dating events and understanding environmental changes through the study of tree rings. A subfield of dendrochronology is dendroclimatology which focuses specifically on climatic events, using these tree rings to understand past climates. Tree rings can be very useful in studying big-picture patterns and analysis. If a year is particularly dry the tree’s rings will show up thinner, and on wetter years a tree’s rings are thicker creating a yearly outline of the climate centuries back. Dendrochronology works well in more arid climates, where the trees’ ring growth is more sensitive to environmental changes than trees in humid tropical areas. In the Arctic, and in other countries at high altitudes the size of tree rings correlates not with moisture but with temperature. There trees have thinner rings with the cold and thicker rings with warmth.

Drawing of tree rings showcasing how dendrochronologists analyze the rings

The Western U.S. and areas of the Americas, specifically Chile, have a very arid climate which has helped dendroclimatologists understand the climate patterns of this area. There are also some very old trees in the California area which helps to date back centuries. There have been many studies on the trees in these areas as the process works well with the climate and is more clear than in other places. Studies from the Western U.S. have shown a pattern of severe droughts happening about once a century, although only a few are officially classified as megadroughts. Studies on tree stumps underwater have also lined up with the pattern of severe drought. These stumps showed a megadrought that lasted for decades, allowing these trees to grow in streams and lakes. This severe drought was made significantly worse by the effect of humans on the climate. In the Americas, specifically Chile dendroclimatologists discovered a similar pattern to that of the Western U.S. There has been a once-a-century megadrought in the Americas throughout history. These are often preceded by a warm North Atlantic Ocean, rising global temperatures, and a change in the relationship between La Nina and El Nino. With the changes in climate change scientists are concerned that these droughts will become significantly worse. In the late 1500s, there was an incredibly severe megadrought that lasted decades, and today looking at the charts we are reaching similar levels of drought, which is increased by human activity.

‘The Guardians’ graph of droughts in the American South West, highlighting the current megadrought and the 1500s megadrought

Both the studies in the Americas and in the Western U.S. show that human activity accounts for roughly 46% of the increased severity of the drought. Dendroclimatology can show us the patterns in climate we should be prepared for but can also showcase how human activity worsens and exaggerates natural patterns.

Further Research:

https://www.eurekalert.org/news-releases/622755

https://yaleclimateconnections.org/2022/08/how-climate-change-spurs-megadroughts/

https://www.globalwaterforum.org/2021/06/08/we-found-a-secret-history-of-megadroughts-written-in-tree-rings-the-wheatbelts-future-may-be-drier-than-we-thought/

References:

Chang, Alvin. “What Tree Rings Reveal about America’s Megadrought – A Visual Guide.” The Guardian, Guardian News and Media, www.theguardian.com/us-news/ng-interactive/2021/jun/17/tree-rings-america-megadrought-visual. Accessed 17 Sept. 2023.

Nash, Stephen E. “Tree Rings Are Evidence of the Megadrought-and Our Doom.” SAPIENS, 30 Jan. 2023, www.sapiens.org/archaeology/tree-rings-are-evidence-of-the-megadrought-and-our-doom/.

Voosen, Paul. “A Warning from Ancient Tree Rings: The Americas Are Prone to … – AAAS.” Science, 2019, www.science.org/content/article/warning-ancient-tree-rings-americas-are-prone-catastrophic-simultaneous-droughts.

Tree Ring Dating, and its Practical Application

Margo Gramiak

Most people are familiar with the concept that in a cross section of a tree, one ring is equivalent to one year of the tree’s life. What most people don’t know is how much more each tree ring can tell us. 

Beyond just age, each individual tree ring holds knowledge of past climate. Because one year is represented by one ring, the condition of each ring can indicate what the climate was like at the specific time of its formation (Neural Academy 2018). Exploring this concept is a form of dendrochronology, which directly applies to paleoclimatology, the study of past climates (Neural Academy 2018). Our climate records only go back 150 years, and the practice of dendrochronology allows us to fill in gaps prior to what’s recorded (Neural Academy 2018). From an archeological standpoint, this is a great tool to better understand the past weather conditions, and to accurately date wooden structures and artifacts. 

Each year, a tree grows a new cambium layer (Stoller-Conrad 2017). The growth rate of this layer depends on several factors. Seasonal progression can be determined, as an increase in cell wall thickness, and a decrease in cell size is evident as the seasons advance (Neural Academy 2018). This is based on water availability, temperature, and how these factors fluctuate. Other changes in climate can also be identified based on markings found in the layers. For example, scarring from forest fires is evident in cross-sectioning (Figure 1) (Stoller-Conrad 2017).

Figure 1. Tree cross-section showing ring variation based on environmental and seasonal change. Graphic by Jessica Stoller-Conrad.

Ideal climate leads to higher growth rates (Neural Academy 2018). This is key in how historical atmospheric conditions can be determined. Yearly conditions are reflected in the size of tree rings (Figure 1) (Neural Academy 2018). Ideal conditions produce wider rings, and vice versa. Overlapping and comparing data from large groups of trees from the same area allows us to form a complete record of the climate (Alpecole 2011). This is referred to as the cross dating method (Figure 2). As more and more samples from different time periods and places are collected, the database broadens, and the climate timeline continues to become more accurate and extensive (Alpecole 2011).

Figure 2. How utilizing the cross dating method can create a cohesive climate record and a way to accurately date wood. Graphic by Paul R. Sheppard.

Dendrochronology is commonly utilized in New York City’s historic districts, as wood was significant in the construction of the original parts of the city (Duncombe 2023). Wood found in these buildings holds important climate knowledge. For this reason, preservation and sampling of these historic buildings is crucial. 

One example is the case of sample collection at a historic site in Manhattan, Terminal Warehouse, in 2019 (Figure 3) (Duncombe 2023).

Figure 3. Terminal Warehouse, Chelsea, Manhattan. Picture taken by Terminal Warehouse Staff.

Based on collected samples, researchers were able to identify that the wood collected was longleaf pine (Duncombe 2023). They measured the rings, recorded their widths (Duncombe 2023), and compared the recorded sequence of numbers to others in the database. It was discovered that most of the timbers found in Terminal Warehouse were harvested in the late 1800s, and were likely from western and central Georgia, as well as eastern Alabama (Duncombe 2023). It was also concluded that they were likely grown on dry, mountainous slopes. Researchers went even deeper using additional historical context, and concluded that the majority of the lumber was most likely from Sample Lumber Company, in Hollins, Alabama (Duncombe 2023). From here, it was transported to a port in Savannah, Georgia by railroad, before making its way up the Hudson River on a schooner (Duncombe 2023).

This is just one of many examples of the use of dendrochronology in an archaeological context. The process, though seemingly so simple, is incredibly impressive and important. It’s exciting to consider what future research and dendrochronology, specifically tree ring dating, could reveal.

Additional Resources

More about general dendrochronology: https://www.environmentalscience.org/dendrochronology-tree-rings-tell-us

More about dendrochronology in New York City:  https://www.nationalgeographic.com/environment/article/timber-salvaged-from-new-york-city-buildings-reveals-ancient-climate

Works Cited

Alpecole, “Dendrochronology,” Geo.org. August 29, 2011. https://www.geo.uzh.ch/microsite/alpecole/static/course/lessons/28/28c.htm

Duncombe, Jenessa, “Finding Climate History in the Rafters of New York City Buildings,” EOS.org. February 22, 2023. https://eos.org/features/finding-climate-history-in-the-rafters-of-new-york-city-buildings 

Neural Academy. “Dendrochronology (Tree Ring Dating),” 3:24. May 19, 2018. https://www.youtube.com/watch?v=-Vfg4GieRTc

Stoller-Conrad, “Tree rings provide snapshots of Earth’s past climate,” Climate.nasa.gov. January 25, 2017. https://climate.nasa.gov/news/2540/tree-rings-provide-snapshots-of-earths-past-climate/

Terminal Warehouse Staff, “Terminal Warehouse,” Terminalwarehouse.nyc. July 9, 2024. https://terminalwarehouse.nyc/