Tag Archives: Fourier

More Results – Shifting Frequencies Up and the Effects of Linear Shifting

Last week we used Matlab to record original audio file using a desktop computer microphone.

Please find the code here:

https://drive.google.com/a/vassar.edu/file/d/0B4quZV7NVNf7MFFWU0lMVGpEZ00/view?usp=sharing

Upon contacting the appropriate members of the Vassar physics faculty, it has come to our attention that the school does not posses an ultrasound detector. We then tried extremely high sampling rate using a normal microphone to try and capture ultrasound frequencies with no avail.

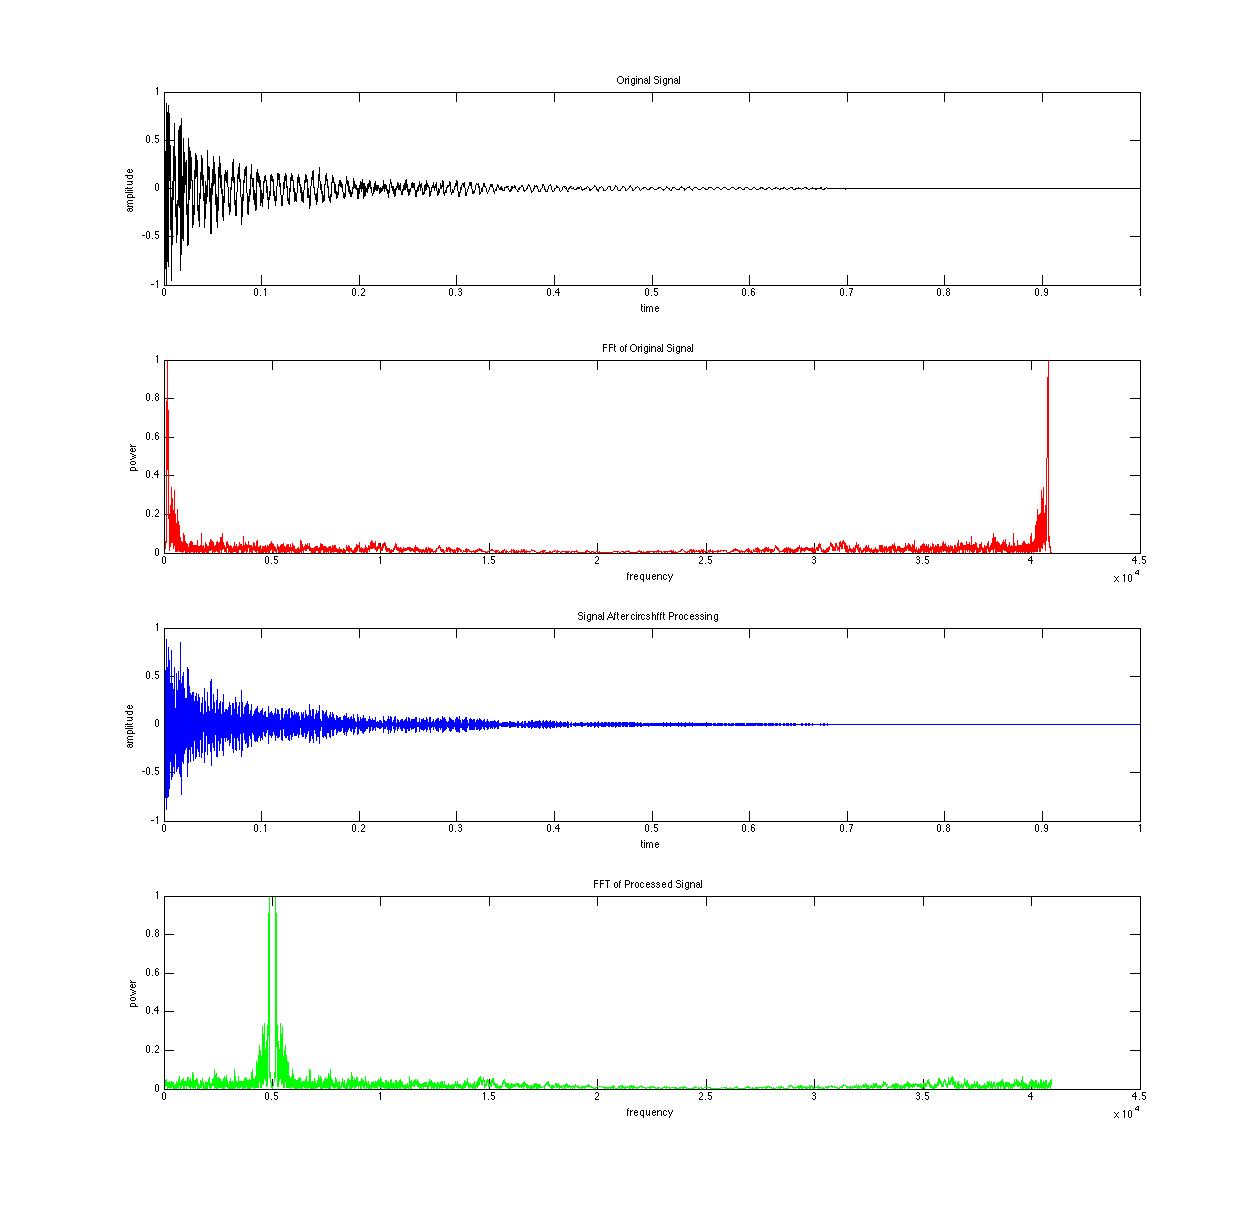
instead we took a signal with a frequencies in the infrasound range, even though it was not originally a sound vibration. specifically we took the power signal from a red and green laser inside an interferometer from the Fourier transform spectroscopy lab and turned it into a wav file. We then took the fft of that wave, and used the circshift function on the fft data to moved it up in the frequency spectrum to the audible range.

Please find the code and necessary audio file here:

https://drive.google.com/open?id=0B4quZV7NVNf7LXJqNERTZEpYckU&authuser=0

https://drive.google.com/open?id=0B4quZV7NVNf7VW5LTVczUUNablVBMzkzdmJWOWctclRxSGdZ&authuser=0

Shifting Frequency Linearly

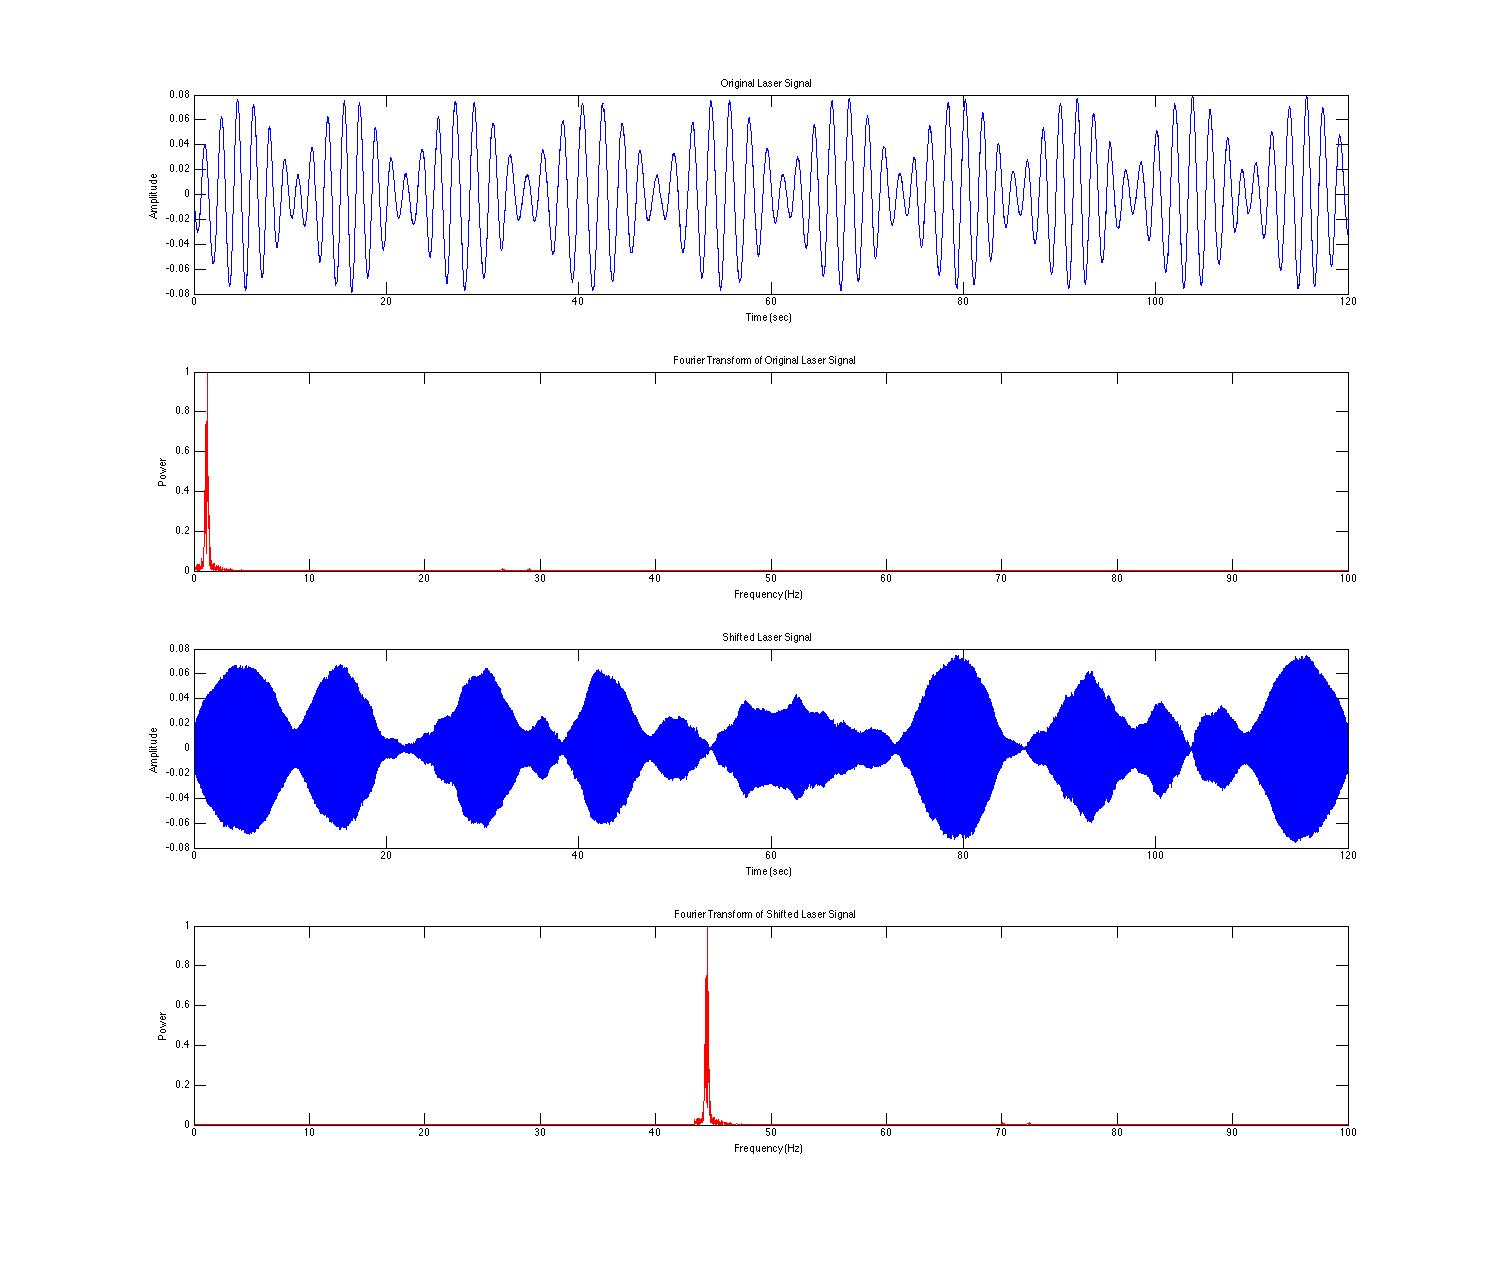
Notice the shape of the shifted signal. We hope to account for the error in the audible signal by accounting for the harmonic ratios.


This method of frequency shifting does not change the amount of time the file takes up, but it does not maintain the ratio between the frequencies. Because the shift is linear, it changes the harmonic interval between the frequencies. An example of this would be an interval of an octave. if you have a frequency of 200 Hz the next octave of the same musical pitch would be twice the frequency 400 Hz. If you shift both of those frequencies up linearly by 100 Hz you would have frequencies of 300 Hz and 500 Hz. The ratio between the two new frequencies is different than in the original. The effect is made noticeable in the following examples:

Shifting up 34 Hz

Shifting Up 39 Hz

Shifting Up 44 Hz


The next step is to maintain the harmonies using a by keeping the ratios constant as we shift the frequencies. Matlab’s findpeaks function will aid us in performing this task.

We decided to make a signal of our own and play with changing frequencies to see how it effects the wave and its Fourier transform.

Please find the code here:

https://drive.google.com/open?id=0B4quZV7NVNf7SEZqeEtTY2dRU2s&authuser=0

Share

Audio Signal Processing – Preliminary Data

We have used Matlab to read, write, plot, and play audio files. We begin by taking the fast fourier transforms (fft) of these audio files and manipulated the locations of the frequencies using different methods.

Original Sample


1. changing the sample rate

Audio files have a given sample rate at which they are recorded, usually 44.1 kHz. If you play the audio file back at a different sample rate the pitch of the audio is changed. For example, if you play the audio at 88.2kHz the frequency of the sound is higher due to the wave function being read faster; this however also changes the length of time of the audio sample (something we want to avoid in our project).

 Half the Sample Frequency

Twice the Sample Frequency


2. upsampling/downsampling

By adding samples to the array of the sound file, but playing it back at the original sampling rate, changes the pitch of the audio file when played back. This is done by either adding elements to the array every nth element (upsampling) or deleting every nth sample of the array (downsampling). Upsampling decreases the frequency and downsampling raises the frequency. This also changes the amount of time the sound file takes on playback because it changes the length of the array being read, but not the speed at which it is read.

 Upsampling

Downsampling


3. phase shifting

When taking the fft of a wavefunction, you get an array of amplitudes, and the matrix element it the frequency of which the amplitude value is representative. When phase shifting , the elements get shifted down or up and the elements at the end of the array are looped to the beginning.

Made in Matlab

The top two graphs show the original signal and its Fourier transform. The bottom two graphs illustrate the effect of phase shifting.

 Phase Shifting


4. finding peaks

If you use a peak finding function of the fft of a wavefunction, you could use those values to rebuild the signal using sinusoidal function of frequencies of the locations of the peaks. if you were to shift the values of those peaks before rebuilding the wavefunction, you could in theory create a wavefunction of a different pitch without changing the amount of time. We have yet to implement this method, but it is part of our next trials.


Please find the Matlab code here:

https://drive.google.com/a/vassar.edu/file/d/0B4quZV7NVNf7ako4RlBkeUNETXc/view?usp=sharing

Sound File Source:

http://eleceng.dit.ie/dorran/matlab/

Share