Instrument Background
This week’s work comprised of researching the various physical parameters needed as input for the model, which for the harpsichord is functioning properly. I initially believed that there might be a better way to describe the pluck wavefront on the string than simply two straight lines starting at zero at the edges at ![]() and in the middle, at some midway point, at
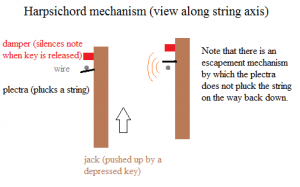
and in the middle, at some midway point, at ![]() . However, this model, used in the book for the guitar, is physically accurate for the harpsichord as well, as both are plucked via a simple mechanism which, unlike the piano, does not impart a time-varying initial force, but rather a simple lift-and-release:
. However, this model, used in the book for the guitar, is physically accurate for the harpsichord as well, as both are plucked via a simple mechanism which, unlike the piano, does not impart a time-varying initial force, but rather a simple lift-and-release:
Figure 1: Diagram of the harpsichord’s plucking mechanism (own work).
I simulated the bridge power spectra of four notes from the range of a typical harpsichord: C, middle c, c’, and c”. However, the wire materials used in a typical instrument vary depending on the range of the note sounded; usually red brass is used in the lowest bass, yellow brass in the tenor range, and iron for the rest (Beebe). These different materials, naturally, have different densities, which play an important role in calculating the tension of the string (an input parameter that cannot be directly measured with any ease).
Calculating Tension
Begin with the equations for the fundamental frequency ![]() of a vibrating string (which defines the note sounded; the quality of the sound is dependent on the strength of specific higher harmonics that also sound):
of a vibrating string (which defines the note sounded; the quality of the sound is dependent on the strength of specific higher harmonics that also sound):
![]()
where ![]() is string length,
is string length, ![]() is tension, and
is tension, and ![]() is the total mass of the string (Vibrating String). More useful to us is the string’s volumetric mass density
is the total mass of the string (Vibrating String). More useful to us is the string’s volumetric mass density ![]() :
:
![]()
where ![]() is the (very small) radius of the wire. These equations can be combined to give:
is the (very small) radius of the wire. These equations can be combined to give:

Armed with an expression for tension containing only known values, the simulations can be run. Note that length, density, and radii data can be found in the bibliography (Di Veroli)(Rose)(Metals and Alloys)(Beebe).
Results
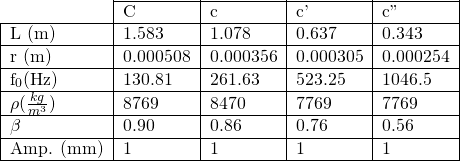
Using the following parameters (some of which are from bibliography, cited above, while others were from personal measurement), the bridge force spectra were computed:

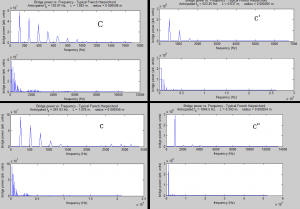
Graphical representation of the fft’s of the four bridge force spectra computed (shown each at two different scales):
Figure 2: Force spectra for harpsichord strings given parameters above. Please click on image to view; any size other than full screen is illegible (hence why it is not full screen here).
Note that the waves in this model do not decay with time; this is a choice in the model and should not strongly effect the outcome, as the intention of the model is to simulate the harmonic frequencies immediately after the initial pluck, not the long term evolution of the system.
As the strings become shorter, the plucking point moves closer to the center of the string, changing the plucking ratio and altering the character of the sound, as indicated by a lack of abundant higher harmonics in the shorter strings (right two figures). This is in agreement with a qualitative understanding of the instrument; bass notes tend to have a more unique sound compared to the high notes.
Further, using the sound function in MATLAB to play back signals produces a very encouraging result: the sound generated purely by this computational model does, in fact, sound like a harpsichord. A further step of the project, analyzing data from the instrument itself, will tell whether or not the model is in quantitative agreement.
The next installment of this project will examine the clavichord, which has a method of sound generation almost unique among musical instruments, and hopefully will include analysis of actual harpsichord data.
Bibliography:
Beebe, “Technical Library, Stringing III: Stringing Schedules“. Accessed 4/21/2015 at http://www.hpschd.nu/index.html?nav/nav-4.html&t/welcome.html&http://www.hpschd.nu/tech/str/sched.html (see “Hemsch Double”)
Claudio Di Veroli, “Taskin Harpsichord Scalings and Stringings Revisited“. Accessed 4/21/2015 at http://harps.braybaroque.ie/Taskin_stringing2.htm
Malcolm Rose, “Wires for harpsichords, clavichords and fortepianos“. Accessed 4/20/2015 at http://www.malcolm-rose.com/Strings/strings.html
“Metals and Alloys – Densities“. The Engineering Toolbox. Accessed 4/20/2015 at http://www.engineeringtoolbox.com/metal-alloys-densities-d_50.html
“Vibrating String“. Georgia State University, Accessed 4/21/2015 at http://hyperphysics.phy-astr.gsu.edu/hbase/waves/string.html
Code
https://www.dropbox.com/s/l8f3sscmel1qdko/Kachelein_Project_Results1.m?dl=0


I changed the image (Wikipedia images are, from what I can tell, safe to use for educational purposes, but just to be sure, I made my own image from my own knowledge, omitting unimportant parts). I also addressed the fact that the plucking ratio affects the sound spectrum the most. The string’s shape evolves over time in that the initial triangular pluck moves, but the shape of this wavefront does not change at all in this model.
What are the permissions on copying and posting Wikipedia images? You may need to take that image down.
Which parameters affect the sound the most. The radius of the wire didn’t seem to matter but the plucking point does. What is your motivation for this model. It is always good to remind the reader.
Does the string more or less retain this initial shape or does the shape evolve over time?