Abstract:
Using an approximation designed for this project, the energy storage capability as well as the capacitance of several simple, slightly physically impractical, square parallel plate capacitors were found. Compared to the idealized model taught in introductory physics, these capacitor store 90% to 97% the energy and have 94% to 98% the capacitance. These discrepancies are caused by the finite dimensions of the plates, which result in fringing effects at the edges. The accuracy of my model is likely high, based on a comparison of the approximations used and a sampling of values produced by the exact, theoretical model, which itself proved too computationally intensive to use extensively with the resources available. Overall, the discrepancies from the ideal model are fairly significant (a few percentage points) at the plate separations studied, indicating that this method could be quite useful for electronics applications. At closer, possibly more realistic plate separations, this relatively complicated model may prove too time consuming to justify its use over the ideal model, which represents the limit as separation approaches 0.
Methods:
Using Coulomb’s law for one particle , a massive grid of tens of thousands of points charges spread evenly across a predefined area could be constructed. The field of this grid was then compared at a few points to the field of the exact, theoretical values predicted by the more general (but not most general) form of Coulomb’s law:
,
or more explicitly:
This was to determine how accurate the approximation was, though the exact method could not be used all the time as it was determined to be very computationally inefficient.
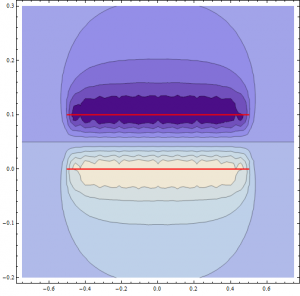
Plotting the electric field magnitude of a cross-section of the grid configuration like that described above, it is clear that the quantized nature of the grid disappears far away from it, but up close there are sharp irregularities (red lines represent the plates that are being modeled). Fringing effects can also be seen (note that a vector field proved too computationally intensive to plot). The configuration below is for a 14 by 14 grid for computational ease, much less fine that the 211 by 211 grids used in the simulations.
The field of a fine grid at thousands of locations within the capacitor was then calculated. From here, all parameters depending on E (the most important of which are energy storage, W, and capacitance, C) could be determined using:
(Griffith’s 4th Ed. eq. 2.45 and 2.55) where potential difference is V = Ed, an approximation from the ideal model used in the interest of time (though the E used was not the ideal values). Note that d = plate separation. Also note that the first equation was used in summation form (V here is volume) due to the quantization of the data (i.e. there was no easily integrable function for E).
Raw Data:
This project dealt with very large matrices (several were 3 by 1024) to examine the slightly variable electric field within a capacitor, and as such, much of that data is not of interest. The end results of these computations, however, are. The plates for all capacitors simulated were 4 square meters and had positive or negative 10^-6 Coulombs on them, with separation distance the only parameter being varied. Separation distances used were 0.01 meters, 0.015 meters, 0.02 meters, 0.025 meters, 0.03 meters, and 0.035 meters. Respectively, the energy that these capacitors stored in the space between the plates were (in milli-Joules): 0.137452, 0.202963, 0.266781, 0.328944, 0.38957, and 0.448766. Their respective capacitances were (in nano-Farads, a fairly typical capacitance unit (Griffiths 105)): 3.47951, 2.29386, 1.70372, 1.3506, 1.11583, and 0.948688.
Compared directly to the values predicted by the ideal model (namely that and
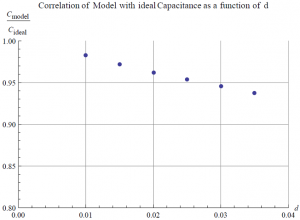
, A = area of one plate), the respective energy storage values are 97.36%, 95.84%, 94.49%, 93.20%, 91.98%, and 90.82%, while the respective capacitance values are 98.24%, 97.15%, 96.21%, 95.34%, 94.52%, and 93.75% (capacitance data is seen in the figure below).
So, while the values attained from both models are similar, the ideal model always overestimates the performance of the capacitor. To visualize the effect of plate separation on capacitor performance, below is an animation relating the two values. The separation is displayed above the left figure (green is the negative plate, blue is positive), while the straight line in the plot on the right is the energy storage as a function of time of the ideal capacitor. Data points are values from the model. Only a corner of the capacitor here is in view; if the whole object were displayed, the small separations would barely be noticeable:
http://youtu.be/7HJuCksc5gcReferences:
- Griffiths, Electrodynamics 4th Ed.
- Knight, Physics for Scientists and Engineers 2nd Ed
- Servers through vapps.vassar.edu
Mathematica:
- Core Folder (heavily commented, containing all necessary functions and graphics): https://www.dropbox.com/s/yk6omufo0sv4vlp/Final_ModelingCapacitors_Kachelein_PHYS341_2014.nb
- Giant Data Folder: https://www.dropbox.com/s/tyyymcrwlo1oyex/Final_ModelingCapacitors_Kachelein_PHYS341_2014_GIANT%20DATA%20FOLDER.nb


Nice visualizations with each plate separation being a data point. Label your axis. I like your annotations in your code. You may want to indicate how long it takes to run your code.